www.biogeosciences.net/6/2433/2009/
© Author(s) 2009. This work is distributed under the Creative Commons Attribution 3.0 License.
Biogeosciences
The Arctic Ocean marine carbon cycle: evaluation of air-sea CO
2
exchanges, ocean acidification impacts and potential feedbacks
N. R. Bates1and J. T. Mathis2
1Bermuda Institute of Ocean Sciences, Ferry Reach, Bermuda
2School of Fisheries and Ocean Sciences, University of Alaska Fairbanks, Fairbanks, Alaska, USA
Received: 8 June 2009 – Published in Biogeosciences Discuss.: 30 June 2009
Revised: 25 September 2009 – Accepted: 29 September 2009 – Published: 5 November 2009
Abstract. At present, although seasonal sea-ice cover
mit-igates atmosphere-ocean gas exchange, the Arctic Ocean takes up carbon dioxide (CO2) on the order of −66 to −199 Tg C year−1 (1012g C), contributing 5–14% to the global balance of CO2sinks and sources. Because of this, the
Arctic Ocean has an important influence on the global carbon cycle, with the marine carbon cycle and atmosphere-ocean CO2exchanges sensitive to Arctic Ocean and global climate
change feedbacks. In the near-term, further sea-ice loss and increases in phytoplankton growth rates are expected to in-crease the uptake of CO2by Arctic Ocean surface waters,
al-though mitigated somewhat by surface warming in the Arc-tic. Thus, the capacity of the Arctic Ocean to uptake CO2
is expected to alter in response to environmental changes driven largely by climate. These changes are likely to con-tinue to modify the physics, biogeochemistry, and ecology of the Arctic Ocean in ways that are not yet fully understood. In surface waters, sea-ice melt, river runoff, cooling and uptake of CO2through air-sea gas exchange combine to decrease the
calcium carbonate (CaCO3) mineral saturation states ()of
seawater while seasonal phytoplankton primary production (PP) mitigates this effect. Biological amplification of ocean acidification effects in subsurface waters, due to the reminer-alization of organic matter, is likely to reduce the ability of many species to produce CaCO3shells or tests with profound
implications for Arctic marine ecosystems
1 Introduction
The Arctic Ocean is currently experiencing rapid environ-mental change due to natural and anthropogenic factors that include warming (e.g. Serreze et al., 2000; Polyakov et al.,
Correspondence to: N. R. Bates
(nick.bates@bios.edu)
2002; Serreze and Francis, 2006; Overland et al., 2008), sea-ice loss (Cavalieri et al., 2003; Maslanik et al., 2007; Shi-mada et al., 2007; Giles et al., 2008; Comiso et al., 2008), and other physical changes (Wu et al., 2006; McGuire et al., 2006) as well as biology and ecosystem structure changes (Arrigo et al., 2008; Pabi et al., 2008). These changes and feedbacks could have profound impacts on the Arctic Ocean marine carbon cycle and the importance of the Arctic for the global carbon cycle and the balance of carbon dioxide (CO2) sinks and sources. In a recent review, Macdonald et
al. (2009) compiled inorganic and organic carbon budgets of the Arctic Ocean. Here, we review the present understanding of the marine inorganic carbon cycle, air-sea CO2
disequilib-rium and rates of air-sea CO2gas exchange, the physical and
biological processes that influence Arctic Ocean CO2 sinks
and sources, the impact of ocean acidification and the poten-tial future drivers of change such as sea-ice loss, phytoplank-ton primary production (PP) and freshwater inputs. The ge-ographic scope of this review encompasses the Arctic Ocean shelves (i.e. Barents, Kara, Laptev, East Siberian, Chukchi, Beaufort and Canadian Archipelago Seas) and central basin (i.e. Canada and Eurasian Basin), but does not extend to the gateways of the Arctic Ocean including the Greenland, Ice-landic, Norwegian, and Bering Seas, and Hudson and Baffin Bays.
As context for this paper, a brief background on the phys-ical and biogeochemphys-ical setting is presented in Sect. 2. Rel-evant information about historical sampling in the Arctic Ocean, methods for estimating air-sea CO2exchange rates,
considerations about carbonate chemistry and relationships between shelf metabolism (net autotrophy versus net het-erotrophy) and CO2 sink/source issues are summarized in
Fig. 1. Schematic of the Arctic Ocean, central basin (Canada and Eurasian Basins) and Arctic continental shelves (with approximate
boundaries of each Arctic shelf sea), and major rivers draining into the region. General surface circulation features are also shown. Inset: Characterization of Arctic Ocean continental shelves as “inflow”,“interior” or “outflow” shelves according to Carmack and Wassmann (2006).
CO2 sink on the Arctic shelves and central basin is
esti-mated, with predictions for near-term CO2 flux rates in an
era of rapid change (Sect. 4). The impacts of rapid change in the Arctic Ocean and the potential feedbacks on the ma-rine inorganic carbon cycle and air-sea CO2 exchange rate
are also discussed in Sect. 5. Vulnerabilities of the Arctic marine carbon cycle relate to such factors as sea-ice loss and warming, biological and ecosystem changes, and hydrolog-ical/freshwater input changes. We also discuss the impact of ocean acidification, and biological and physical processes on the marine carbon cycle and calcium carbonate (CaCO3)
mineral saturation states in the Arctic Ocean (Sect. 6).
2 The physical and biological setting of the Arctic
Ocean
The relatively small Arctic Ocean (∼10.7×10⁶km2) is al-most completely landlocked except for the Bering Strait, Canadian Archipelago, Fram Strait and Norwegian Sea gate-ways that allow exchanges with the Pacific and Atlantic Oceans (Fig. 1). The relatively broad, generally shallow (<200 m deep) and almost annular continental shelves sur-rounding the central basin comprise about 53% of the area of the Arctic Ocean, making it unique compared to other ocean basins. All of the Arctic Ocean continental shelves are highly varied, unique and difficult to characterize generically.
As a framework for this review, the Chukchi and Bar-ents Seas can be characterized as “inflow” shelves (Carmack
and Wassmann, 2006) where the import of nutrient-rich wa-ter from the Pacific and Atlantic Oceans, respectively, sus-tains high rates of seasonal phytoplankton PP or net com-munity production (NCP). Other shelves such as the Kara, Laptev, East Siberian and Beaufort Seas constitute “inte-rior shelves”, which are highly influenced by exchanges with other shelves, while the Canadian Archipelago represents an “outflow shelf” where Arctic Ocean water is exported to the Atlantic Ocean via Hudson and Baffin Bays. In the cen-tral basin of the Arctic Ocean, waters of the Canada Basin or Beaufort Gyre are separated from the Eurasian Basin by the surface transpolar drift, with inputs and outputs of At-lantic Ocean water through the Fram Strait and shelf-basin exchanges of water across the entire Arctic Ocean. Cen-tral basin waters are highly stratified vertically with distinctly different physical and chemical properties of surface waters and subsurface halocline, Atlantic Ocean layer and deep-water layers, with deep deep-waters having limited exchanges with the Atlantic Ocean.
2003; Benner et al., 2003; Guo et al., 2004). Siberian (Ob, Yenisey, Lena and Kolyma) and North American (Macken-zie, Yukon) rivers contribute significantly to land-ocean in-puts (Peterson et al., 2002; McGuire et al., 2006; Serreze et al., 2006; Cooper et al., 2008). Finally, air-sea interaction controls the seasonal sea-ice advance and retreat, and inter-annual changes of sea-ice distributions and thickness, and sea-ice export from the Arctic Ocean (Carmack and Chap-man, 2003). In wintertime, the Arctic Ocean is completely covered by sea-ice (except for polynyas and leads) with thick (3–7 m) multi-year ice occupying the interior of the central basin and thinner seasonal sea-ice (1–2 m) across the Arc-tic Ocean shelves and periphery (e.g. significant parts of the Bering Sea shelf; Hudson and Baffin Bays; Greenland, Ice-land and Norwegian Sea) that melts and retreats towards the Pole during the summertime. While the seasonal production and melting of sea-ice contributes significantly to the physi-cal structure and mixing of the Arctic, sea-ice melt and brine rejection during sea-ice formation also modifies the biogeo-chemical properties of surface and halocline layers (Steele and Boyd, 1998; Weingartner et al., 1998; Carmack and Chapman, 2003). The Arctic Ocean sea-ice cover is also particularly sensitive to interannual changes and variability of atmosphere-ocean-sea-ice forcing and feedbacks associ-ated with climate variability such as the Arctic Oscillation (AO) and Arctic Sea-Ice Oscillation (ASIO) (e.g. Rigor et al., 2002; Overland and Wang, 2005; Wang et al., 2005).
3 Considerations about sampling, carbonate chemistry,
air-sea CO2 exchange calculations and continental
shelf CO2sink-sources issues.
3.1 Marine inorganic carbon cycle sampling in the
Arc-tic Ocean
Compared to many other open-ocean and coastal environ-ments, relatively few studies of the marine inorganic car-bon cycle and air-sea CO2 exchange rates have been
con-ducted in the Arctic. The harsh polar climate and difficult logistical support have limited most studies to opportunis-tic icebreaker surveys conducted on the Arcopportunis-tic shelves dur-ing the summertime sea-ice retreat with a couple of transpo-lar surveys across the deep basin (e.g. Arctic Ocean Section; Tucker and Cate, 1996; Anderson et al., 1998a; Jutterstrom and Anderson, 2005; Jones et al., 2008; Tanhua et al., 2009; Carbon in the North Atlantic (CARINA) datasets at http: //cdiac.ornal.gov/oceans/CARINA/CARINA table.html). It is important to note that spring and summer observations of the Arctic inorganic carbon cycle are highly limited and vir-tually absent during winter sea-ice cover. The absence of long-term ocean time-series (e.g. Winn et al., 1994; Bates, 2007; Santana-Casiano et al., 2007), repeat hydrographic surveys (e.g. Sabine et al., 2004; Feely et al., 2004) and underway shipboard surface observations (Takahashi et al.,
2002; 2009) that have benefited understanding of seasonal and interannual change in other ocean basins and coastal ocean environments has considerably constrained our knowl-edge of the marine carbon cycle, and CO2 sink and source
terms in the Arctic Ocean.
3.2 Inorganic carbon chemistry considerations
Studies of the marine inorganic carbon cycle in the Arctic Ocean have focused on measurements of one or more of the four directly observable inorganic carbon system parameters, that is either dissolved inorganic carbon (DIC), total alkalin-ity (TA), partial pressure of CO2(pCO2), or pH (Dickson
et al., 2007). Early historical data of TA and pH were col-lected in the Arctic Ocean (Yamamoto-Kawai et al., 2005) but have relatively limited use today due to inherent uncer-tainties associated with the analytical techniques used. More recently, improvement of analytical techniques, the advent of standardized methods (DOE, 1994; Dickson et al., 2007) and use of seawater standards and calibration have allowed pre-cise and accurate data to be collected in the Arctic Ocean, and subsequently used for assessments of stocks, distribu-tions and transformadistribu-tions of the marine inorganic carbon cy-cle.
Seawater inorganic carbon chemistry is governed by a se-ries of reactions, such that:
CO2(atmos)CO2(aq)+H2OH2CO3 (R1) H++HCO−3 2H++CO23−
For example, DIC is defined as (DOE, 1994; Dickson et al., 2007):
DIC= [CO2∗] + [HCO−3] + [CO23−] (R2)
where [CO2*] represents the concentration of all unionized
carbon dioxide, present either as H2CO3or as CO2. The TA
of seawater is defined as:
TA= [HCO−3] +2[CO32−] + [B(OH)−4] + [OH−]+ (R3) [HPO24−] +2[PO34−] + [SiO(OH)−3] + [HS−] + [NH3] −[H+] − [HSO−4] − [HF] − [H3PO4] −minor species
where [HCO−3] + 2[CO23−]+ B(OH)−4 are the primary compo-nents of seawater TA. Other species have minor contribution to TA. DIC and TA are expressed asµmoles kg−1.pCO2or
fugacity of CO2(fCO2) is expressed asµatm, while pH is
negative log of [H+] generally expressed on the total seawa-ter pH scale (please refer to Zeebe and Wolf-Gladrow (2001) and Dickson et al. (2007) for further information about the inorganic carbon system).
The complete seawater inorganic carbon system (i.e. [CO2*], [HCO−3], [CO
2−
3 ], [H
+] and CaCO
saturation states, ) can be calculated from a combination of any two measured parameters (i.e. DIC, TA,pCO2 and
pH). In this paper, we used the thermodynamic model of Zeebe and Wolf-Gladrow (2001), temperature and salinity data, the CO2 solubility equations of Weiss (1974), and
dissociation constants for carbonic acid (i.e. pK1 and pK2)
of Mehrbach et al. (1973; as refit by Dickson and Millero, 1997), borate (Dickson, 1990) and phosphate (DOE, 1994). It should be noted that the experimental determinations of carbonic acid dissociation constants (i.e. Mehrbach et al., 1973; Goyet and Poisson, 1989; Roy et al., 1993) have lower limits of−1◦C or 0◦C, and that the equations governing pK1
and pK2have to be linearly extrapolated for seawater with
temperatures less than −0◦C. The difference in calculated seawater pCO2 for different pK1 and pK2 determinations
is relatively small (<5µatm) at temperatures less than 0◦C (Bates, 2006). The equations governing pK1 and pK2 are
also a function of salinity. On the Arctic shelves, salinity can be less than 10-15 in surface waters (upper few metres) locally influenced by sea-ice melt (e.g. Bates et al., 2009; Yamamoto-Kawai et al., 2009; Chierici and Fransson, 2009; Fransson et al., 2009) which can add, for example, uncertainty of ∼10µatm and ∼0.1 in the calculation of seawaterpCO2and, respectively,
CaCO3mineral production and dissolution is governed by
the following chemical reaction:
CaCO3= [Ca2+][CO23−] (R4)
The CaCO3mineral saturation state ()is defined as the
ion product of carbonate and calcium concentrations, thus: aragonite= [Ca2+][CO23−]/K
∗
sp (R5)
The experimental solubility product (i.e. Ksp∗) of Mucci (1983) was used here. In general, CaCO3production
and dissolution rates vary as a function of saturation state for aragonite (aragonite) or calcite (calcite). For example,
dis-solution is generally favored whenvalues are lower than 1, while aragonite formation generally occurs at values greater than 1.
3.3 Air-sea CO2exchange rate considerations
Different approaches have been used to estimate rates of air-sea CO2 exchange for the Arctic shelves or entire Arctic
Ocean. These approaches include: (1) differences in atmo-spheric and seawaterpCO2(either by direct measurements
ofpCO2or calculated from other carbonate parameters) that
gives1pCO2or air-sea CO2disequilibrium and, direction of
air-sea CO2gas exchange (e.g. Olsen et al., 2003; Omar et
al., 2007; Bates et al., 2006; Fransson et al., 2009); (2) car-bon mass balance assessments (e.g. Anderson et al., 1998a; Fransson et al., 2001; Kaltin and Anderson, 2005; Macdon-ald et al., 2009); and (3) direct measurements of air-sea CO2
exchange through eddy correlation techniques (Semiletov et al., 2007).
In the first approach,1pCO2data combined with
knowl-edge of gas transfer velocities commonly parameterized as a function of contemporaneous windspeed data (e.g. Wan-ninkhof, 1992; Wanninkhof and McGillis, 1999) provide es-timates of air-sea CO2exchange rates. The direction of
air-sea gas exchange is controlled by 1pCO2 with the
mag-nitude dictated by gas transfer velocities. If surface water pCO2 values are undersaturated with respect to the
atmo-sphere, 1pCO2 values are negative and the ocean has the
potential to uptake CO2(i.e. sink of CO2). If1pCO2values
are positive (i.e. oversaturated) the ocean has the potential to release CO2to the atmosphere (i.e. source of CO2).
In the second approach, air-sea CO2 exchange rates can
be calculated by mass balance assessment of carbon stocks and inputs/outputs of carbon (both inorganic and organic), or temporal/depth changes of DIC that account for temperature and salinity variability and such processes as phytoplankton PP and respiration, vertical entrainment/detrainment and ver-tical diffusion. Both approaches have considerable uncer-tainties with caveats and assumptions used in the approaches. The third approach, using eddy correlation techniques, has only been used once in the Arctic Ocean (Semiletov et al., 2007). This method provides instantaneous fluxes and often yields different results to the other bulk methods. The results of these different approaches are discussed in more detail in Sect. 4 for individual shelves and the central basin of the Arc-tic Ocean.
3.4 Continental shelf net metabolism and CO2
sink-sources issues
The CO2 source or sink status and net metabolism of the
coastal ocean have been highly debated over the last few decades. In early papers, it was first suggested that conti-nental shelves sequestered significant amounts of CO2 and
that the global coastal ocean was net autotrophic (i.e. net consumption of CO2) and a significant sink for
atmo-spheric CO2(Walsh et al., 1985; Walsh, 1991). Smith and
Hollibaugh (1993) subsequently argued that the nearshore coastal ocean was net heterotrophic (i.e. net production of CO2) and offshore coastal ocean neutral, and thus
continen-tal shelves were potential sources of CO2to the atmosphere.
Other studies have since suggested that the CO2source or
sink status (Cai and Dai, 2004; Borges, 2005; Borges et al., 2005; Cai et al., 2006; Chen and Borges, 2009), and the metabolic status of continental shelves (i.e. net autotrophy versus net heterotrophy) is highly variable in time and space (e.g. Wollast, 1998; Gattuso et al., 1998).
of OM from the shelf and, the net air-sea exchange of CO2.
The balance of these processes dictates the metabolic sta-tus (i.e. net autotrophic or heterotrophic), but can also influ-ence the potential CO2sink or source status of the continental
shelf in question. The spatial and temporal variability of sea-waterpCO2on continental shelves is acted upon by a
com-plex interplay of connected and quasi-independent physical and biological factors. For example, the physicochemical process of air-sea CO2exchange can proceed independently
of the biological processes (e.g. production versus consump-tion of OM) that dictate the metabolism of the coastal ocean. The variability of pCO2 or 1pCO2 and separation of
bio-logical and physical processes can lead, for example, to a net heterotrophic continental shelf still being a sink for atmo-spheric CO2(Ducklow and McAllister; 2005). Ducklow and
McAllister (2005) suggested that the global coastal ocean was net autotrophic, and thus a potential sink for atmospheric CO2.
Recent syntheses of coastal carbon cycle studies by Chen and Borges (2009) suggest that in general high-latitude and temperate continental shelf seas tend to be net annual sinks of atmospheric CO2, while upwelling dominated, and
sub-tropical to sub-tropical coastal environments tend to release CO2
to the atmosphere (Cai and Dai, 2004). In addition, local-ized shallow areas influenced by rivers tend to be sources of CO2to the atmosphere, while the deeper, more expansive
ar-eas of the continental shelves tend to be oceanic sinks for atmospheric CO2(Cai et al., 2006; Chen and Borges, 2009).
In summary, Chen and Borges (2009) suggest that the polar continental shelves, for example, are likely to be potential sinks for atmospheric CO2. However, this potential is also
influenced by seasonal sea-ice cover, which acts as a barrier to air-sea CO2gas exchange compared to open water
condi-tions (Bates, 2006).
3.5 Carbon pools, fluxes and physical/biological
pro-cesses in the Arctic Ocean
There are multiple influences on the marine carbon cycle and air-sea exchange of CO2in the Arctic Ocean. The inorganic
carbon cycle is dominated by inter-ocean exchanges between the Pacific and Atlantic Oceans (Macdonald et al., 2009) and subsequent biogeochemical modifications and transfor-mations of water while resident in the Arctic Ocean dur-ing transit between these oceans. In addition, river inputs of freshwater and materials, sea-ice production and melting, and atmosphere-ocean interaction and exchanges also have profound influence.
The upper waters of the Arctic Ocean contain approxi-mately 25 Pg (1015g) of inorganic carbon (i.e. in the form of [HCO−3], [CO23−] and [CO2*]; Reactions R1 and R2) and ∼2 Pg of organic carbon (in the form of living organisms, de-tritus, and other materials). The fluxes of carbon in and out of the Arctic Ocean are dominated by seawater exchanges with other oceans (Figs. 2 and 3; process 1). Seawater inflow of
Pacific Ocean water through Bering Strait into the Chukchi Sea and Atlantic Ocean water into the Barents Sea supplies a combined inflow of∼3 Pg per year of inorganic carbon into the Arctic Ocean with a similar outflow of carbon from the Arctic through Fram Strait. As shown later in Sect. 4, ocean-atmosphere CO2exchanges constitute at present a net
air-to-sea flux of∼66 to 199 Tg C yr−1(1012g) (Figs. 2 and 3; pro-cess 2). River inputs and coastal erosion constitute a net land to ocean inorganic and organic carbon flux of∼12 Tg yr−1 (Macdonald et al., 2009; Fig. 3; process 3).
Factors influencing inorganic carbon cycling within the Arctic Ocean include physical and biological processes (see Figs. 2 and 3). Processes at the air-sea interface include: exposure of surface waters to gas exchange during seasonal sea-ice retreat (process 4); gas exchange in sea-ice melt (pro-cess 5), and river influenced surface waters (pro(pro-cess 6); gas-exchange through sea-ice (process 7); exposure of surface waters to gas exchange in polynyas and leads (process 8), and; carbon export via brine rejection during sea-ice forma-tion (process 9). Sea-ice cover has generally been thought of as a barrier to air-sea CO2 gas exchange compared to
open water conditions (Bates, 2006). Whether sea-ice fa-cilitates the uptake or release of CO2(process 7) is an area
of active research with no definitive answer (Gosink et al., 1978; Semiletov et al., 2004; Delille et al., 2007; Nagurnyi, 2008). Processes within the water column important for car-bon balance and transformations in the mixed layer include: Cooling of waters during transit northward into the Arctic or temperature change within the Arctic Ocean (process 10); across-shelf transport of water and carbon (process 11); ver-tical diffusion, entrainment and detrainment through mixing (process 12), and; shelf-to-basin transport (process 13). Bi-ologically mediated processes include: pelagic phytoplank-ton primary production process 14), and export of organic carbon (process 15) from surface waters to the subsurface. Rates of new and export production have been estimated at ∼135 Tg C yr−1 with large uncertainties (Macdonald et al., 2009). In the subsurface, remineralization of organic matter to CO2in shelf and halocline waters (process 16) and
sedi-ments (process 17) can also contribute. There appears to be an active microbial community in the water-column both in summer and winter that contribute to heterotrophic produc-tion (i.e. remineralizaproduc-tion of OM to CO2; e.g. Alonso-Saez
et al., 2008; Garneau et al., 2008). An additional complica-tion is the recent finding that anaerobic microbial produccomplica-tion of, and subsequent release of alkalinity (process 18) can act to decrease seawaterpCO2, which in turn may enhance the
uptake of atmospheric CO2 onto continental shelves where
Fig. 2. Schematic of processes potentially influencing the inorganic carbon cycle and air-sea CO2gas exchange on “inflow” shelves of the Arctic (e.g. Barents and Chukchi Seas). The two panels represent physical and biological processes likely operating during the summertime sea-ice free period (Panel a), and during the wintertime sea-ice covered period (Panel b). The processes are denoted by numeral with the caveat that the size of arrow does not necessarily reflect magnitude of flux, transport or transformation of CO2. Blue arrows denote processes that likely decrease seawaterpCO2, while red arrows processes that likely increase seawaterpCO2. Black arrows denote processes that do not impactpCO2directly or reflect uncertainty as to whether the process decreases or increases seawaterpCO2. The processes include: 1. northward transport of inorganic carbon; 2. air-sea gas exchange; 4; exposure of surface water to the atmosphere due to sea-ice retreat and melting; 5. localized air-sea gas exchange from surface water highly influenced by sea-ice melt; 7. air-sea gas exchange through sea-ice; 8. winter air-sea gas exchange in leads and polynyas, 9. inorganic carbon flux due to brine-rejection during deep-water formation in fall and winter. 10. cooling of surface waters during northward transport on Atlantic or Pacific Ocean waters into the Arctic Ocean; 11. between shelf transport of water and carbon; 12. redistribution of inorganic carbon between mixed layer and subsurface due to vertical diffusion and vertical entrainment/detrainment due to mixing; 13. shelf-basin exchanges of inorganic carbon (i.e. DIC) and organic carbon due to generalized circulation and eddy mediated transport; 14. net uptake of CO2due to phytoplankton photosynthesis or new production; 15. export flux of organic matter (OM) or export production; 16. remineralization of organic matter back to CO2either in subsurface waters or in sediments; 17. release of CO2from sediments, and; 18. release of alkalinity from sediments due to anaerobic processes in sediments.
4 Present state of knowledge about the marine
inor-ganic carbon cycle and air-sea CO2exchange rates of
the Arctic Ocean
4.1 Arctic Ocean shelves: inflow shelves
4.1.1 Barents Sea shelf
The Barents Sea comprises a broad and shallow continen-tal shelf that is dominated by inflowing Atlantic Ocean wa-ter with minimal freshwawa-ter inputs (Fig. 1). In the Barents
Fig. 3. Schematic of processes potentially influencing the inorganic carbon cycle and air-sea CO2gas exchange on “interior” shelves of the Arctic (e.g. Beaufort and Siberian shelf Seas such as the Kara, Laptev and East Siberian Sea). The two panels represent processes likely operating during the summertime sea-ice free period (Panel a), and during the wintertime sea-ice covered period (Panel b). The processes are denoted by numeral with the caveat that the size of arrow does not necessarily reflect magnitude of flux, transport or transformation of CO2. Blue arrows denote processes that likely decrease seawaterpCO2, while red arrows processes that likely increase seawaterpCO2. Black arrows denote processes that do not impactpCO2directly or reflect uncertainty as to whether the process decreases or increases seawaterpCO2. The processes include those described for Figure 2 but also include the following: 3. river input of organic carbon and DIC. This can also include inputs of carbon from coastal erosion of sediments, for example, and; 6. efflux of CO2from river dominated surface waters. Process 10 includes warming of surface waters during sea-ice free period from solar input or lateral transport of warmer waters from upstream “inflow shelf”.
al., 2007) thereby contributing to the physical and chemical properties of the Eurasian Basin halocline and deeper waters (Jones and Anderson, 1986).
In the earliest study of the inorganic carbon cycle in the Arctic Ocean, Kelley (1970) directly observed undersatu-rated seawaterpCO2 across the Barents Sea with 1pCO2
values ranging from ∼−50 to −150µatm. More recently, other studies have shown seawaterpCO2 values of∼220–
350µatm with a seasonal minimum occurring during the summertime (May to October) (Omar et al., 2003; Nakaoka et al., 2006; Omar et al., 2007). Given that the1pCO2
val-ues ranged from∼−20 to−110µatm, the Barents Sea has a strong potential for significant uptake of CO2from the
atmo-sphere.
Nakaoka et al. (2006) and Omar et al. (2007) estimated an annual ocean CO2 uptake of 46±18 g C m−2yr−1 and
51±8 g C m−2yr−1, respectively, in the Barents Sea
(Ta-ble 1), accounting for sea-ice cover during the wintertime. Using mass balance approaches, and accounting for the fluence of phytoplankton primary production, freshwater in-puts and mixing on vertical profiles of DIC and inorganic nutrients, Fransson et al. (2001) computed an annual ocean CO2uptake of 44±10 g C m−2yr−1. Kaltin et al. (2002),
us-ing similar mass balance approaches applied to inorganic car-bon data collected from a section across the Barents Sea esti-mated an ocean CO2uptake of 29+11 g C m−2for 3 months
Table 1. Areas, depths, residence times, air-sea CO2exchange rates expressed in mmoles C m−2d−1and g C m−2d−1, and annual air-sea CO2exchange rate expressed in Tg C (1012g C). Negative air-sea CO2exchange rates indicates ocean uptake of CO2(i.e., CO2sink).
Areaa(km2) Deptha(m) Residencea(years) Air-Sea CO2flux Air-Sea CO2flux AnnualfCO2flux Reference
(mmoles (g C m−2d−1) (g C m−2yr−1) (Tg C yr−1)) C m−2d−1
Barents Sea 1 512 000 200 1b n/a −46±18 −70±27 Nakaoka et al. (2006) n/a −51±8 −77±12 Omar et al.2007 n/a −44±10 −67±15 Fransson et al. (2001)g n/a −29±11 −44±16 Kaltin et al. (2002)g Kara Sea 926 000 131 2.5 n/a −1 −1.0 Fransson et al. (2001)g
n/a n/a −5.7 Anderson et al. (1998a, b)g
Laptev Sea 498 000 48 3.5±2 −2.1 −2.4 −1.2 Nitishinsky et al. (2007)g n/a n/a −4.3 Anderson et al. (1998a, b)g East Siberian 987 000 58 3.5±2 −1 to−10.9 n/a −1.2/−13 Semiletov et al. (2007)
Sea +0.3 n/a +0.3 Nitishinsky et al. (2007)g
n/a n/a −5.9 Anderson et al. (1998a, b)g
Chukchi Sea 620 000 80 0.2–1.2 −12 −17d −11 Murata and Takizawa (2003) −40±22 −48±10d −36±6 Bates et al. (2006) n/a −61±10e −46±6 Bates et al. (2006)
n/a −86±22 −53±14 Kaltin and Anderson (2001)g Beaufort Sea 178 000 124 0.5–1.0 n/a n/a −2.9 Anderson et al. (1998a, b)g
−12 −17d −2 Murata and Takizawa (2003) Canadian
1 490 000 290 0.5–12 ? ? −16/−24 scaled to Beaufort
Archipelago Sea shelf
Central basin 4 489 000 2748 2–30c <−1 to−3 −4 to−12 −6 to−19 Bates et al. (2006)
Arctic Ocean 10 700 000 −65 low estimate from above
−175 high estimate from above −81 low estimate from abovek −199 high estimate from abovek
Arctic Ocean −129±65 Anderson et al. (1990)g
(other studies) −70±65 Anderson et al. (1994)g
−110 Lundberg and Haugen (1996)g,h −24±17 Anderson et al. (1998b)g
−41±18 Anderson et al. (1998b)g,j −31 Kaltin and Anderson (2005)g −66 Bates (2006)
Notes:aMacdonald et al. (2009) estimates of shelf areas, mean depth (m) and residence times;bKaltin et al. (2002) estimate of Barents Sea shelf water residence time;cresidence time of surface and halocline waters (upper 0–300 m only) from Macdonald et al. (2009);dsummertime open water only (∼100 d);eincluding wintertime air-sea CO2exchange;fannual flux estimated from annual uptake (g C yr−1) multiplied by area of Arctic shelf from Macdonald et al. (2009);gmass balance assessment;hincludes Norwegian Sea (Lundberg and Haugen, 1996);jincludes river contribution (Anderson et al., 1998b), and;kincludes air-sea CO2exchange rates for the Canadian Archipelago scaled to estimates of the Beaufort Sea shelf.
underwaypCO2data, with the oceanic CO2sink decreasing
in a general trend across the Barents Sea from the Atlantic Ocean inflow to the Kara Sea. Similar spatial trends were also observed by Kelley (1970), with 1pCO2 values
gen-erally increasing from∼-50µatm close to the coastline to approximately−150µatm at the outer extent of the Barents Sea shelf.
The seasonal changes in surfacepCO2and air-sea CO2
ex-change rates for the Barents Sea have been largely attributed to seasonal changes in phytoplankton primary production, warming and cooling, and air-sea CO2fluxes. In a general
sense, cooling of surface waters during transit from the At-lantic Ocean to the Barents Sea throughout the year acts to decrease seawaterpCO2at a thermodynamic rate of∼4.1%
per ◦C (Takahashi et al., 1993; Millero, 1995). However, during the sea-ice free summertime, surface seawaterpCO2
decreases by∼100µatm despite significant seasonal
warm-ing of the surface layer (∼4–6◦C) and ocean uptake of CO
2
through enhanced rates of air-sea CO2exchange. As Kaltin
et al. (2002) and Omar et al. (2007) suggest, these processes are more than compensated for by summertime photosyn-thetic uptake of CO2by phytoplankton PP (or new
produc-tion) in the euphotic zone that acts to decrease seawater DIC andpCO2. Indeed, the annual rate of net PP for the Barents
Sea ranges from∼<40–70 g C m−2yr−1(Kaltin et al., 2002; Sakshaug, 2004; Macdonald et al., 2009), with rates of phy-toplankton PP greater than other Arctic Ocean shelves with the exception of the Chukchi Sea.
The seasonal fall and winter rebound of seawaterpCO2
to values just below equilibrium with the atmosphere ob-served by Nakaoka et al. (2006) likely results from a con-tinued uptake of CO2through gas exchange during sea-ice
subsurface waters. Despite the absence of supporting data, it is likely that subsurfacepCO2increases seasonally from
fall and winter from the seasonal remineralization of organic matter, produced during earlier summertime enhanced rates of phytoplankton primary production, as observed in other Arctic Ocean marine environments (e.g. Yager et al., 1995; Bates et al., 2009).
4.1.2 Chukchi Sea shelf
The wide and shallow Chukchi Sea shelf, with the shelf break extending hundreds of kilometers northward from the coast, represents a particularly extensive portion of the Arc-tic shelf system (Fig. 1). The Bering Strait acts as the gate-way for Pacific Ocean waters to enter the Arctic Ocean via the Chukchi Sea (Coachman et al., 1975; Bjork, 1989). The mean annual inflow of Pacific Ocean water at Bering Strait is∼0.8 Sv, with higher transport during the open-water sea-ice free season (Roach et al., 1975; Woodgate et al., 2005a, b; Woodgate and Aagaard, 2005), with minor inputs to the Chukchi Sea from the East Siberian Sea shelf via the inter-mittent Siberian Coastal Current through Long Strait (Wein-gartner et al., 1999). In general, there is a northward trans-port of water across the shallow Chukchi Sea shelf, with four major outflows (∼0.1–0.3 Sv each; Woodgate et al., 2005a) from the Chukchi Sea into the Canada Basin and Beaufort Sea shelf through Long Strait, Central Channel, Herald Val-ley and Barrow Canyon (Paquette and Bourke, 1974; Wein-gartner et al., 1998, 2005; Woodgate et al., 2005b). As with other Arctic Ocean shelves, physical transformations and seasonal sea-ice cover play a major role in shaping the Chukchi Sea shelf water-masses and ecosystem. During the sea-ice covered season, watermasses on the Chukchi Sea shelf are confined to a small range of temperature-salinity space due to vertical homogenization by ventilation, brine rejection and convective mixing (Woodgate et al., 2005a). During the sea-ice free season, local sea-ice melt contributes to Pacific Ocean water to produce a relatively warm, fresher surface mixed layer water (upper 0−∼30 m, salinity typi-cally<31; temperature>−1.5) with denser resident winter water remaining in the subsurface. Inflow of inorganic nu-trient rich Pacific water supports high rates of phytoplankton PP or NCP on the Chukchi Sea shelf compared to other Arc-tic Ocean shelves (>300 g C m2y−1or 0.3–2.8 g C m2d−1;
Hameedi, 1978; Cota et al., 1996; Sambrotto et al., 1993; Hansell et al., 1993; Wheeler et al., 1996; Gosselin et al., 1997; Hill and Cota, 2005; Bates et al., 2005a; Mathis et al., 2009; Macdonald et al., 2009).
In early studies of the Chukchi Sea, Semiletov et al. (1999) observed undersaturated seawaterpCO2 (∼200–350µatm)
during the sea-ice free period across the shelf with lowest values (∼150–200µatm) observed close to the ice edge at the northern shelf break. More recently, other studies have observed similar undersaturated seawater pCO2 conditions
from May to September (∼150–350µatm; Pipko et al., 2002;
Murata and Takizawa, 2003; Bates et al., 2005a, 2006; Bates, 2006; Chen and Gao, 2007; Fransson et al., 2009). Sum-mertime 1pCO2 values are typically in the range of −50
to 200µatm. Extremely low summertimepCO2conditions
(<100µatm) were observed in the surface layer in the vicin-ity of Barrow Canyon at the northern edge of the Chukchi Sea shelf in a location with very high rates of phytoplankton primary production (Bates et al., 2005a; Hill and Cota, 2005) and north of Wrangel Island (Fransson et al., 2009). In the western Chukchi Sea near Long Strait, summertime seawater pCO2conditions are weakly undersaturated (Fransson et al.,
2009) perhaps reflecting outflow of higherpCO2surface
wa-ters from the East Siberian Sea with the intermittent Siberian Coastal Current (Weingartner et al., 1999). Early season ob-servations under near complete sea-ice cover also indicate that Chukchi Sea shelf “winter” surface waters were not as undersaturated with respect to the atmosphere (1pCO2
val-ues of∼−20–60µatm) compared to the summertime sea-ice free period (Bates, 2006). In contrast to strongly undersat-urated surface waters in the Chukchi Sea, subsurface wa-ters seawater pCO2 values were highly oversaturated with
respect to the atmosphere (Bates, 2006; Bates et al., 2009). Estimates of the rates of air-sea CO2 exchange during
the sea-ice free period in the summertime have ranged from ∼20–90 mmoles CO2m−2d−1 (Wang et al., 2003; Murata
and Takizawa, 2003; Bates, 2006; Fransson et al., 2009) with the Chukchi Sea shelf a strong sink of CO2. These
studies indicate that the ocean uptake of CO2 from the
at-mosphere is greater for the Chukchi Sea shelf than other Arctic Ocean shelves. However, in regions of the Chukchi Sea shelf where sea-ice cover remained high (>80%) dur-ing the summertime, air-sea CO2exchange rates were
esti-mated to be generally low (<1 mmoles CO2m−2d−1; Bates,
2006). Similarly, wintertime air-sea CO2 exchange rates
during complete sea-ice cover were estimated to be minor (<1 mmoles CO2m−2d−1; Bates, 2006). The annual ocean
CO2uptake for the Chukchi Sea shelf has been estimated at
24–108 g C m−2yr−1 (Table 1; Bates, 2006). Similarly, us-ing mass balance approaches, Kaltin and Anderson (2005) estimated that the annual ocean CO2uptake for the Chukchi
Sea to be 86±22 g C m−2yr−1.
The seasonal changes in surfacepCO2and strong sink for
atmospheric CO2on the Chukchi Sea shelf have been largely
attributed to cooling of surface waters during the northward transit of waters across the Chukchi Sea shelf (Murata and Takizawa, 2003) and high rates of summertime phytoplank-ton PP that acts to decrease seawater DIC andpCO2(Bates,
2006). As in the Barents Sea, the fall and winter rebound of seawaterpCO2to values just below equilibrium with the
atmosphere likely results from a continued uptake of CO2
4.2 Arctic Ocean shelves: interior shelves
4.2.1 Siberian Sea shelves (i.e. Kara, Laptev and East
Siberian Seas)
The Kara Sea shelf is controlled by exchanges with the Bar-ents Sea and adjoining Eurasian Basin (Fig. 1). Freshwater runoff from the Ob and Yenisey Rivers mix with more saline water of Atlantic Ocean origin, before entering the Laptev Sea or exported into the central basin of the Arctic Ocean (e.g. Anderson et al., 1994; Jones et al., 1991; Fransson et al., 2001). There is a general flow from the Laptev Sea across the East Siberian Sea and into the Chukchi Sea through the Siberian Coastal current (e.g. Weingartner et al., 1999; Ni-tishinsky et al., 2008), but circulation patterns can reverse with considerable transport from the East Siberian Sea shelf across the northeastern Laptev Sea shelf (e.g. Dmitrenko et al., 2008). Major freshwater inputs to the Laptev Sea oc-cur primarily through the Lena River (e.g. Gordeev et al., 1996; Olsson and Anderson, 1997). On all of these shelves, seasonal sea-ice melt and formation, and brine rejection in coastal polynyas are important processes (e.g. Dmitrenko et al., 2008) with sea-ice production in this region occurring at the highest rate compared to other Arctic Ocean shelves.
There have been few studies of inorganic carbon on the Siberian Sea shelves, with surface seawaterpCO2 and
1pCO2 values highly variable over time and space.
Dur-ing the sea-ice free period, surface waters of the Kara Sea appear to be undersaturated with respect to the atmosphere. Semiletov et al. (1999) report a range of 273–405µatm for surface seawaterpCO2while Kelley (1970) reported1pCO2
values ranging from−30 to−100µatm across much of the Kara Sea in 1967. In contrast, supersaturated surface seawa-terpCO2were observed nearshore and close to the outflow
of the Ob and Yenisey Rivers (Kelley, 1970; Makkaveev, 1994; Semiletov et al., 1999). In the other Siberian Sea shelves, generally undersaturated surface seawater pCO2
(216−∼400µatm) for the Laptev Sea and highly variable seawaterpCO2conditions in the East Siberian Sea (∼300–
500µatm) have been reported (Semiletov et al. 1999, 2007). High values for surface seawater pCO2 were
ob-served nearshore on the shelf within the river plume of the Lena River (∼850µatm) that drains into the Laptev Sea, and the Kolyma River (∼500µatm) that drains into the East Siberian Sea shelf (Semiletov et al., 1999, 2007). In addition, very high values (∼500 to +1500µatm) have been observed in bottom waters of the inner shelf and also in the nearshore bays (e.g. Tiksi Bay) and estuaries of the Laptev and East Siberian Seas (Semiletov et al. 1999, 2007).
Fransson et al. (2001), using carbon mass balance ap-proaches, computed a small annual ocean CO2 uptake of
1 g C m−2yr−1 for the Kara Sea (Table 1). For the Laptev Sea, mass balance assessments integrated across the shelf indicate that this sea is a sink for atmospheric CO2
dur-ing the sea-ice free summertime (∼2.1 mmoles C m−2d−1;
July–September; Nitishinsky et al., 2008) despite supersat-urated seawater pCO2 conditions (i.e. sources of CO2 to
the atmosphere) in nearshore bays (Olsson and Anderson, 1997) and Lena River outflow (Semiletov et al., 1999, 2007). Direct eddy correlation measurements of air-sea CO2
ex-change in late summer (September) close to the multiyear sea-ice at the shelf break of the Laptev Sea yielded more contradictory results with air-sea CO2exchange rates
vary-ing from invasion of 1.7 mmoles C m−2d−1 to evasion of 1.2 mmoles C m−2d−1 (Semiletov et al., 2007). If we ex-trapolate the results of Nitishinsky et al. (2008) and assume a 100 d sea-ice free period, and negligible air-sea gas exchange during wintertime sea-ice cover, an annual ocean CO2
up-take of∼2.4 g C m−2yr−1 is computed (Table 1). For the East Siberian Sea shelf, the sink or source terms are un-certain. Nitishinsky et al. (2008) estimated that the East Siberian Sea shelf is a small source of CO2 to the
atmo-sphere (∼0.3 mmoles C d−1m−2). However, Semiletov et
al. (2007) suggest that the western area of the shelf is a source of CO2to the atmosphere (1±1.6 mmoles C d−1m−2, 2003;
and 10.9±12.6 mmoles C m−2d−1, 2004) while the eastern area, influenced by mixing with Pacific Ocean water from the Chukchi Sea shelf, is a sink for atmospheric CO2.
The above studies suggest that the Siberian Sea shelves range from minor sinks to minor sources of CO2 to the
at-mosphere, with the causes uncertain at present. Nitishin-sky et al. (2008) suggest that the drawdown ofpCO2from
summertime photosynthetic uptake more than compensates for seasonal warming, and mixing with river freshwater and high-CO2subsurface waters, all of which act to increase
sea-waterpCO2. Semiletov et al. (2007) showed highly
super-saturated values for subsurface waters on all of the Siberian Sea shelves, presumably resulting from remineralization of organic matter introduced from the Siberian Rivers (e.g. An-derson et al., 1990; Cauwet and Sidorov, 1996; Kattner et al., 1999) and from vertical export of organic carbon de-spite relatively low rates of summertime phytoplankton pri-mary production (compared to other Arctic Ocean shelves) in the euphotic zone (∼6–12 g C m−2 yr−1; Macdonald et al., 2009). The East Siberian Sea shelf may be more highly influenced by these processes and hence more likely to be net heterotrophic and a source of CO2 to the atmosphere.
The Laptev Sea also has a permanent flaw lead polynya (Dmitrenko et al., 2005; Nitishinsky et al., 2008) that may contribute to ocean CO2uptake from the atmosphere during
wintertime brine rejection and sea-ice formation as shown elsewhere (Anderson et al., 2004; Omar et al., 2005), but also winter outgassing of CO2from the polynya.
4.2.2 Beaufort Sea shelf
influenced by outflow from the Mackenzie River, and this in-put of freshwater and terrigenous inin-put dominates the phys-ical and chemphys-ical properties of the Beaufort Sea shelf (Car-mack and Macdonald, 2002; Macdonald et al., 2009). Com-pared to the adjacent Chukchi Sea shelf, annual rates of phytoplankton PP for the Beaufort Sea shelf were relatively low (∼7–17 g C m−2yr−1; Macdonald et al., 2009), similar to other “interior” type shelves (Carmack and Wassmann, 2006) such as the Siberian Sea shelves. In the adjoining Canada Basin, wind-driven, clockwise rotation of the Beau-fort Gyre controls regional scale sea-ice and upper ocean cir-culation (Carmack and Chapman, 2003). Along the north-ern edge of the Chukchi and Beaufort Seas, a narrow east-ward boundary current is present (Nikolopoulos et al., 2009) which is constrained to follow the isobaths along the shelf break due to strong dynamic controls (Winsor and Chapman, 2004; Spall, 2007). The generalized regional water circula-tion along the Beaufort Sea shelf is directed eastward with shelf waters renewed principally by Pacific Ocean waters that enter through Bering Strait and exit the Chukchi Sea off the Alaskan coast. Shelf-basin exchange facilitated by the generation of mesoscale eddies (e.g. Manley and Hunkins, 1985; Muench et al., 2000; Pickart et al., 2005; Mathis et al., 2007a), and winter brine rejection during sea-ice formation are also important for these shelves.
As with the Siberian Sea shelves, few studies have been conducted on the Beaufort Sea shelf. SeawaterpCO2
con-ditions appear to be highly variable (∼150–350µatm) in the western part of the Beaufort Sea shelf (Murata and Takizawa, 2003; Bates, 2006). Extremely low seawaterpCO2
condi-tions (<100µatm) have also been observed in the surface layer of the Beaufort Sea shelf east of Point Barrow in a re-gion of characterized by high proportions of freshwater (10– 20%) and sea-ice melt (10–25%) (Cooper et al., 2005; Bates, 2006). Murata and Takizawa (2003) have estimated that rate of ocean CO2 uptake was relatively low (−12 mmoles
CO2m−2d−1) during the summertime compared to the
adja-cent Chukchi Sea. In areas of the western Beaufort Sea shelf where sea-ice cover remained high (>80%), air-to-sea CO2
fluxes were generally low (<1–10 mmoles CO2m−2d−1;
Bates, 2006; Fransson et al., 2009). In the eastern Beau-fort Sea shelf, summertime surface seawater pCO2 values
were generally weakly undersaturated (Mucci et al., 2008) or close to equilibrium with the atmosphere particularly in the Banks Island polynya (Fransson et al., 2009). Fransson et al. (2009) estimated that the summertime ocean CO2
up-take was∼6 mmoles CO2m−2d−1for the eastern Beaufort
Sea shelf. The annual ocean CO2 uptake for the Beaufort
Sea shelf has been estimated at 1.2 g C m−2yr−1, low com-pared to other Arctic Ocean shelves (Table 1; Murata and Takizawa, 2003).
4.3 Arctic Ocean shelves: outflow shelves
4.3.1 Canadian Archipelago shelf
The shelf of the Canadian Archipelago, east of the Beaufort Sea shelf (Fig. 1), has been poorly sampled for marine in-organic carbon cycle properties. There is little information to estimate rates of air-sea CO2 gas exchange and the
pro-cesses that control the inorganic carbon cycle. In the adjacent Hudson Bay, Else et al. (2008) observed mean rates of air-sea CO2exchange of 0.7 mmoles CO2m−2d−1directed
to-wards the ocean during the sea-ice free period. On an annual timescale, a small ocean CO2 uptake for the Hudson Bay
shelf is estimated at 0.07 g C m−2yr−1(Else et al., 2008). In the CARINA dataset (Fig. 4), computation ofpCO2
from DIC and alkalinity datasets indicate that surface pCO2 values ranged from ∼300–400µatm on the
Cana-dian Archipelago shelf and generally undersaturated with re-spect to the atmosphere. During the CASES project in the early 2000’s, surface pCO2 values in the eastern Beaufort
Sea shelf ranged from∼300–430µatm with significant spa-tial variability (Mucci et al., 2008). More recently, Frans-son et al. (2009) observed summertime surfacepCO2
val-ues of∼150–300µatm in the Canadian Archipelago shelf. Surface waters were strongly undersaturated (1pCO2
val-ues of−100 to−200µatm) and a very strong ocean sink of 140 mmoles m−2d−1was shown for Lancaster Sound in par-ticular (Fransson et al., 2009). If we conservatively assume that air-sea CO2exchange rates are similar for the Canadian
Archipelago as the “upstream” Beaufort Sea shelf, the annual ocean uptake of CO2for the Canadian Archipelago shelf is
computed at 16 to 24 g C m−2yr−1(Table 1).
4.4 Arctic Ocean central basin: Canada and Eurasian
Basins
Fig. 4. Surface seawaterpCO2 values computed from DIC and TA data collected in the Arctic Ocean and part of the CARINA dataset (data obtained at http://cdiac.ornl.gov/. The following cruise data were used to generate the surface pCO2 map. The metadata is given as CDIAC cruise number, Cruise Name, CA-RINA Table ID, ship, cruise dates, Chief Scientist (in brackets) and scientist responsible for inorganic carbon measurements. 3, 06AQ19960712, 3, Polarstern, 7/12–9/6/1996 (E. Augstein), L. An-derson; 17, 06MT19970707, 18, Meteor, 7/7–8/9/1997 (F. Schott), A. Koertzinger/L. Mintrop; 37, 18HU19970509, 44, Hudson, 5/9– 6/11/1997 (R. A. Clarke), P. Jones/R. Gershey; 38, 18SN19940724, 47, St.Laurent, 7/24–9/1/1994 (K. Aagaard/E. Carmack/J. Swift); P. Jones/K. Azetsu-Scott; 39, 18SN19970803, 48, St. Laurent, 8/3-8/18/1997 (F. McLaughlin/K. Falkner), P. Jones/K. Azetsu-Scott; 40, 18SN19970831, 49, St. Laurent, 8/31–9/16/1997 (F. McLaugh-lin/K. Falkner), P. Jones/K. Azetsu-Scott; 41, 18SN19970924, 50, St. Laurent, 9/24-10/15/1997 (F. McLaughlin/K. Falkner), P. Jones/K. Azetsu-Scott; 108, 58AA20000923, 124, H. Mosby, 9/23–10/03/2000 (S. Osterhus) A. Omar; 128, 58JM20030710, 145, Jan Mayen, 7/10–7/18/2003 (P. Wassmann), R. Bellerby/C. Kivi-mae; 129, 58JM20040724, 146, Jan Mayen, 7/24–7/31/2004 (P. Wassmann), R. Bellerby/C. Kivimae; 130, 58JM20050520, 147, Jan Mayen, 5/20-6/2/2005 (P. Wassmann), R. Bellerby/C. Kivi-mae; 131, 58LA19860719, 148, Lance, 7/19-7/26/1986 (chief sci-entist not listed), L. Anderson; 160, 77DN19910726, 177, Oden, 7/26–9/3/1991 (L. Anderson/J.-E. Hellsvik), L. Anderson; 162, 77DN20020420, 179, Oden, 4/20–6/6/2002, L. Anderson; L. An-derson; 164, 90AQ19940706, 181, A. Fedorov, 7/5–8/8/1994 (chief scientist not listed), L. Anderson.
1999; Rudels et al., 1996; Guay and Falkner, 1997; Jones et al., 2003). In surface waters of the Canada Basin, the river fraction can be up to 20% (Macdonald et al., 2002; Cooper et al., 2005), while localized to the upper few me-tres, the sea-ice melt fraction can also exceed 25% (Cooper et al., 2005) during the summertime retreat of sea-ice. In the Eurasian Basin, surface waters and halocline waters are pre-dominantly of Atlantic Ocean origin that have been modified on the Barents Sea and Siberian Seas shelves adjacent to the
Eurasian Basin (Anderson et al., 1994). The upper halocline layer is absent from most of the Eurasian Basin (Anderson et al., 1994a). At greater depths of the central basin is the At-lantic Water Layer (AWL;∼200–800 m deep) and the Arctic Ocean Deep Water (AODW), both of which have Atlantic Ocean origins (e.g. Jones et al., 1991, 1995).
The central basin of the Arctic has been poorly sampled for marine inorganic carbon cycle properties. The Arctic Ocean Section (AOS) expedition in 1994 sampled across the Eurasian Basin and Canada Basin, west of the Chukchi Cap (Anderson et al., 1998a). Calculation of pCO2 from
AOS DIC and TA data (obtained at http://cdiac.ornal.gov/ oceans/CARINA/) indicate that the surface waters had sea-waterpCO2 values of∼300–330µatm and1pCO2 values
of ∼−40−70µatm, and hence undersaturated with respect to the atmosphere. In the Canada Basin, adjacent to the Chukchi Sea shelf, lower seawaterpCO2 values of ∼240–
280µatm and1pCO2values of∼−150+25µatm have also
been observed (Bates, 2006; Bates et al., 2006). More re-cently, in the Makarov Basin of the Canada Basin, low sur-face seawaterpCO2values of∼150–250µatm and1pCO2
values of∼−100 to 200µatm have been observed under sea-ice (Fransson et al., 2009). These observations suggest that the central basin of the Arctic Ocean has the potential to absorb significant amounts of CO2 (Anderson and Kaltin,
2001; Bates et al., 2006). The capacity for sea-ice to al-low direct gas exchange has been debated (e.g. Gosink et al., 1976; Semiletov et al., 2004; Delille et al., 2007; Nagurnyi, 2008), and here, we assume that sea-ice is an effective bar-rier to gas exchange. Wintertime area of open water in leads and polynyas has been estimated at 1% in the central basin (Gow and Tucker, 1990). In regions of the Canada Basin with 100% sea-ice cover, Bates et al. (2006) used an effec-tive sea-ice cover of 99% to compute air-sea CO2influx of
<3 mmoles CO2m−2d−1to account for exchange through
leads, polynyas, fractures and brine channels (i.e. 1% area of the central basin), with much higher rates of exchange in areas without complete sea-ice cover.
4.5 Arctic Ocean (shelves and central basin): estimating
annual air-sea CO2exchange rates and the Arctic
Ocean CO2sink
Early carbon mass balance estimates of the rate of air-sea CO2 exchange suggested that the entire Arctic Ocean was
a sink for CO2 in the range of 70 to 129 Tg C year−1
(Ta-ble 1: Anderson et al., 1990, 1994; Lundberg and Haugen, 1996). Subsequently, Anderson et al. (1998b) and Kaltin and Anderson (2005) used similar carbon mass balance ap-proaches but revised their estimates of the Arctic Ocean CO2
sink downward to 24 and 31 Tg C year−1. More recently, di-rect1pCO2observations and air-sea CO2exchange rate
es-timates revised the Chukchi Sea shelf CO2sink upward and
the Arctic Ocean CO2sink was estimated at 66 Tg C year−1
data suggests that the Arctic Ocean CO2 sink ranges from
approximately 66 to 175 Tg C yr−1 depending on lowest to
highest flux rates estimates from available studies (Table 1). In light of recent observations in the Canadian Archipelago shelf (Fransson et al., 2009), the addition of a Canadian Archipelago shelf ocean CO2 sink would increase the
Arc-tic Ocean CO2 sink to 81 to 199 Tg C yr−1 (Table 1). In
comparison to the mean annual global ocean CO2uptake of
approximately 1400 Tg C yr−1(Takahashi et al., 2009), the Arctic Ocean CO2 sink potentially contributes∼5–14% to
the global balance of CO2sinks and sources.
4.5.1 The present day annual Arctic Ocean CO2 sink:
caveats and considerations
Our review of published results from both carbon mass balance and observational studies indicates that the Arctic Ocean is a CO2sink of approximately 66 to 199 Tg C yr−1,
at present. However, it is important to note that these esti-mates are based on very limited spring and summer data, and near absence of wintertime data.
On the Arctic Ocean shelves, there is a potential for win-tertime outgassing of CO2. For example, in the nearshore
regions of the shelves, surface summer 1pCO2 values are
near neutral (near the Mackenzie River outflow and Banks Island polynya; Fransson et al., 2009) or positive (highly positive in places like Tiksi Bay and in the river outflows onto the Siberian and Beaufort shelves; e.g. Semiletov, 1999; Semiletov et al., 2007). There are also indications that the highly river-dominated surface waters on the Laptev and East Siberian Sea shelves have positive1pCO2values (inferred
from the very lowvalues for river end-members shown by Salisbury et al., 2008). Winter mixing with CO2 rich
sub-surface waters are highly likely to create conditions favoring the potential for surface waters to outgas CO2during winter
through polynyas and leads. In the Laptev Sea, for exam-ple, the wintertime flaw-lead polynya occurs over the outer shelf at a distance of∼50–150 km from the nearshore areas with positive summertime1pCO2values (Dmitrenko et al.,
2005). However, the prevalent offshelf circulation pathways on the Laptev Sea are likely to transport positive1pCO2
sur-face waters to the region of the law-lead polynya. In total, the area of polynyas and flaw-leads on the Arctic shelves has been reported at 3.5×10¹⁰m2(e.g. Winsor and Bjork, 2000). Assuming a 100 d period for gas exchange from polynyas and leads, gas exchange rates of 10 mmoles CO2m−2d−1
would result in an efflux of 0.4 Tg C. Compared to influxes in the Chukchi and Barents Seas,1pCO2values would have
to be in the order of +150µatm for an efflux of 0.4 Tg, and +1500µatm, for a wintertime polynya/lead efflux of 4 Tg.
A counterbalance to wintertime outgassing from polynyas and leads, may be wintertime net influx of carbon due to brine rejection during deep water formation (Anderson et al., 2004; Omar et al., 2005). Omar et al. (2005), scaling results from Storfjorden, Svalbard, reported a wintertime influx of
2.3, 6.8 and 33 Tg C for coastal shelf ploynyas, central basin polynyas, and brine-rejection during ice formation in the sea-sonally sea-ice free areas of the Arctic, respectively. The caveat for this study is that the results were extrapolated from Storfjorden to the entire Arctic Ocean.
Under-sea ice observations across the central basin (An-derson et al., 1994b; Jutterstrom and An(An-derson, 2005; Tan-hua et al., 2009; Fransson et al., 2009) indicate that1pCO2
values are negative with the potential to absorb CO2
(al-though blocked by sea-ice). Given the 2–12 year residence times of surface waters in the central basin, we expect that the under-ice trans-Arctic sections are likely to reflect wintertime conditions as well. In addition, the Revelle factors (Sabine et al., 2004) and pre-conditions of Atlantic and Pacific surface waters entering the Arctic and cooling during transit into the Arctic are likely to favor negative1pCO2values and thereby
the potential for Arctic Ocean surface waters to absorb CO2.
5 Feedbacks and vulnerabilities
The Arctic Ocean is currently in the forefront of climate change caused by both natural and anthropogenic factors that influence the cryosphere, hydrological and biogeochemical cycles of the Arctic. However, due to undersampling of the Arctic Ocean, many uncertainties remain about the marine carbon cycle and, as shown earlier in this review, the uptake of CO2and the physical and biological processes that control
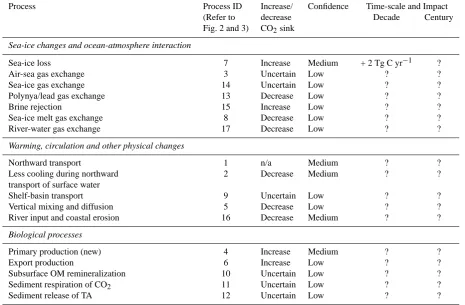
the inorganic carbon cycle on the shelves and in the central basin. It is thus difficult to quantitatively predict changes in processes and feedbacks in the Arctic Ocean. However, here we discuss the potential vulnerabilities of the inorganic car-bon cycle due to natural and anthropogenic factors, includ-ing: (1) sea-ice loss; (2) warming, circulation and other phys-ical changes; (3) changes in biology and ecosystem structure of the surface and halocline water, and; (4) changes in the hydrological cycle and freshwater inputs to the Arctic Ocean. We use Figs. 2 and 3 as a framework for this discussion and Table 2 provides likely impact of process, confidence level and potential time-scale of impact.
5.1 Sea-ice loss
Table 2. Summary of physical and biological processes that can influence the inorganic carbon cycle and increase/decrease the Arctic CO2 sink. The numeral identification of each process is taken from Figs. 2 and 3. Confidence level is also given, as well as time-scale (over the next decade or century) and impact (if quantified).
Process Process ID Increase/ Confidence Time-scale and Impact
(Refer to decrease Decade Century
Fig. 2 and 3) CO2sink
Sea-ice changes and ocean-atmosphere interaction
Sea-ice loss 7 Increase Medium + 2 Tg C yr−1 ?
Air-sea gas exchange 3 Uncertain Low ? ?
Sea-ice gas exchange 14 Uncertain Low ? ?
Polynya/lead gas exchange 13 Decrease Low ? ?
Brine rejection 15 Increase Low ? ?
Sea-ice melt gas exchange 8 Decrease Low ? ?
River-water gas exchange 17 Decrease Low ? ?
Warming, circulation and other physical changes
Northward transport 1 n/a Medium ? ?
Less cooling during northward 2 Decrease Medium ? ?
transport of surface water
Shelf-basin transport 9 Uncertain Low ? ?
Vertical mixing and diffusion 5 Decrease Low ? ?
River input and coastal erosion 16 Decrease Medium ? ?
Biological processes
Primary production (new) 4 Increase Medium ? ?
Export production 6 Increase Low ? ?
Subsurface OM remineralization 10 Uncertain Low ? ?
Sediment respiration of CO2 11 Uncertain Low ? ?
Sediment release of TA 12 Uncertain Low ? ?
2007; Shimada et al., 2006). The length of the seasonal sea-ice free period has increased (e.g. Smith 1998; Rigor et al., 2002; Rigor and Wallace, 2004; Arrigo et al., 2008; Comiso et al., 2008), and sea-ice thickness observed over the central Arctic Ocean has decreased as thick multi-year sea-ice is replaced by thinner first-year sea-sea-ice (e.g. Rothrock et al., 2003; Giles et al., 2008). The decline in Arctic sea-ice cover has been attributed to a combination of factors, includ-ing: (1) increased Arctic temperatures (Rothrock and Zhang 2005: Lindsay and Zhang 2005); (2) increased advection of warmer water into the Arctic Ocean from the Atlantic Ocean through the Fram Strait and Barents Sea gateways (Steele and Boyd 1998; Dickson et al., 2000) and from the Pacific Ocean through Bering Strait (Maslowski et al., 2001: Shi-mada et al., 2006), and; (3) increased advection of sea-ice out of the Arctic Ocean through Fram Strait due to recent changes in atmospheric circulation patterns (Rigor and Wal-lace, 2004; Maslanik et al., 2007: Serreze et al., 2007). In combination, these factors contribute to a positive feedback where sea-ice loss reinforces surface warming due to reduced surface albedo and increased shortwave penetration, which in turn inhibits sea-ice formation in wintertime and allows for
acceleration of sea-ice loss during the summertime (Perovich et al., 2007).
5.1.1 Sea-ice loss and exposure of surface waters
The loss of ice is expected to both reduce the % sea-ice cover and expose undersaturated surface waters of the Arctic shelves and central basin (i.e. Canada and Eurasian Basins) (Figs. 2 and 3, process 4). Prior to 2007, the rate of sea-ice loss from the central Arctic Ocean was estimated at ∼36 000 km2yr−1 (Cavalieri et al., 2003). In surface waters of the Canada Basin, a mean ocean CO2 uptake of
46±8 mmoles CO2m2d−1 was observed in 2002 and 2004
in sea-ice free areas during summertime. These air-sea CO2
exchange rates were scaled to the entire central basin and an-nual reduction of sea-ice extent to estimate an increase of the ocean CO2sink of 2.0±0.3 Tg C year−1due to sea-ice loss
waters to air-sea gas exchange. Assuming a status quo of in-organic carbon distributions in surface waters of the Arctic, this recent loss of summertime sea-ice may have increased the ocean uptake of CO2 in the Arctic Ocean by an
addi-tional 33±10 Tg C year−1. If sea-ice cover was lost com-pletely over the central basin during summertime, surface waters of the Arctic Ocean might absorb an additional∼280 to 1200 Tg of CO2 (Anderson and Kaltin, 2001; Bates et
al., 2006). The range of estimates depends on differences in surface water carbonate chemistry observed between the Canada Basin and Eurasian Basin. For example, Anderson and Kaltin (2001) computed how much CO2was needed to
equilibrate the surface mixed layer with the atmosphere us-ing vertical profiles of DIC data from the Eurasian Basin.
The above estimates of CO2uptake changes due to sea-ice
loss have many uncertainties and associated caveats. These studies are only applicable to the near-term future (<decade) since it was assumed that the driving force of gas exchange (e.g.1pCO2and DIC distributions of surface and
underly-ing halocline layer waters) would not change significantly over the residence time of surface waters in the Arctic Ocean (e.g. 2–30 years; Macdonald et al., 2009). However, in the era of rapid change in the Arctic, inorganic carbon distri-butions and air-sea CO2exchange rates are highly likely to
change due to a host of other factors. Since the effect of these other factors on the marine inorganic carbon cycle can be opposing or amplifying in nature, future predictions of the trajectory of the Arctic Ocean CO2sink/source terms are
difficult to make.
5.1.2 Other sea-ice and gas exchange issues
The loss of sea-ice in the Arctic Ocean should result in greater open water area, and increased air-sea interaction, with a variety of consequences. At the same time, increased latitudinal atmospheric pressure gradients could result in in-creased windspeed and storm events over the Arctic. Al-though the direction of air-sea gas exchange is forced by 1pCO2values, the rate of gas exchange of CO2(Figs. 2 and
3, process 2) and other gases is primarily driven by wind-speed and atmospheric boundary layer-surface water inter-actions. Given these dictates, even though1pCO2 values
might reduce, air-sea CO2gas exchange rates can increase
since gas transfer velocities increase exponentially relative to windspeed (Wanninkhof, 1992; Wanninkhof and McGillis, 1999) and CO2 flux in other regions can be dominated by
storms and high-wind events (Bates and Merlivat, 2001). Wintertime sea-ice has thinned over the last few decades and there may be potentially greater air-sea gas exchange through sea-ice (Gosink et al., 1978; Semiletov et al., 2004; Delille et al., 2007) with sea-ice a potentially weaker barrier to gas exchange (Figs. 2 and 3, process 7). Sea-ice can both release and absorb CO2(Delille et al., 2007) depending on
changes in the net metabolism of the sea-ice biological com-munity, and the net impact on air-sea CO2exchange is
uncer-tain. Brine rejection during sea ice formation (Figs. 2 and 3, process 9) is thought to transfer carbon from sea-ice to deep water (Anderson et al., 2004; Rysgaard et al., 2007) with es-timates of its impact in the Arctic Ocean at∼43 Tg C yr−1 (Omar et al., 2005). Calcium carbonate minerals such as Ikaite also form in sea-ice (Dieckmann et al., 2008) indica-tive of highand lowpCO2. However, localized surface
water with high percentages of sea-ice melt or river freshwa-ter have been observed with lowvalues (Yamamoto-Kawai et al., 2009; Chierici and Fransson, 2009; Bates et al., 2009) and highpCO2(Figs. 2 and 3, process 5 and 6), suggesting
that these summertime surface areas could outgass CO2.
In wintertime, wind-driven polynyas open up on the Chukchi and Laptev Sea shelves in particular (Cavalieri and Martin, 1994; Dmitrenko et al., 2005; Nitishinsky et al., 2007), resulting in the formation of dense water via brine-driven convection (Weingartner et al. 1998). Since brine rejection and formation of dense water appears to facilitate uptake of CO2from the atmosphere (Anderson et al., 2004;
Omar et al., 2005), enhanced opening of polynyas and leads may increase the sink of CO2in the Arctic Ocean in the
near-future depending on inorganic carbon distributions and near-future air-sea CO2disequilibrium. In counterbalance, polynyas and
leads may outgass CO2in shelf areas with positive1pCO2
values, especially in the Siberian shelves (Sect. 4.2; Figs. 2 and 3, process 8).
The cumulative effect of the above processes (i.e. 5–9) on the balance of CO2sinks and sources in the Arctic Ocean is
highly uncertain and in the absence of definitive data their impact in the near-term has to be considered minor at present (Table 2).
5.2 Warming, circulation and other physical changes in
the Arctic
In the recent past (1998–2006), Pabi et al. (2008) observed positive anomalies in surface temperatures of up to 2◦C in the regions of significant sea-ice loss (mainly on the “inflow” Arctic shelves). This suggests that the cooling of surface waters during transit northward into the Arctic has reduced (Figs. 2 and 3, process 10), and that summertime surface wa-ters have become warmer over the last few decades (ACIA, 2005). Due to simple thermodynamics, cooling/warming should decrease/increase seawaterpCO2at a rate of∼4.1%
per ◦C (Takahashi et al., 1993; Millero, 1995). In inflow shelf and central basin surface waters, if we assume present day surface waterpCO2 values of 250µatm, a 1◦C
warm-ing (or 1◦C less cooling!) should increase seawaterpCO
2by ∼8–12µatm per 1◦C and reduce1pCO2values and rates of
ocean CO2 uptake by∼10%. If surface waters equilibrate
with the predicted 4–5◦C warming of the atmosphere over the Arctic by the end of the 21st century (ACIA 2005), and if present-day inorganic carbon distributions in the upper lay-ers of the Arctic remain unchanged, the Arctic Ocean CO2