Self versus Assessor Ratings and their
Classifi cation in Assessment Centres:
Profi ling the Self-Rater
Duncan J. R. Jackson & Jennifer A. Stillman
Massey University
Sarah Burke & Paul Englert
OPRA Consulting GroupSelf versus assessor behavioural ratings from 214 participants were investigated along with psychometric measures in a development centre. Using cluster analysis, it was shown that sub-groups of self-raters could be established without the need to use commonly criticized difference scores. Four clusters of self-rater were identifi ed in this analysis, a result that builds on popular theory (Atwater & Yammarino, 1992). Self-ratings by cluster were plotted with psychometric measures and assessor ratings. Those who self-rated higher tended to score relatively high on personality constructs related to social dominance. However, sub-clusters of self-rater were neither differentiated by cognitive ability scores nor by assessor ratings. Strength of difference between self and assessor ratings was contingent on cluster membership. Cluster analysis is suggested as a useful technique for understanding self-rater behaviour and as a guide to identifying how feedback should be tailored to potential recipients.
T
he subject of self-ratings in assessment centres (ACs) has been of growing interest since Heneman (1980) suggested that ACs are ideal settings for their study. Particularly with regard to developmental assessment centres (i.e., development centres, DCs), self-ratings present an issue of importance to both participants and assessors. Halman and Fletcher (2000) emphasized that participants in development centres require feedback for the developmental event to operate effectively. This feedback is generally intended to increase a participant’s awareness of performance-related competencies and later job performance (Van Velsor, Taylor, & Leslie, 1993).Several theoretical arguments have been presented with respect to self-ratings. Notably, impression management may affect and inflate self-ratings, particularly in selection scenarios (Fahr & Werbel, 1986).
However, even data from a DC, where impression management concerns might be less salient, tended to show an infl ated bias in post-assessment self-ratings (Halman & Fletcher, 2000). Perhaps, then, infl ated self-ratings tend to refl ect a self-serving bias, as described in social psychology, whereby protection of self-esteem is sought.
Randall, Ferguson, and Patterson (2000) point out that the infl uence of impression management in self-ratings lead them to be unreliable as selection measures. However, it is possible that certain personality attributes could also contribute to patterns in self-perceptions of performance (Church, 1997; Fletcher, Taylor, & Glanfield, 1996). Islam and Zyphur (2005) found that individuals with a higher social dominance orientation tended to voice their opinions more openly in group situations, like those often presented in ACs.
A body of literature to date has focused on self versus assessor discrepancies on performance dimensions. Schmitt, Ford, and Stults (1986) studied eight performance dimensions prior and subsequent to the assessment event. They found small correlations between performance on each dimension and assessor judgments (< .20). Similar results were reported by Clapham (1998), who also investigated the moderating effects of cognitive abilities and gender. Again, and even with external variables controlled, small correlations were observed (< .33). Note, however, that an earlier study by Byham (1971) found higher correlations between assessor and post AC participant performance (around .60).
within a narrow corridor around some mean value. Typically, it would seem, these self-rated mean values are higher than those of assessors.
From an alternative perspective, it may be the studies of correlations and mean comparisons between overall self-ratings, assessor ratings, and psychological variables hide important patterns due to corridor effects. As such, classifying sub-groups of self-raters in a meaningful way could assist in revealing complex patterns that might otherwise remain latent (Halman & Fletcher, 2000). In acknowledgement of these range restriction issues, Atwater and Yammarino (1992) suggested categorization as a means of circumventing reliability problems associated with self minus other difference scores (see Johns, 1981). Atwater and Yammarino described over-estimators as those with an infl ated view of their performance, those who are in agreement as holding accurate schema agreement as holding accurate schema agreement
with regard to their performance, and under-estimators as those who attenuate their self-ratings. Difference scores were, however, used in the categorization of individuals into these three sub-groups. While difference scores were not used in statistical analyses, it seems less than satisfactory to use an unreliable strategy to categorize individuals. However, this approach has been employed in studies of self versus other ratings in ACs (e.g., Halman & Fletcher, 2000; Randall, et al., 2000). Cluster analysis is a technique, not known to have been previously used in this domain, which allows sub-clusters of individuals to be identifi ed in a reliable manner (see Hair, Anderson, Tatham, & Black, 1998).
Two points are of note here. Firstly, studies of self versus assessor ratings on task-specifi c assessment centres would add to the literature by presenting an alternative view of the data. One such study was identifi ed and is discussed below. Secondly, given the exercise effects often observed in ACs, it seems implicit that assessors often perceive participant performance to be specifi c to an exercise or task-specifi c (see Lowry, 1997). Likewise, the question arises as to whether participants also perceive their performance as being task-specifi c. This issue is of importance, particularly with regard to DC performance on
which feedback is a fundamental component of the process. Providing an appropriate and cognitively intuitive context for this feedback may facilitate the delivery of performance information to participants. Clapham (1998) found that in an AC containing 16 dimensions, both participants and assessors rated dimensions according to an underlying structure that suggested three principal components. It was unclear in Clapham whether these patterns were indicative of exercise effects. However, one could conclude that a small number of components were found relative to desired dimensions. Further insight into the factor patterns observed in self-ratings would inform on how participants perceive their AC experience.
A single study was found comparing self versus assessor ratings in a task-specifi c AC (Franks, Ferguson, Rolls, & Henderson, 1998). Franks, et al. used difference scores to analyze their data. Thus, while circumventing some of the construct validity issues associated with ACs, other analytical issues were evident. Reliability issues aside, Franks, et al. (1998) found that difference scores were statistically signifi cant in terms of their capacity to distinguish successful versus unsuccessful AC candidates. However, raw self-assessment scores were non-signifi cant predictors. As with other studies incorporating dimension-specific ACs, Franks, et al. found a general over-estimation in performance across exercises in nine out of ten indexes reported for successful and non-successful candidates across fi ve exercises.
Primary Research Objective and Additional Hypotheses
Feedback is seen as a major part of the success of DCs. This study sought to investigate factors that might infl uence participant perceptions of their own performance and therefore their potential reactions to feedback on assessor ratings. The typology approach for self-assessments presented by Atwater and Yammarino (1992) holds theoretical merit and potential application in development centre contexts. However, this typology is based on scores that may yield unreliable groupings. Cluster analysis presents a data-driven technique that could be used to classify self-raters. Once clusters of self-raters are identifi ed,
they could be profi led in terms of their associated assessor ratings, scores on external measures related to dominance, and their cognitive abilities. This leads to the primary objective of this study in terms of investigating whether a typology of self-raters based on cluster analysis will yield profi les that inform on the classification presented by Atwater and Yammarino (1992).
The research presented above suggests that social dominance plays a role in the way behaviour is expressed in group situations (Islam & Zyphur, 2005). Social dominance may also play a role in terms of an individual’s self-perceptions of performance on group exercises. Moreover, while cognitive abilities have been researched in terms of their general moderating effects (Clapham, 1998), those who are more cognitively able may also hold a heightened awareness of their own abilities relative to the views of assessors. Investigation into these potential patterns presents a secondary aim for this paper, leading to the following hypotheses:
Hypothesis 1: Those who rate themselves incongruently high, relative to assessors, on their assessment centre performance will also score higher on dominance-oriented dimensions.
Hypothesis 2: Participants who score higher on cognitive abilities are more likely to self-rate in a manner that is congruent with assessor ratings.
Method
Participants
A total of 229 managers from a major postal organisation participated in a DC aimed at developing a number of managerial competencies. Of the total number of participants, 214 were retained as usable for data analysis, the remainder being too incomplete for inclusion. The mean age of the participants was 45.53 (SD = 10.33) and a relatively even split between genders was observed (males, around 54% and females, around 46%). Around 78% of the sample were Caucasian and just over half of the participants had completed high school (around 53%) or had a trade certifi cate or degree (around 25%). Assessors
consultants. The panel comprised 23 assessors, who independently completed a 10-item behavioural checklist (see below) for each exercise. Assessors were trained using a frame-of-reference procedure (see Schleicher, Day, Mayes, & Riggio, 2002 for details on this approach), which involved mock administrations of exercises and reporting and discussing ratings that were given. This approach is often presented as a form of standard setting and is recommended for use with ACs (Lievens, 1998).
Measures
Competency/Job Analysis. The DC under scrutiny was developed using the course of action set out by Lowry (1997). This process began by using a competency model that had been specifi ed for the company under study. This model was based on the Lominger competency framework (see Lombardo & Eichinger, 2002; 2003). Using this framework as an initial guide, subject matter expert interviews were carried out incorporating the views of human resource managers, area managers, and line managers. The aim was to identify tasks and psychological variables that were relevant to the job.
Assessment Exercises. Four exercises were developed in total and are described below. Each exercise contained a 10-item behavioural checklist, each of which held acceptable internal consistency (see Nunnally & Bernstein, 1994) as indicated by Cronbach’s alpha (alpha for exercise 1 = .92; 2 = .92; 3 = .93; and 4 = .94).
Exercise 1: Managing new staff. The fi rst component of this exercise involved a discussion in small groups around the issue of managing new front-line staff members. The second component of the exercise involved an individual presentation back to the assessors on the important factors to consider when managing new staff in the focal organisation.
Exercise 2: Selecting new staff. The format of this exercise was similar to that above and included a discussion and individual presentation. The focus here, however, was on the factors that the participants would consider important for the selection of new staff specializing in insurance and lending.
Exercise 3: Photo exercise. The photo exercise was a group discussion in which a series of photos were shown to participants displaying the interior and exterior of postal outlet stores. Access problems and issues around aesthetics were purposely staged in the photos to provide material for debate.
Exercise 4: Coaching exercise. The coaching exercise was a role play in which candidates were requested to plan a performance coaching meeting with an employee. Participants were then asked to role play a coaching session in which performance plans for the next six months were agreed. Self-Ratings. After each exercise, participants were given a three-item self-rating measure including the items “how satisfi ed were you with your performance on this exercise”, “how satisfied do you think other members of the group were with your performance on this exercise”, and “how satisfi ed do you think the observers were with your performance on this exercise”. These items were scored on a scale ranging from 1 (certainly dissatisfi ed) to 6 (certainly satisfi ed). Ratings were purposely given only after a given exercise to allow the participant’s perspective on their performance specifi c to an exercise, rather than general self-perceptions of performance. The self-rating scales in this study held acceptable reliability within exercises (Cronbach’s alpha for self-ratings on exercise 1 = .91; 2 = .87; 3 = .84; and 4 = .94). Note that the intention in this study was to cluster participants in terms of their perceptions of behavioural performance on the exercises described above. Cognitive Abilities. The Graduate Reasoning Test battery (GRT1) published by Psytech International Limited was used to assess verbal, numerical, and abstract reasoning in the DC. Reliability for these tests was deemed acceptable from studies that appear in the technical manual for the test battery (Psytech International, 1991) (test re-test reliability coeffi cients were at .79, .78, and .74 respectively). The information presented in Psytech (1991) also provided evidence of the construct and predictive validity of these measures. Note that, due to practical considerations, it was not
possible to determine sample-specifi c test-retest reliability.
Personality Measures. Subscales from the 15FQ+ personality questionnaire (see the technical manual from Psytech International, 2002 for information on validity) were used to assess aspects theoretically related to dominance in group situations. Three scales were used in total, namely socially bold, intellectance, and dominant, all of which are described in the manual as holding acceptable reliability (Cronbach’s alpha > .70). Alphas specifi c to this study were as follows: Socially bold = .72; intellectance = .70; and dominant = .68. The latter coeffi cient possibly refl ects the broad nature of the construct in its coverage of assertive, competitive, aggressive, and forceful tendencies. Socially bold individuals are described as being confident in social settings. Intellectance relates to the confi dence one has in their intellectual abilities. The technical manual states that such individuals may be “quick to take advantage of situations in which they can display their knowledge and intellectual prowess” (p. 13). Dominant individuals are described as being determined to get their own way, as being inclined to take control of situations, and being forceful in dealings with others.
Results
Overall Data Structure
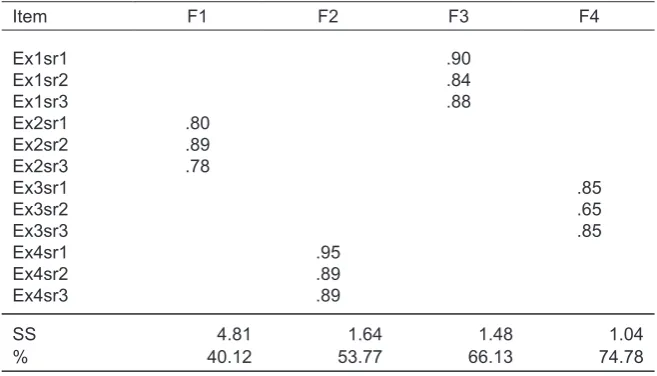
clearly interpretable as representing task-specifi c judgments. The overall fi t for the model was reasonable, with four factors explaining nearly 75% of the variation in self-rating items. Assessor ratings were also factor analyzed and displayed, as expected, ratings that loaded clearly within exercises. This fi nding has been reported elsewhere on different samples (e.g., Jackson, et al., 2005) and is, therefore, not focused on here.
To back up the findings of the EFA on self-ratings, a CFA was run incorporating the model suggested above. Self-rating items were specifi ed as observed variables and latent variables were conceptualized as indicating overall self-rated behavioural performance within exercises. Latent variables were treated as correlated effects. Figure 1 shows the CFA model, factor loadings, and accompanying fi t indices. The overall fi t for this model was found to be acceptable (χ2 =
134.54, dfdfdf = 48, = 48, p < .001; AGFI = .84, TLI = .93, and CFI = .95).
Fundamental to this study is the idea that an overall perspective on self-raters may serve to hide important information. However, for comparative purposes, mean differences and correlations across all participants were computed. Across the entire sample, participants’ self-ratings (M = 4.29, SD = 0.65) tended to be around one scale point higher than their associated assessor ratings (M = 3.26, SD = 0.74). This difference was statistically signifi cant (ttt = 15.38, = 15.38, df = 418, p < .001). The overall correlation between self and assessor ratings was weak (rrr = .18, = .18, p < .01).
Typology by Cluster Analysis A cluster analysis was performed using Ward’s method of clustering to maximize homogeneity within clusters, along with squared Euclidian distance as a measure of cluster difference (see Hair, et al., 1998). Self-ratings only were used to defi ne the cluster solution, as a key aim was to identify sub-groups of self-raters. Agglomeration schedules and a dendrogram were used to guide the selection of identifi able clusters (see Everitt, Landau, & Leese, 2001) and tended to suggest four relatively distinct clusters within the total sample. The agglomeration
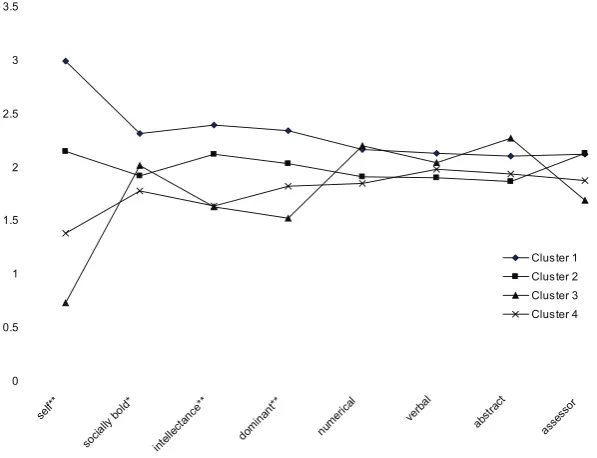
schedule and dendrogram were too large for reproduction in this paper, given the sample size of 214, but are available from the fi rst author upon request. Standardized mean scores across self-raters within each cluster were plotted along with assessor ratings and scores on the personality and cognitive ability dimensions (see Figure 2). These constituted Z scores with a constant of 2 added to avoid negative values and thus ease interpretation (MMM = 2, = 2, SD = 1). Note that the data points in Figure 2 should be interpreted in terms of relative standing on a particular variable, as opposed to absolute values. By way of
[image:4.595.225.554.89.277.2]example, in the pecking order, cluster 3 self-rated lowest in comparison to the other clusters. The general research objective of this study was, thus, supported, as the cluster profi les suggested an extension of Atwater and Yammarino’s (1992) classification, using an empirical technique for developing self-rater profi les. In terms of cluster interpretation, cluster 1 could be thought of as boldboldbold in terms of their in terms of their behavioural performance on exercises, cluster 2 confi dent, cluster 3 retiring, and cluster 4 self-effacing. Note that these categories are intended only as interpretational guides.
Table 1. Exploratory Factor Analysis of Self-Ratings
Item F1 F2 F3 F4
Ex1sr1 .90
Ex1sr2 .84
Ex1sr3 .88
Ex2sr1 .80
Ex2sr2 .89
Ex2sr3 .78
Ex3sr1 .85
Ex3sr2 .65
Ex3sr3 .85
Ex4sr1 .95
Ex4sr2 .89
Ex4sr3 .89
SS 4.81 1.64 1.48 1.04
% 40.12 53.77 66.13 74.78
Principal axis factoring was used with a latent root criterion and direct oblimin rotation. F = factor, Ex = exercise, sr = self-rating item, SS = sums of squared loadings at extraction, % = cumulative percent of variance explained. Loadings < .3 were suppressed to ease interpretation.
Srex1 – srex4 = self ratings on exercises 1 through 4. Sr1i1 – sr4i3 = self rating items for exercises 1 through 3. Goodness-of-fi t indices suggested an acceptable model (GFI = .90, AGFI = .84, PGFI = .56, NFI = .93, TLI = .93, CFI = .95, PRATIO = .73).
[image:4.595.234.549.602.732.2]Statistical differences among clusters were indicated using the Kruskal-Wallis HHH non-parametric test non-parametric test of difference (see Siegel & Castellan, 1988). Signifi cant differences were observed across self-raters (χ2 = 143.27,
df = 3, df = 3,
df p < .001) which was expected, given that the cluster solution was defi ned by this variable. Signifi cant differences were also observed on social boldness (χ2 = 8.68, dfdfdf = 3, = 3, p
< .05), intellectance (χ2 = 20.59, df
= 3, p < .001), and dominance (χ2 =
15.85, dfdfdf = 3, = 3, p < .01). Differences among clusters on assessor ratings and measures of cognitive ability were non-signifi cant. A post-hoc comparison of the social boldness variable indicated that signifi cant differences were only evident between clusters 1 and 4
(using both Dunnette’s T3 and Tukey’s HSD post hoc tests). Note, a standard ANOVA of the data suggested the same conclusions as the non-parametric tests. These results were generally in support of Hypothesis 1, showing that dominance-related personality dimensions distinguished among types of self-rater. However, Hypothesis 2 was unsupported, as cognitive abilities yielded no signifi cant differentiation.
To provide a perspective of the data in absolute terms, mean scores by cluster were provided across self and assessor ratings (see Table 2). Statistical signifi cance was computed, this time, to indicate differences between self and assessor ratings. All mean comparisons were statistically signifi cant, except for cluster 3. Note
that a power analysis using G power (version 2.0) indicated that, given relative sample size by cluster, it was appropriate to use ttt tests but not tests but not correlation coeffi cients in this case. As such, correlations were not computed by cluster. As a further indication of effect size, Wilks’ λ was calculated based on sums of squares from an ANOVA table (see Spicer, 2005). In this case, a larger Wilks’ λ indicates greater congruence between self and assessor ratings.
Discussion
There are several observations that may be gleaned from the results of this study. Notably, cluster analysis is a useful profiling tool that can aid an understanding of self-rater behaviour. Atwater and Yammarino (1992) suggested three main types of self-rater, including those who, in comparison to assessor ratings, overestimate, agree, or underestimate. This system of classification has been used by several researchers, but could be criticized on the basis that it lacks an empirical grounding and, in practice, uses unreliable difference scores to allocate within the typology (see Cronbach & Furby, 1970; Johns, 1981). The use of cluster analysis, on the other hand, provides a data-driven mechanism for identifying a self-rater typology, and the results of this study build on Atwater and Yammarino by suggesting varying degrees of self-rating congruence.
Table 2 shows mean comparisons between self and assessor ratings by the four sub-clusters of self-rater identifi ed in this study. Cluster 1 was clearly the least concordant, and the participants within this cluster rated themselves over 1.5 scale points higher,
0 0.5 1 1.5 2 2.5 3 3.5
self**
socia lly bo
ld*
intell ectan
ce**
domi nant*
*
nume
rical verbal abstr
act asse
ssor
Cluster 1 Cluster 2 Cluster 3 Cluster 4
[image:5.595.39.547.88.171.2]Inter-cluster differences by variable indicated as * = p < .05 and ** = p < .01. Note that lines connecting data-points are to aid interpretation within clusters only, and do not suggest continuous variables.
Figure 2. Standardized scores of self-ratings, personality, cognitive abilities, and assessor ratings by cluster
Table 2. Mean Differences between Self and Assessor Ratings by Cluster
Self Assessor
Cluster # n Mean SD Mean SD Diff t λ
Cluster 1 60 4.93 0.34 3.34 0.77 1.59 14.64** .36
Cluster 2 69 4.39 0.26 3.35 0.68 1.04 11.89** .49
Cluster 3 26 3.47 0.74 3.02 0.82 0.45 2.05 .92
Cluster 4 59 3.90 0.45 3.16 0.74 0.74 6.49** .73
[image:5.595.52.351.523.752.2]on average, than their assessors. Cluster 3 was evidently the most concordant, and yielded a non-signifi cant difference. Between these points were varying degrees of agreement with regard to perceptions of self-performance, and it is these empirically derived sub-clusters that should, according to this study, be scrutinized further. Note that Table 2 suggests the overall correlation between assessor and self-ratings (rrr = .18, = .18, p < .01) may hide important patterns in the data through aggregation.
Following on from the interpretation of the results presented earlier, an understanding of divisions in the perceptions of raters could help in terms of informing those who provide feedback. It is suggested that the framework identifi ed in this organisation might assist assessors in terms of how they tailor the format, tone, expression, and style of such feedback. Further research would be needed to identify the effects of different styles on those who are boldboldbold confident, , , retiring, or self-effacing, and to identify the extent to which this framework generalizes across organisations.
The cluster solution also allows typologies to be meaningfully profi led along with other variables of interest. In this case, and given the suggestions of previous research (e.g., Clapham, 1998; Islam & Zyphur, 2005), DC participants, divided into self-rater clusters, were profi led with scores on personality attributes related to social dominance and cognitive abilities. The personality attributes mentioned appeared to discriminate across those who were in one cluster versus another, however, cognitive abilities showed no such discrimination. Turning to Figure 2, a clear division occurred across self-rating clusters; however, assessor self-ratings did not significantly discriminate in this regard. While, in absolute terms, participants tended to rate themselves higher than assessors (as shown in Table 2), Figure 1 shows that assessors tended not to react to this, and remained relatively homogenous with regard to their ratings across clusters.
With regard to psychological measurements external to the DC behavioural judgments, the highest self-raters in cluster 1 tended to be the most socially bold, the most willing
to display their intellectual prowess (intellectance) and the most dominant. The lowest self-raters tended to score lower on intellectance and dominance. Cognitive abilities did not signifi cantly discriminate across clusters, despite the intellectance scores shown, particularly in cluster 1. One could speculate on the degree to which impression management may play a role in the manifestation of the personality attributes mentioned above (Fahr & Werbel, 1986; Halman & Fletcher, 2000), despite the notion that these ratings were taken from a developmental context. In any case, it would appear that the attempts of the participants in cluster 1 to present themselves in a dominant manner did not result in a statistically signifi cant differentiation on the part of the assessor panel.
Another finding in this study, although less central to the profi ling of self-raters, is the suggestion that participants in a task-specifi c DC rated their performance as being specifi c to exercises. Lance et al. (2004) suggested that empirical study of task-specifi c, as opposed to the traditional dimension-specifi c, ACs is sorely needed as most of the research specifi cally in this area is anecdotal, with a few exceptions (Franks, et al., 1998; Jackson, et al., 2005). While there is evidence that assessors regard task-specifi c AC performance as being situational (see Jackson et al.), this is the fi rst known research to have looked at the perspective of the participants. It would be informative, given the construct validity issues highlighted by Lance et al., to ascertain whether or not participants in a traditional dimension-specifi c AC view their performance as being related to monotrait-heteromethod dimensions.
As suggested by Schmitt, et al. (1986), an indication of pre-assessment self-ratings would be informative. Note, however, that the overall correlations between self and assessor ratings in this study were in line with the fi ndings of other studies that did use pre-assessment. Further, the focus in this study was to provide an uncluttered view of performance specifi c to exercises, in line with a task-specifi c approach. As previously stated, it would also be interesting to repeat this study on the traditional dimension-specific
approach to ACs to ascertain participant perceptions of performance on such measures, and to investigate the effects of using dimensions on sub-clusters of self-raters.
In this study, those who rated their AC performance highly also tended to score higher on variables related to social dominance, but their assessor ratings and cognitive ability scores were not signifi cantly different from other subgroups of self-rater. Providing feedback to such individuals might present a challenging scenario for practitioners. Such a scenario could be compounded by making participants wait for long periods before feedback is provided (Fletcher & Kerslake, 1992). Provision of feedback for those who hold lower self-perceptions of performance would also need to be handled in a particular manner, as such individuals tended to report less dominance in social settings. Future studies could investigate the extent to which different feedback approaches could work with more or less effi cacy, depending on the recipient’s self-rating cluster.
In conclusion, the results of this study suggest that cluster analysis provides an informative technique for profiling self-rater behaviour. The profi les generated in this sample build on the discrete theoretical profile of overestimation, accuracy, and underestimation suggested by Atwater and Yammarino (1992). It appears that varying degrees of concordance may be reflected within self-ratings when compared to those of external assessors. Moreover, this study suggests that personality dimensions related to social dominance may defi ne certain sub-groups of self-raters, particularly those who rate themselves high relative to assessor ratings.
References
Atwater, L. E. & Yammarino, F. J. (1992). Does self-other agreement on leadership perceptions moderate the validity of leadership and performance predictions? Personnel Psychology, 45, 141-164. Byham, W. C. (1971). The assessment center
Church, A. H. (1997). Do you see what I see? An exploration of congruence in ratings from multiple perspectives. Journal of Applied Social Psychology,
27, 983-1020.
Clapham, M. M. (1998). A comparison of assessor and self dimension ratings in an advanced management assessment
centre. Journal of Occupational and
Organizational Psychology, 71, 193-203.
Cronbach, L. J. & Furby, L. (1970). How should we measure change – or should we? Psychological Bulletin, 74, 68-80. Everitt, B. S., Landau, S. & Leese, M.
(2001). Cluster analysis (4th edn.).
London: Oxford University Press. Fahr, J. & Werbel, J. D. (1986). Effects of
purpose of the appraisal and expectancy of validation on self-assessment leniency. Journal of Applied Psychology, 71, 527-529.
Fletcher, C. & Kerslake, C. (1992). The impact of assessment centers and their outcomes
on participants’ self assessments. Human
Relations, 45, 281-289.
Fletcher, C., Taylor, P., & Glanfield, K. (1996). Acceptance of personality questionnaire feedback – The role of individual difference variables and
source of interpretation. Personality and
Individual Differences, 20, 151-156. Franks, D., Ferguson, E., Rolls, S. &
Henderson, F. (1998). Self-assessments in HRM: An example from an assessment
centre. Personnel Review, 28, 124-133.
Hair, J. F., Anderson, R. E., Tatham, R.L., &
Black, W. C. (1998). Multivariate Data
Analysis (5th ed.). New Jersey:
Prentice-Hall International.
Halman, F. & Fletcher, C. (2000). The impact of development centre participation and the role of individual differences in
changing self-assessments. Journal
of Occupational and Organizational Psychology, 73, 423-442.
Heneman, H. (1980). Self-assessments:
A critical view. Personnel Psychology,
33, 297-300.
Islam, G. & Zyphur, M. J. (2005). Power, voice, and hierarchy: Exploring the antecedents of speaking up in groups. Group Dynamics: Theory, Research, and Practice, 9, 93-103.
Jackson, D. J. R., Stillman, J. A., & Atkins, S. G. (2005). Rating tasks versus dimensions in assessment centers: A
psychometric comparison. Human
Performance, 18, 213-241.
Johns, G. (1981). Difference score measures of organizational behavior variables: A
critique. Organizational Behavior and
Human Performance, 27, 443-463.
Lance, C. E., Lambert, T. A., Gewin, A. G., Lievens, F., & Conway, J. M. (2004). Revised estimates of dimension and exercise variance components in assessment center postexercise dimension
ratings. Journal of Applied Psychology,
89, 377-385
Lance, C. E., Noble, C. L., & Scullen, S. E. (2002). A critique of the correlated trait-correlated method and correlated uniqueness models for
multitrait-multimethod data. Psychological
Methods, 7, 228-244.
Lievens, F. (1998). Factors which improve the construct validity of assessment
centers: A review. International Journal
of Selection and Assessment, 6, 141-152.
Lombardo, M. M. & Eichinger, R. W. (2002). The leadership machine (3rdrdrd edn.). edn.).
Mineapolis: Lominger Limited Inc. Lombardo, M. M. & Eichinger, R. W.
(2003). FYI: For your improvementFYI: For your improvementFYI: For your improvement (3 (3rd
edn.). Mineapolis: Lominger Limited Inc.
Lowry, P. E. (1997). The assessment center process: New directions. In R.E. Riggio & B.T. Mayes (Eds.), Assessment centers: Research and applications [Special
issue]. Journal of Social Behavior and
Personality, 12, 53-62.
Maciejczyk, M. (1992). The relationship of self-ratings to assessor ratings of assessment center performance. Dissertation Abstracts International. 52, 4505.
Nunnally, J. C. & Bernstein, I. H. (1994). Psychometric Theory (3rd ed.). New York: McGraw Hill.
Psytech International. (1991). General
critical & graduate test battery: The technical manual. Pulloxhill, Bedforshire: Published Psychometrics Ltd.
Psytech International. (2002). 15FQ+ fi fteen
factor questionnaire technical manual. Pulloxhill, Bedforshire: Published Psychometrics Ltd.
Randall, R., Ferguson, E., & Patterson, F. (2000). Self-assessment accuracy and
assessment centre decisions. Journal
of Occupational and Organizational Psychology, 73, 443-459.
Sackett, P. R. & Dreher, G. F. (1982). Constructs and assessment center dimensions: Some troubling empirical
fi ndings. Journal of Applied Psychology,
67, 401-410.
Schleicher, D. J., Day, D. V., Mayes, B. T. & Riggio, R. E. (2002). A new frame for frame-of reference training: Enhancing the construct validity of assessment
centers. Journal of Applied Psychology,
87, 735-746.
Schmitt, N., Ford, J. K., & Stults, D. M. (1986). Changes in self-perceived ability as a function of performance
in an assessment centre. Journal of
Occupational Psychology, 59, 327-335. Siegel, S. & Castellan, N. J. (1988).
Nonparametric statistics for the behavioral sciences. New York: McGraw-Hill.
Spicer, J. (2005). Making sense of
multivariate data analysis. London: Sage.
Van Velsor, E., Taylor, S. & Leslie, J. B. (1993). An examination of the relationships among self-perception accuracy, self-awareness, gender and
leader effectiveness. Human Resource
Management, 32, 249-263.
Acknowledgements
The authors would like to thank Vikki Andrews, Paul Millin, and Desley Thompson for their assistance. We would also like to acknowledge the late Phillip Lowry for his insights and guidance on the behavioural measures used in this study.
Author Notes Jennifer A. Stillman
School of Psychology, Albany Campus, Massey University Sarah Burke & Paul Englert OPRA Consulting Group, Wellington
Address for correspondence:
Duncan J. R. Jackson
Department of Management & International Business
Massey University Albany Private Bag 102-904 North Shore MSC Auckland, New Zealand Fax: +64 9 441 8109