Paediatric postdischarge mortality in
developing countries: a systematic review
Brooklyn Nemetchek,1 Lacey English,2 Niranjan Kissoon,3,4
John Mark Ansermino,4,5 Peter P Moschovis,6 Jerome Kabakyenga,7
Susan Fowler-Kerry,1 Elias Kumbakumba,8 Matthew O Wiens4,8
To cite: Nemetchek B, English L,
Kissoon N, et al. Paediatric
postdischarge mortality in developing countries: a
systematic review. BMJ Open
2018;8:e023445. doi:10.1136/
bmjopen-2018-023445
►Prepublication history and
additional material for this paper are available online. To view these files, please visit the journal online (http:// dx. doi. org/ 10. 1136/ bmjopen- 2018- 023445).
Received 9 April 2018 Revised 24 July 2018 Accepted 24 September 2018
For numbered affiliations see end of article.
Correspondence to Dr Matthew O Wiens; mowiens@ outlook. com © Author(s) (or their employer(s)) 2018. Re-use permitted under CC BY-NC. No commercial re-use. See rights and permissions. Published by BMJ.
AbstrACt
Objectives To update the current evidence base on paediatric postdischarge mortality (PDM) in developing countries. Secondary objectives included an evaluation of risk factors, timing and location of PDM.
Design Systematic literature review without meta-analysis. Data sources Searches of Medline and EMBASE were conducted from October 2012 to July 2017.
Eligibility criteria Studies were included if they were conducted in developing countries and examined paediatric PDM. 1238 articles were screened, yielding 11 eligible studies. These were added to 13 studies identified in a previous systematic review including studies prior to October 2012. In total, 24 studies were included for analysis. Data extraction and synthesis Two independent reviewers extracted and synthesised data using Microsoft Excel. results Studies were conducted mostly within African countries (19 of 24) and looked at all admissions or specific subsets of admissions. The primary subpopulations included malnutrition, respiratory infections, diarrhoeal diseases, malaria and anaemia. The anaemia and malaria subpopulations had the lowest PDM rates (typically 1%–2%), while those with malnutrition and respiratory infections had the highest (typically 3%–20%). Although there was significant heterogeneity between study populations and follow-up periods, studies consistently found rates of PDM to be similar, or to exceed, in-hospital mortality. Furthermore, over two-thirds of deaths after discharge occurred at home. Highly significant risk factors for PDM across all infectious admissions included HIV status, young age, pneumonia, malnutrition, anthropometric variables, hypoxia, anaemia, leaving hospital against medical advice and previous hospitalisations.
Conclusions Postdischarge mortality rates are often as high as in-hospital mortality, yet remain largely unaddressed. Most children who die following discharge do so at home, suggesting that interventions applied prior to discharge are ideal to addressing this neglected cause of mortality. The development, therefore, of evidence-based, risk-guided, interventions must be a focus to achieve the sustainable development goals.
IntrODuCtIOn
The third of 17 United Nations sustain-able development goals (SDGs) emphasises preventable deaths of newborns and chil-dren under 5 years of age, with all countries aiming to reduce under-5 mortality to at least
as low as 25 deaths per 1000 live births by the year 2030.1 Although significant progress was made during the Millennium Development Goal era (1990–2015), preventable child-hood deaths remain high in Southern Asia and sub-Saharan Africa.2 These deaths result largely from infectious diseases (including malaria, pneumonia, diarrhoea, etc), which lead to sepsis.3 Children are particularly vulnerable in the months following hospital discharge, with a growing body of research demonstrating that postdischarge deaths occur in similar numbers as during hospital admission. Despite the staggering burden of postdischarge mortality, this issue has been largely neglected when examining paedi-atric mortality from infectious disease. The 2017 United Nations World Health Assembly (WHA) resolution calling for improvement in prevention, diagnosis and management of sepsis is timely as it emphasises the need for improved follow-up care, particularly for developing countries, within their recom-mended actions for reducing the burden of sepsis globally.4 Member states are urged to emphasise the impact of sepsis on public health, of which postdischarge mortality is a crucial aspect.2 Thus, as the international community works towards achieving the WHA resolution and the third SDG, addressing the
strengths and limitations of this study
► Extensive literature search of Medline and Embase
with independent screening of all abstracts and eli-gible full-text publications by two investigators.
► Extensive data extraction on risk factors for mortality
within each study population.
► Few studies were prospective and focused on
mea-surement of post-discharge mortality as a primary outcome.
► Heterogeneity in populations, duration of follow-up
and high proportion of loss to follow-up may limit the external validity and underestimate outcome rates.
► No optimal method to assess the risk of bias in
in-cluded studies.
on September 22, 2020 by guest. Protected by copyright.
importance.
A systematic literature review conducted in 2012 exam-ined the burden of paediatric postdischarge mortality in resource-poor countries.5 This systematic review found
that the rate of paediatric postdischarge death is often as high as in-hospital mortality rates, with two-thirds of these deaths occurring outside the health system, usually at home. Common risk factors for postdischarge mortality included young age, malnutrition, HIV, pneumonia and recent prior admissions.
Despite the high burden of postdischarge death, this issue continues to receive insufficient recognition at either national or international levels. The lack of research and data highlighting the burden of postdischarge mortality relegates care following discharge as a low priority to policy makers. Additional studies published since the last systematic review contribute to the growing evidence base that can galvanise both researchers and policy makers to action.
The purpose of this systematic review, therefore, is to update the literature addressing the critical nature of paediatric postdischarge mortality in resource-poor settings, propelling research and interventions towards the goal of reduced child mortality.
Objective and study eligibility criteria
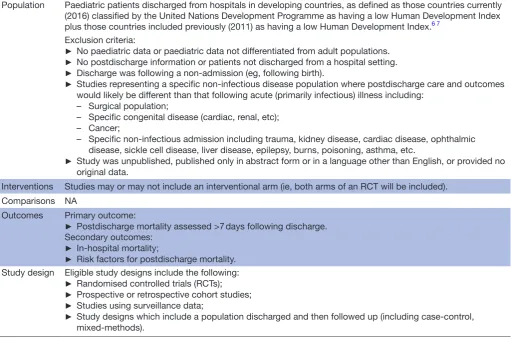
The primary objective was to determine the risk factors and rates of mortality in children following discharge from hospitals in developing countries. Table 1 outlines the study inclusion eligibility, determined through the Population, Interventions, Comparisons, Outcomes and Study Design format.
Patient and public involvement
Patients and the public were not involved in the design or conduct of this study.
search strategy
Articles published and indexed between 1 January 2012 and 18 July 2017 were identified using the MEDLINE and EMBASE databases within the OVID platform. The detailed search strategy for each database is outlined in online supplementary appendix 1. Studies conducted prior to 2012 were identified from a prior publication, using a similar search strategy.5 Articles were included
if the study was conducted in a developing country (defined as countries currently (2016) classified by the United Nations Development Programme as having a low Human Development Index plus those countries
Table 1 Population, Interventions, Comparisons, Outcomes and Study Design
Population Paediatric patients discharged from hospitals in developing countries, as defined as those countries currently (2016) classified by the United Nations Development Programme as having a low Human Development Index plus those countries included previously (2011) as having a low Human Development Index.6 7
Exclusion criteria:
► No paediatric data or paediatric data not differentiated from adult populations.
► No postdischarge information or patients not discharged from a hospital setting.
► Discharge was following a non-admission (eg, following birth).
► Studies representing a specific non-infectious disease population where postdischarge care and outcomes would likely be different than that following acute (primarily infectious) illness including:
– Surgical population;
– Specific congenital disease (cardiac, renal, etc); – Cancer;
– Specific non-infectious admission including trauma, kidney disease, cardiac disease, ophthalmic disease, sickle cell disease, liver disease, epilepsy, burns, poisoning, asthma, etc.
► Study was unpublished, published only in abstract form or in a language other than English, or provided no original data.
Interventions Studies may or may not include an interventional arm (ie, both arms of an RCT will be included). Comparisons NA
Outcomes Primary outcome:
► Postdischarge mortality assessed >7 days following discharge. Secondary outcomes:
► In-hospital mortality;
► Risk factors for postdischarge mortality. Study design Eligible study designs include the following:
► Randomised controlled trials (RCTs);
► Prospective or retrospective cohort studies;
► Studies using surveillance data;
► Study designs which include a population discharged and then followed up (including case-control, mixed-methods).
NA, not applicable.
on September 22, 2020 by guest. Protected by copyright.
opment Index ), included children admitted to hospital for medical reasons, and included follow-up to capture vital status during the postdischarge period.5 6
Further-more, references of all included articles were reviewed to identify other potentially eligible studies not captured in the systematic search.
study selection and data extraction
Two investigators (BN, LE) independently screened articles during two rounds of review. The first round consisted of reviewing all abstracts for the presence of specific exclusion criteria. The second round of review consisted of a detailed review of remaining articles in full-text format. In both rounds, any discrepancies were resolved through discussion and consensus. A third inves-tigator (MOW) provided arbitration for any discrepan-cies not resolved through consensus.
For eligible studies, the characteristics extracted included author, title and year of publication, year of study, country, study design, facility, population (diar-rhoea, malaria, all admissions, etc), time of enrolment (admission or discharge), number of subjects, age, sex and study eligibility criteria. Outcomes extracted included total number of subjects who died both in-hospital and following discharge, timing and location of postdischarge deaths, follow-up method and losses to follow-up, number of postdischarge rehospitalisations and health seeking, timing of rehospitalisations and health seeking and risk factors for postdischarge mortality. When extracting data on risk factors, the results of multivariate analysis were preferentially extracted over univariate analyses.
risk of bias
A formal risk of bias assessment, such as the Newcastle Ottawa Quality Assessment Scale for Cohort Studies, was not conducted since the primary outcome of the rate of postdischarge mortality was not exposure related among included studies. Primary factors leading to potential bias include the per cent follow-up as well as whether inclu-sion criteria were correctly applied to enrolled subjects, leading to a representative sample of the population. While the former was included in the outcome charac-teristics, the latter was not defined in any study. Thus, proportion of children successfully followed remains the primary indicator of risk of bias.
Data analysis and outcomes
Microsoft Excel (Redmond, Washington, USA) was used to compile extracted data. Due to varying populations, risk factors, definitions and types of results (eg, OR, HR), a formal meta-analysis was not deemed possible. Therefore, the analysis was descriptive in nature. The primary outcome was the proportion of discharged subjects who died during the postdischarge period. Secondary outcomes included the proportion of total deaths (in-hospital and postdischarge), which occurred following discharge, as well as risk factors associated with
lations were evaluated, results were reported according to the underlying study population. Studies were grouped according to five underlying populations: (1) all admis-sions including those for infectious diseases, (2) malnu-trition, (3) respiratory infection, (4) diarrhoeal diseases and (5) malaria/anaemia.
rEsults
summary of included articles
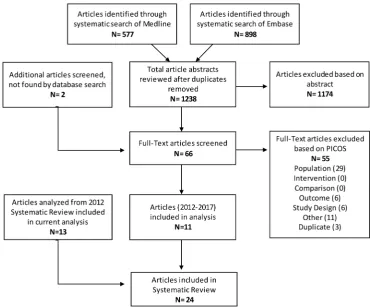
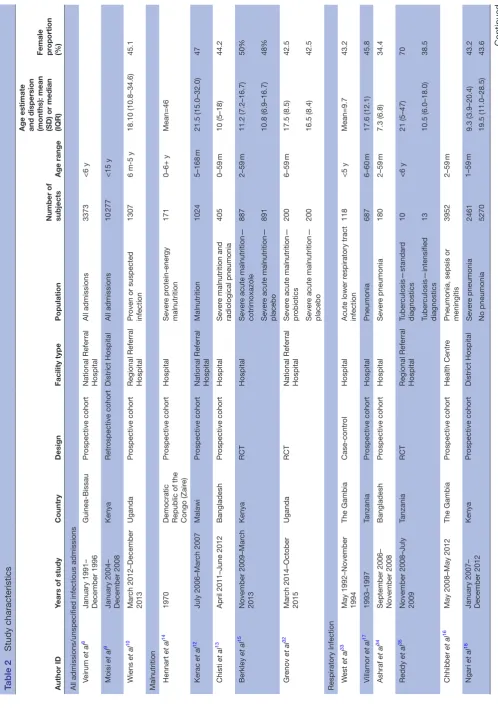
A total of 1238 articles were identified through the system-atic searches, with two additional articles identified inde-pendently. Of these, 1174 were excluded at the abstract stage and a further 55 were excluded during the full-text screening stage, resulting in 11 eligible studies (figure 1, online supplementary appendix 2). These 11 studies were added to the 13 studies identified prior to 2012 through a similar systematic search,5 resulting in a total of 24 included studies (table 2). Studies were grouped according to underlying population. Three studies exam-ined either all admissions or all infectious admissions, five examined malnutrition, seven respiratory infection, three diarrhoeal diseases and six included children with malaria and/or anaemia. Seven randomised controlled trials, 12 prospective cohorts, 2 retrospective cohorts and 3 case-control studies were included. Two studies examined those admitted to a health centre, whereas the remaining 22 were conducted at various types and levels of hospi-tals. All studies were performed in a single country, and Bangladesh was the only non-African country in which included studies were conducted.
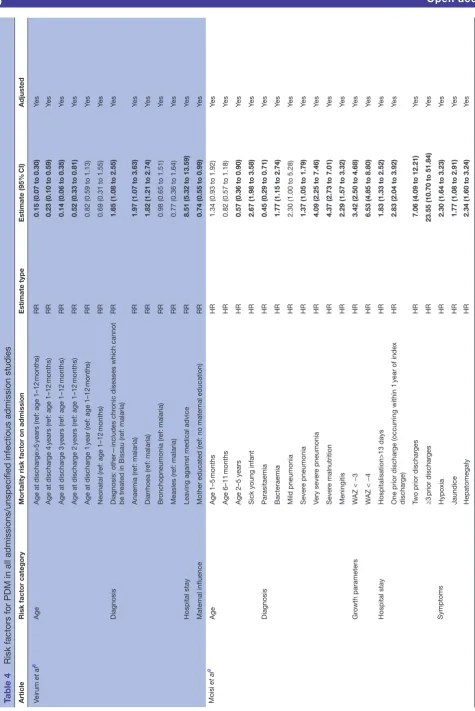
All admissions, including unspecified infectious admissions The three studies within this population were conducted between 1991 and 2013 in Guinea-Bissau, Kenya and Uganda, and enrolled between 1307 and 10 277 subjects (table 2).8–10 Follow-up periods ranged from 6 months to
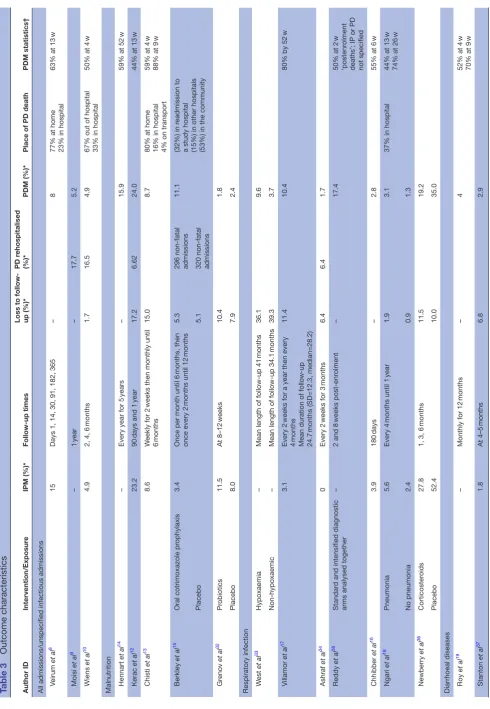
1 year, with postdischarge mortality ranging from 4.9% to 8% (table 3). Two studies reported postdischarge read-mission, measured rates between 16.5% and 17.7%.9–11
Inpatient mortality was recorded by two studies, finding rates of 4.9% and 15%.8 10 These same studies recorded
that most postdischarge deaths (67% and 77%) occurred outside of the hospital setting. The majority of postdis-charge deaths occurred relatively early in the follow-up period, with 63% occurring within 13 (of 52) weeks in one study and 50% within 8 (of 24) weeks in the other study.8 10 Several variables were included in risk factor
analyses for postdischarge mortality (table 4). Increasing age was shown to be a protective factor in all three studies. Parasitaemia was found to be associated with lower PDM compared with other diagnoses in two studies, with the third study showing lower PDM compared with diarrhoea, anaemia and other less common diagnoses. Bacteraemia, severe or very severe pneumonia, severe malnutrition, meningitis and HIV were all associated with a higher prob-ability of postdischarge death.9 10 In the study by Veirum et
on September 22, 2020 by guest. Protected by copyright.
al that evaluated discharge against medical advice (AMA), those who left AMA were eight times more likely to die after discharge.8 Anthropometric factors (including
mid-upper arm circumference (MUAC), weight-for-age, weight-for-height and height-for-age z-scores), hypoxia, respiratory rate, jaundice, hepatomegaly and Blantyre coma scale rating were all associated with a statistically significant increase in the probability of PDM.9 10 Those
who had been hospitalised prior to the index admission were also at increased risk for death, with each additional hospitalisation compounding the risk.9 10
Malnutrition
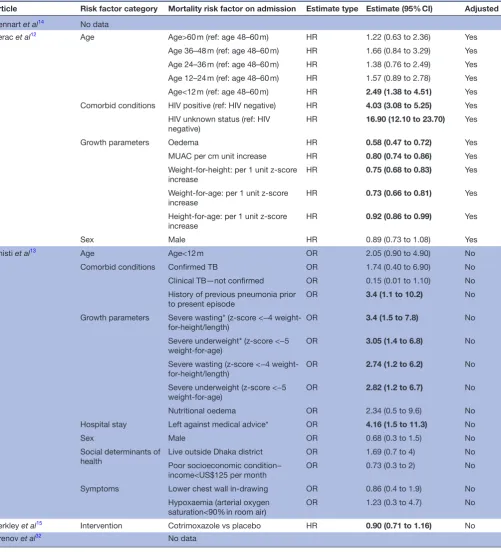
Five studies focusing on a malnourished population were identified. These studies were conducted in the Democratic Republic of the Congo, Malawi, Bangla-desh, Kenya and Uganda between 1970 and 2015 and and enrolled between 171 and 1778 children (table 2). The period of follow-up varied widely in this subpopula-tion, ranging from 8 weeks to 5 years (table 3). Postdis-charge mortality rates were observed to be between 1.8% and 24%. Where hospital mortality rates were measured (n=2), mortality following discharge was comparable to that observed during hospital admission, with one study reporting an inpatient mortality rate of 23.2% (24% after discharge), and a second study of 8.6% (8.7% after discharge).12 13 Three of four studies specified the timing
of deaths during the follow-up period with all finding that the majority of deaths following discharge occurred early during the follow-up period (relative to total follow-up).
In one study, 59% of those who died after discharge did so within 52 weeks (of 5 years),14 another found that
44% died within 13 (of 52) weeks,12 and the third study
observed 88% dying within 9 (of 26) weeks of discharge.13
A study conducted in Bangladesh reporting the loca-tion of postdischarge death found that 80% of deaths occurred at home, while another conducted in Kenya found 53% occurring in the community.13 15
Anthropo-metric parameters including MUAC, weight-for-age and weight-for-height z-scores were among the highly signifi-cant predictors for death postdischarge (table 5).12 13 Age
<12 months was associated with mortality in one study, but was found not to be significant in another, although wide CIs could not rule out an important effect.12 13
Highly significant associations variables included positive HIV status (HR 4.03; 95% CI 3.08 to 5.25), unknown HIV status (HR 16.90; 95% CI 12.10 to 23.70) and discharge AMA (HR 4.68; 95% CI 2.01 to 10.85).
respiratory infection
Seven studies examining respiratory infections were iden-tified. These included children with a variety of inclusion criteria, including pneumonia, acute lower respiratory tract infection and tuberculosis. Studies were conducted between 1992 and 2014 in the Gambia, Tanzania, Bangla-desh, Malawi and Kenya (table 2). Mortality rates post-discharge ranged widely, from 1.3% to 35% across the studies. These rates, however, remained consistently comparable to inpatient mortality when both were measured (table 3). As with other populations, mortality
Figure 1 Preferred Reporting Items for Systematic Reviews and Meta-Analyses flow diagram.
on September 22, 2020 by guest. Protected by copyright.
Table 2
Study characteristics
Author ID
Years of study
Country
Design
Facility type
Population
Number of subjects
Age range
Age estimate and dispersion (months): mean (SD) or median (IQR) Female proportion (%)
All admissions/unspecified infectious admissions Veirum
et al
8
January 1991– December 1996
Guinea-Bissau
Pr
ospective cohort
National Referral Hospital
All admissions 3373 <6 y Moisi et al 9
January 2004– December 2008
Kenya Retr ospective cohort District Hospital All admissions 10 277 <15 y Wiens et al 10 Mar ch 2012–December 2013 Uganda Pr ospective cohort
Regional Referral Hospital
Pr
oven or suspected
infection
1307
6 m-5 y
18.10 (10.8–34.6)
45.1
Malnutrition Hennart
et al
14
1970
Democratic Republic of the Congo (Zair
e) Pr ospective cohort Hospital Sever e pr otein-ener gy malnutrition 171 0–6+ y Mean=46 Kerac et al 12 July 2006–Mar ch 2007 Malawi Pr ospective cohort
National Referral Hospital
Malnutrition 1024 5–168 m 21.5 (15.0–32.0) 47 Chisti et al 13
April 2011–June 2012
Bangladesh
Pr
ospective cohort
Hospital
Sever
e malnutrition and
radiological pneumonia 405 0–59 m 10 (5–18) 44.2 Berkley et al 15 November 2009–Mar ch 2013 Kenya RCT Hospital Sever
e acute malnutrition—
cotrimoxazole 887 2–59 m 11.2 (7.2–16.7) 50% Sever
e acute malnutrition—
placebo 891 10.8 (6.9–16.7) 48% Gr enov et al 32 Mar ch 2014–October 2015 Uganda RCT
National Referral Hospital
Sever
e acute malnutrition—
pr obiotics 200 6–59 m 17.5 (8.5) 42.5 Sever
e acute malnutrition—
placebo
200
16.5 (8.4)
42.5
Respiratory Infection W
est
et al
33
May 1992–November 1994
The Gambia
Case-contr
ol
Hospital
Acute lower r
espiratory tract infection 118 <5 y Mean=9.7 43.2 Villamor et al 17 1993–1997 Tanzania Pr ospective cohort Hospital Pneumonia 687 6–60 m 17.6 (12.1) 45.8 Ashraf et al 34
September 2006– November 2008
Bangladesh Pr ospective cohort Hospital Sever e pneumonia 180 2–59 m 7.3 (6.8) 34.4 Reddy et al 35
November 2008–July 2009
Tanzania
RCT
Regional Referral Hospital
Tuber culosis—standar d diagnostics 10 <6 y 21 (5–47) 70 Tuber culosis—intensified diagnostics 13 10.5 (6.0–18.0) 38.5 Chhibber et al 16
May 2008–May 2012
The Gambia
Pr
ospective cohort
Health Centr
e
Pneumonia, sepsis or meningitis
3952 2–59 m Ngari et al 18
January 2007– December 2012
Kenya Pr ospective cohort District Hospital Sever e pneumonia 2461 1–59 m 9.3 (3.9–20.4) 43.2 No pneumonia 5270 19.5 (11.0–28.5) 43.6 Continued
on September 22, 2020 by guest. Protected by copyright.
Author ID
Years of study
Country
Design
Facility type
Population
Number of subjects
Age range
Age estimate and dispersion (months): mean (SD) or median (IQR) Female proportion (%)
Newberry
et al
36
April 2012–August 2014
Malawi
RCT
Hospital
Pneumocystis jir
ovecii
pneumonia (PJP)— intervention (corticoster
oids)
36
2–6
m
3.1 (2.7–3.9)
66.7
PJP—placebo
42
3.4 (2.9–4.4)
50
Diarrhoea Roy
et al
19
1979–1980
Bangladesh
Pr
ospective cohort
Health Centr
e
Diarrhoea
551
3–36
m
Stanton
et al
37
October 1983– December 1983
Bangladesh
Retr
ospective
cohort
Hospital
Diarrhoea
112
24–72
m
27
Islam
et al
20
November 1991– December 1992
Bangladesh
Pr
ospective cohort
Hospital
Diarrhoea
427
1–23
m
39.1
Anaemia/Malaria Zucker
et al
24
Mar
ch 1991–September
1991
Kenya
Case-contr
ol
District Hospital
Anaemia (case)
293
<60
m
9.8 (8.6)
50
No anaemia (contr
ol)
291
13.5 (11.3)
50
Biai
et al
21
December 2004– January 2006
Guinea-Bissau
RCT
National Referral Hospital
Malaria—intervention
460
3–60
m
24 (13–36)
45.4
Malaria—no intervention
491
24 (14–39)
43
Phiri
et al
25
July 2002–July 2004
Malawi
Longitudinal case- contr
ol
Hospital
Sever
e anaemia
377
6–60
m
20.4 (12.8)
53.6
No anaemia
377
22.5 (12.1)
47.7
Phiri
et al
23
June 2006– August 2009
Malawi
RCT
Hospital
Sever
e malarial anaemia
1414
4–59
m
23.9 (13.4)
51.6
Olupot-Olupot
et al
26
2014
Uganda
RCT
Hospital
Sever
e anaemia—higher
blood transfusion volume (30
mL/kg)
78
60 d–12 y
31 (11–48)
51
Sever
e anaemia—standar
d
blood transfusion volume (20
mL/kg)
82
36 (19–54)
50
Opoka
et al
22
November 2008– October 2013
Uganda
Pr
ospective cohort
National Referral Hospital
Cer
ebral malaria
269
18 m–12 y
3.9 (2.7–6.0)
35.2
Sever
e malarial anaemia
233
2.8 (2.1–3.9)
39.9
d, day; m, month; RCT
, randomised contr
olled trial; y
, year
.
Table 2
Continued
on September 22, 2020 by guest. Protected by copyright.
Table 3 Outcome characteristics Author ID Intervention/Exposur e IPM (%)* Follow-up times
Loss to follow- up (%)*
PD r
ehospitalised
(%)*
PDM (%)*
Place of PD death
PDM statistics†
All admissions/unspecified infectious admissions Veirum
et al
8
15
Days 1, 14, 30, 91, 182, 365
–
8
77% at home 23% in hospital
63% at 13
w Moisi et al 9 – 1 year – 17.7 5.2 Wiens et al 10 4.9
2, 4, 6
months
1.7
16.5
4.9
67% out of hospital 33% in hospital
50% at 4
w
Malnutrition Hennart
et al
14
–
Every year for 5
years
–
15.9
59% at 52
w Kerac et al 12 23.2 90 days and 1 year 17.2 6.62 24.0
44% at 13
w Chisti et al 13 8.6 W
eekly for 2
weeks then monthly until
6
months
15.0
8.7
80% at home 16% in hospital 4% on transport
59% at 4
w
88% at 9
w
Berkley
et al
15
Oral cotrimoxazole pr
ophylaxis
3.4
Once per month until 6
months, then
once every 2
months until 12
months
5.3
296 non-fatal admissions
11.1
(32%) in r
eadmission to
a study hospital (15%) in other hospitals (53%) in the community
Placebo
5.1
320 non-fatal admissions
Gr enov et al 32 Pr obiotics 11.5 At 8–12 weeks 10.4 1.8 Placebo 8.0 7.9 2.4
Respiratory infection W
est
et al
33
Hypoxaemia
–
Mean length of follow-up 41
months
36.1
9.6
Non-hypoxaemic
–
Mean length of follow-up 34.1
months 39.3 3.7 Villamor et al 17 3.1 Every 2
weeks for a year then every
4
months
Mean duration of follow-up 24.7
months (SD=12.3, median=28.2)
11.4
10.4
80% by 52
w Ashraf et al 34 0 Every 2
weeks for 3
months 6.4 6.4 1.7 Reddy et al 35 Standar
d and intensified diagnostic
arms analysed together
–
2 and 8
weeks post-enr
olment
–
17.4
50% at 2
w
‘postenr
olment
deaths’; IP or PD not specified
Chhibber et al 16 3.9 180 days – 2.8
55% at 6
w Ngari et al 18 Pneumonia 5.6 Every 4
months until 1
year
1.9
3.1
37% in hospital
44% at 13
w
74% at 26
w No pneumonia 2.4 0.9 1.3 Newberry et al 36 Corticoster oids 27.8
1, 3, 6
months 11.5 19.2 Placebo 52.4 10.0 35.0
Diarrhoeal diseases Roy
et al
19
–
Monthly for 12
months
–
4
52% at 4
w
70% at 9
w Stanton et al 37 1.8 At 4–5 months 6.8 2.9 Continued
on September 22, 2020 by guest. Protected by copyright.
Author ID
Intervention/Exposur
e
IPM (%)*
Follow-up times
Loss to follow- up (%)*
PD r
ehospitalised
(%)*
PDM (%)*
Place of PD death
PDM statistics†
Islam
et al
20
14.6
At 6 and 12
weeks
–
7.5
94% at 6
w
Anaemia/Malaria Zucker
et al
24
Anaemia
13
4 and 8
weeks
4.0
18.8
No anaemia; figur
es include the
analysed ‘no-anaemia cohort’ fr
om
study plus additional childr
en
9
4.0
10.3
Biai
et al
21
Intervention: impr
oved management
and fr
ee emer
gency drugs for
malaria, financial incentive
4.6
28
days
3.9
1.8
Contr
ol
9.4
4.9
0.9
Phiri
et al
25
Sever
e anaemia
6.4
1, 3, 6, 12, 18
months
17.8
18.1
11.6
71% at 26
w
No anaemia
0
19.6
9.3
2.7
60% at 26
w
Phiri
et al
23
Artemether–lumefantrine
–
1, 3, 6
months
5.0
21.5
2.5
50% at 4
w
Placebo
–
4.9
24.4
2.3
50% at 9
w
Olupot-Olupot
et al
26
Sever
e anaemia—higher blood
transfusion volume (30
mL/kg)
0
28
days
postadmission
0
1.3
Sever
e anaemia—standar
d blood
transfusion volume (20
mL/kg)
7.3
0
0
Opoka
et al
22
Cer
ebral malaria
12.6
6
months
2.5
3.1
0.6
Sever
e malarial anaemia
0.4
3.6
9.4
2.2
*Indicates cumulative rates as of the last follow-up time. †Indicates specified mortality statistics in r
egar
d to per cent of total postdischar
ges by a certain number of weeks, in r
elation to entir
e duration of follow-up.
IP
, inpatient; IPM, inpatient mortality; PD, postdischar
ge; PDM, postdischar
ge mortality; w
,week.
Table 3
Continued
on September 22, 2020 by guest. Protected by copyright.
Table 4
Risk factors for PDM in all admissions/unspecified infectious admission studies
Article
Risk factor category
Mortality risk factor on admission
Estimate type Estimate (95% CI) Adjusted Veirum et al 8 Age
Age at dischar
ge>5
years (r
ef: age 1–12
months)
RR
0.15
(0.07 to 0.30)
Ye
s
Age at dischar
ge 4
years (r
ef: age 1–12
months)
RR
0.23
(0.10 to 0.59)
Ye
s
Age at dischar
ge 3
years (r
ef: age 1–12
months)
RR
0.14
(0.06 to 0.35)
Ye
s
Age at dischar
ge 2
years (r
ef: age 1–12
months)
RR
0.52
(0.33 to 0.81)
Ye
s
Age at dischar
ge 1
year (r
ef: age 1–12
months)
RR
0.82 (0.59 to 1.13)
Ye
s
Neonatal (r
ef: age 1–12
months)
RR
0.69 (0.31 to 1.55)
Ye
s
Diagnosis
Diagnosis: other—includes chr
onic diseases which cannot
be tr
eated in Bissau (r
ef: malaria)
RR
1.65 (1.08 to 2.55)
Ye
s
Anaemia (r
ef: malaria)
RR
1.97 (1.07 to 3.63)
Ye
s
Diarrhoea (r
ef: malaria)
RR
1.82 (1.21 to 2.74)
Ye s Br onchopneumonia (r ef: malaria) RR
0.98 (0.65 to 1.51)
Ye
s
Measles (r
ef: malaria)
RR
0.77 (0.36 to 1.64)
Ye
s
Hospital stay
Leaving against medical advice
RR
8.51 (5.32 to 13.59)
Ye
s
Mater
nal influence
Mother educated (r
ef: no mater
nal education)
RR
0.74 (0.55 to 0.99)
Ye s Moisi et al 9 Age Age 1–5 months HR
1.34 (0.93 to 1.92)
Ye s Age 6–11 months HR
0.82 (0.57 to 1.18)
Ye
s
Age 2–5 years
HR
0.57 (0.36 to 0.90)
Ye
s
Sick young infant
HR
2.67 (1.98 to 3.58)
Ye
s
Diagnosis
Parasitaemia
HR
0.45 (0.29 to 0.71)
Ye
s
Bacteraemia
HR
1.77 (1.15 to 2.74)
Ye
s
Mild pneumonia
HR
2.30 (1.00 to 5.28)
Ye
s
Sever
e pneumonia
HR
1.37 (1.05 to 1.79)
Ye
s
Very sever
e pneumonia
HR
4.09 (2.25 to 7.46)
Ye
s
Sever
e malnutrition
HR
4.37 (2.73 to 7.01)
Ye
s
Meningitis
HR
2.29 (1.57 to 3.32)
Ye
s
Gr
owth parameters
W
AZ < −3
HR
3.42 (2.50 to 4.68)
Ye
s
W
AZ < −4
HR
6.53 (4.85 to 8.80)
Ye
s
Hospital stay
Hospitalisation>13 days
HR
1.83 (1.33 to 2.52)
Ye
s
One prior dischar
ge (occurring within 1
year of index
dischar
ge)
HR
2.83 (2.04 to 3.92)
Ye
s
Two prior dischar
ges
HR
7.06 (4.09 to 12.21)
Ye s ≥3 prior dischar ges HR
23.55 (10.70 to 51.84)
Ye
s
Symptoms
Hypoxia
HR
2.30 (1.64 to 3.23)
Ye
s
Jaundice
HR
1.77 (1.08 to 2.91)
Ye
s
Hepatomegaly
HR
2.34 (1.60 to 3.24)
Ye
s
Continued
on September 22, 2020 by guest. Protected by copyright.
Article
Risk factor category
Mortality risk factor on admission
Estimate type
Estimate
(95%
CI)
Adjusted
Wiens
et al
10 2015
Age
Age (months)
OR
0.97 (0.97 to 0.97)
No
Comorbid conditions
HIV positive
OR
5.21 (2.55 to 10.65)
No
Gr
owth parameters
MUAC (mm)
OR
0.97 (0.96 to 0.98)
No
W
eight-for
-age z-scor
e
OR
0.66 (0.57 to 0.76)
No
W
eight for length/height z-scor
e
OR
0.81 (0.72 to 0.91)
No
Length/height-for
-age z-scor
e
OR
0.79 (0.70 to 0.89)
No
Hospital stay
Illness>7
days prior to admission
OR
0.50
(0.30 to 0.83)
No
Time since last hospitalisation (or
der
ed as <7
days,
7–30
days, 30
days to 1
year
, >1
year and never (analysed as
continuous and coded as 1–5, r
espectively)
OR
0.75 (0.62 to 0.90)
No
Labs/Assessments
Haemoglobin (g/dL)
OR
0.95 (0.87 to 1.03)
No
Blantyr
e coma scale<5 (r
ef: 5)
OR
2.40 (1.27 to 4.57)
No
Positive blood smear
OR
0.33 (0.16 to 0.68)
No
Mater
nal influence
Mater
nal age (years)
OR
1.00 (0.97 to 1.04)
No
Mater
nal HIV positive (r
ef: HIV negative)
OR
1.79 (0.87 to 3.67)
No
Mater
nal HIV status unknown (r
ef: HIV negative)
OR
1.27 (0.64 to 2.52)
No
Mater
nal education primary 3–7 (r
ef: mater
nal
education<P3)
OR
1.18 (0.62 to 2.23)
No
Mater
nal education some secondary (r
ef: mater
nal
education<P3)
OR
0.72 (0.31 to 1.70)
No
Mater
nal education postsecondary (r
ef: mater
nal
education<P3)
OR
1.18 (0.41 to 3.36)
No
Sex
Male
OR
0.90 (0.54 to 1.51)
No
Social determinants of health
Bed net use—sometimes (r
ef: never)
OR
1.00 (0.48 to 2.09)
No
Bed net use—always (r
ef: never)
OR
0.85 (0.46 to 1.58)
No
Siblings death
OR
1.54 (0.89 to 2.65)
No
Number of childr
en in the family
OR
1.02 (0.92 to 1.13)
No
Boil all drinking water
OR
0.82 (0.47 to 1.42)
No
Distance fr
om hospital 30–60
min (r
ef: distance<30
min)
OR
0.71 (0.31 1.64)
No
Distance fr
om hospital>60
min (r
ef: distance<30
min)
OR
1.30 (0.70 to 2.41)
No
Table 4
Continued
Continued
on September 22, 2020 by guest. Protected by copyright.
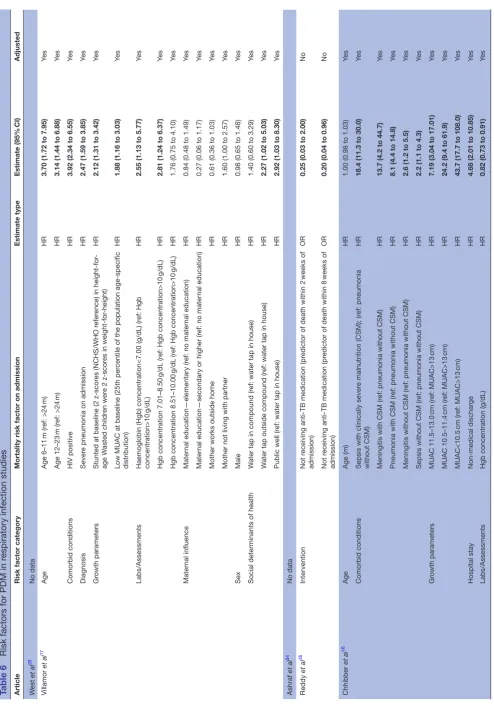
prospective cohort study by Ngari et al including children aged 1–59 months with severe pneumonia found that 74% of postdischarge deaths occurred by 26 (of 52) weeks with 63% occurring outside of the hospital. Chhibber et al16
conducted a study of 3952 children admitted primarily with pneumonia in rural Gambia, and sought to identify specific comorbidities and physiologic factors predictive of mortality after discharge. This study found that physio-logic factors, including neck stiffness, oxygen saturation, temperature and haemoglobin concentration were asso-ciated with postdischarge mortality. Malnutrition-related variables (clinical malnutrition and low MUAC) were the strongest predictors of postdischarge mortality, producing HRs ranging from 18.4 to 43.7 (table 6). Although indi-vidual studies differed in regard to whether risk factors were measured continuously, categorically or dichoto-mously, it is clear that the directionality of certain risk factors such as low haemoglobin and low MUAC continue to be associated with higher PDM in children admitted for respiratory illness.16–18 When examining the timing
of mortality, most cases occurred relatively early during follow-up. One study found that 80% had occurred by 12 months (mean duration of follow-up 24.7 months),17
another study had 55% by 6 (of 26) weeks16 and yet
another reported 74% by 26 (of 52) weeks.18 Low MUAC,
stunting, HIV-positive status, jaundice, low haemoglobin, under 24 months of age and availability of water were significant predictors of postdischarge mortality among children with respiratory illness.17 18
Diarrhoeal diseases
Three studies of paediatric patients with diarrhoea conducted between 1979 and 1992 were included, all three of which were conducted in Bangladesh (table 2). Included studies enrolled children aged 1–72 months and found postdischarge death rates of between 2% and 8%, all being generally comparable to in-hospital rates (table 3). Deaths occurred within the first few weeks after discharge, with one study reporting 52% by 4 (of 52) weeks,19 and a second
reporting 94% of deaths occurring by 6 (of 12) weeks postdischarge.20 Significant risk factors for death after
discharge identified in this set of studies included young age (<6 months), not having been breast fed, malnutrition (based on Height for age z-score (HAZ) and WAZ scores), low levels of maternal education and immunisation status of the child (table 7).
Anaemia and/or malaria
Six studies were conducted between 1991 and 2014 in Kenya, Guinea-Bissau, Malawi and Uganda in chil-dren with anaemia and/or malaria (table 2). Studies were heterogeneous in their specified populations, including children with various illness severity, with mortality postdischarge ranging from 0.9% to 18.8%, and with follow-up periods ranging from 1 to 18 months (table 3). In the only study looking
Article
Risk factor category
Mortality risk factor on admission
Estimate type
Estimate
(95%
CI)
Adjusted
Vital signs
HR for age z-scor
e
OR
0.86 (0.74 to 0.99)
No
HR (raw)
OR
1.00 (0.99 to 1.01)
No
RR for age z-scor
e
OR
0.99 (0.92 to 1.06)
No
RR (raw)
OR
1.01 (1.00 to 1.03)
No
SBP z-scor
e
OR
0.94 (0.79 to 1.12)
No
SBP (raw)
OR
0.98 (0.96 to 1.00)
No
DBP (raw)
OR
0.99 (0.97 to 1.01)
No
Temperatur
e (transformed)
OR
1.02 (0.90 to 1.16)
No
Temperatur
e (raw)
OR
0.76 (0.62 to 0.93)
No
SpO
2
(raw)
OR
0.94 (0.92 to 0.96)
No
SpO
2
(transformed)
OR
1.04 (1.02 to 1.05)
No
Bolded values ar
e statistically significant.
DBP
, diastolic blood pr
essur
e; PDM, postdischar
ge mortality; RR, r
elative risk; SBP
, systolic blood pr
essur
e; W
AZ, weight for age z-scor
e.
Table 4
Continued
on September 22, 2020 by guest. Protected by copyright.
specifically at acute malaria, postdischarge mortality (1.8% intervention; 0.9%% control) was lower than inpatient mortality (4.6% intervention; 9.4% control) over a follow-up period of 28 days.21 Another study
that followed children with cerebral malaria or severe malarial anaemia for 6 months following discharge reported that although children with cerebral
malaria experienced higher inpatient mortality (13% compared with 0.4%), those with severe malarial anaemia had a higher rate of death after discharge (2.2% compared with 0.6%).22 A large study (n=1414)
by Phiri et al examining severe malarial anaemia found high rates of postdischarge readmission (approxi-mately 22%), with rates of death at approxi(approxi-mately
Article Risk factor category Mortality risk factor on admission Estimate type Estimate (95% CI) Adjusted
Hennart et al14 No data
Kerac et al12 Age Age>60 m (ref: age 48–60 m) HR 1.22 (0.63 to 2.36) Yes
Age 36–48 m (ref: age 48–60 m) HR 1.66 (0.84 to 3.29) Yes
Age 24–36 m (ref: age 48–60 m) HR 1.38 (0.76 to 2.49) Yes
Age 12–24 m (ref: age 48–60 m) HR 1.57 (0.89 to 2.78) Yes
Age<12 m (ref: age 48–60 m) HR 2.49 (1.38 to 4.51) Yes
Comorbid conditions HIV positive (ref: HIV negative) HR 4.03 (3.08 to 5.25) Yes
HIV unknown status (ref: HIV negative)
HR 16.90 (12.10 to 23.70) Yes
Growth parameters Oedema HR 0.58 (0.47 to 0.72) Yes
MUAC per cm unit increase HR 0.80 (0.74 to 0.86) Yes
Weight-for-height: per 1 unit z-score increase
HR 0.75 (0.68 to 0.83) Yes
Weight-for-age: per 1 unit z-score increase
HR 0.73 (0.66 to 0.81) Yes
Height-for-age: per 1 unit z-score increase
HR 0.92 (0.86 to 0.99) Yes
Sex Male HR 0.89 (0.73 to 1.08) Yes
Chisti et al13 Age Age<12 m OR 2.05 (0.90 to 4.90) No
Comorbid conditions Confirmed TB OR 1.74 (0.40 to 6.90) No
Clinical TB—not confirmed OR 0.15 (0.01 to 1.10) No
History of previous pneumonia prior to present episode
OR 3.4 (1.1 to 10.2) No
Growth parameters Severe wasting* (z-score <−4
weight-for-height/length)
OR 3.4 (1.5 to 7.8) No
Severe underweight* (z-score <−5 weight-for-age)
OR 3.05 (1.4 to 6.8) No
Severe wasting (z-score <−4 weight-for-height/length)
OR 2.74 (1.2 to 6.2) No
Severe underweight (z-score <−5 weight-for-age)
OR 2.82 (1.2 to 6.7) No
Nutritional oedema OR 2.34 (0.5 to 9.6) No
Hospital stay Left against medical advice* OR 4.16 (1.5 to 11.3) No
Sex Male OR 0.68 (0.3 to 1.5) No
Social determinants of
health Live outside Dhaka districtPoor socioeconomic condition− OR 1.69 (0.7 to 4) No
income<US$125 per month OR 0.73 (0.3 to 2) No
Symptoms Lower chest wall in-drawing OR 0.86 (0.4 to 1.9) No
Hypoxaemia (arterial oxygen saturation<90% in room air)
OR 1.23 (0.3 to 4.7) No
Berkley et al15 Intervention Cotrimoxazole vs placebo HR 0.90 (0.71 to 1.16) No
Grenov et al32 No data
Bolded values are statistically significant. *Risk factor for mortality assessed on discharge.
m, month; PDM, postdischarge mortality; TB, tuberculosis.
on September 22, 2020 by guest. Protected by copyright.
Table 6
Risk factors for PDM in r
espiratory infection studies
Article
Risk factor category
Mortality risk factor on admission
Estimate type Estimate (95% CI) Adjusted W est et al 33 No data Villamor et al 17 Age Age 6–11 m (r ef: >24 m) HR 3.70
(1.72 to 7.95)
Ye s Age 12–23 m (r ef: >24 m) HR 3.14
(1.44 to 6.88)
Ye
s
Comorbid conditions
HIV positive
HR
3.92 (2.34 to 6.55)
Ye
s
Diagnosis
Sever
e pneumonia on admission
HR
2.47 (1.59 to 3.85)
Ye
s
Gr
owth parameters
Stunted at baseline (2 z-scor
es (NCHS/WHO r
efer
ence) in height-for
-age W
asted childr
en wer
e 2 z-scor
es in weight-for
-height)
HR
2.12 (1.31 to 3.42)
Ye
s
Low MUAC at baseline (25th per
centile of the population age-specific
distribution)
HR
1.88 (1.16 to 3.03)
Ye
s
Labs/Assessments
Haemoglobin (Hgb) concentration<7.00 (g/dL) (r
ef: Hgb
concentration>10
g/dL)
HR
2.55 (1.13 to 5.77)
Ye
s
Hgb concentration 7.01–8.50
g/dL (r
ef: Hgb concentration>10
g/dL)
HR
2.81
(1.24 to 6.37)
Ye
s
Hgb concentration 8.51–10.00
g/dL (r
ef: Hgb concentration>10
g/dL)
HR
1.76 (0.75 to 4.10)
Ye
s
Mater
nal influence
Mater
nal education—elementary (r
ef: no mater
nal education)
HR
0.84 (0.48 to 1.49)
Ye
s
Mater
nal education—secondary or higher (r
ef: no mater
nal education)
HR
0.27 (0.06 to 1.17)
Ye
s
Mother works outside home
HR
0.61 (0.36 to 1.03)
Ye
s
Mother not living with partner
HR
1.60 (1.00 to 2.57)
Ye
s
Sex
Male
HR
0.98 (0.65 to 1.48)
Ye
s
Social determinants of health
W
ater tap in compound (r
ef: water tap in house)
HR
1.40 (0.60 to 3.29)
Ye
s
W
ater tap outside compound (r
ef: water tap in house)
HR
2.27 (1.02 to 5.03)
Ye
s
Public well (r
ef: water tap in house)
HR
2.92 (1.03 to 8.30)
Ye s Ashraf et al 34 No data Reddy et al 35 Intervention Not r
eceiving anti-TB medication (pr
edictor of death within 2
weeks of
admission)
OR
0.25
(0.03 to 2.00)
No
Not r
eceiving anti-TB medication (pr
edictor of death within 8
weeks of
admission)
OR
0.20
(0.04 to 0.96)
No Chhibber et al 16 Age Age (m) HR
1.00 (0.98 to 1.03)
Ye
s
Comorbid conditions
Sepsis with clinically sever
e malnutrition (CSM); (r
ef: pneumonia
without CSM)
HR
18.4 (11.3 to 30.0)
Ye
s
Meningitis with CSM (r
ef: pneumonia without CSM)
HR
13.7 (4.2 to 44.7)
Ye
s
Pneumonia with CSM (r
ef: pneumonia without CSM)
HR
8.1 (4.4 to 14.8)
Ye
s
Meningitis without CSM (r
ef: pneumonia without CSM)
HR
2.6 (1.2 to 5.5)
Ye
s
Sepsis without CSM (r
ef: pneumonia without CSM)
HR
2.2 (1.1 to 4.3)
Ye s Gr owth parameters MUAC 11.5–13.0 cm (r ef: MUAC>13 cm) HR 7.19
(3.04 to 17.01)
Ye s MUAC 10.5–11.4 cm (r ef: MUAC>13 cm) HR 24.2
(9.4 to 61.9)
Ye s MUAC<10.5 cm (ref: MUAC>13 cm) HR
43.7 (17.7 to 108.0)
Ye s Hospital stay Non-medical dischar ge HR
4.68 (2.01 to 10.85)
Ye
s
Labs/Assessments
Hgb concentration (g/dL)
HR
0.82 (0.73 to 0.91)
Ye
s Continued
on September 22, 2020 by guest. Protected by copyright.
Article
Risk factor category
Mortality risk factor on admission
Estimate type
Estimate
(95%
CI)
Adjusted
Social determinants of health
Dry season
HR
1.96 (1.16 to 3.32)
Ye s Sym Neck stif fness HR
10.4 (3.1 to 34.8)
Ye s Vital signs Axillary temperatur e (°C) HR
0.71 (0.58 to 0.87)
Ye s SpO 2 (%) HR
0.96 (0.93 to 0.99)
Ye s Ngari et al 18 Age Age 12–23 m (r ef: age>24 m) HR
1.0 (0.1 to 9.6)
Ye s Age 6–11 m (r ef: age>24 m) HR
5.8 (0.8 to 40.5)
Ye s Age<6 m (ref: age>24 m) HR
4.8 (0.7 to 34.1)
Ye
s
Comorbid conditions
Reported pr
eterm/low birth weight
HR
0.7 (0.2 to 2.8)
Ye
s
HIV antibody test positive
HR
6.5 (2.3 to 18.4)
Ye
s
HIV test not performed
HR
0.4 (0.1 to 3.6)
Ye
s
RSV test positive
HR
0.3 (0.1 to 1.2)
Ye
s
RSV test not performed
HR
2.7 (1.2 to 6.3)
Ye
s
Malaria slide positive
HR
0.5 (0.1 to 5.2)
Ye
s
Bacteraemia
HR
0.8 (0.1 to 5.2)
Ye
s
Gr
owth parameters
MUAC per cm
HR
0.6 (0.5 to 0.8)
Ye
s
Hospital stay
Duration of hospitalisation (per day)
HR
1.1 (1.0 to 1.2)
Ye
s
Hospital stay
Year of admission 2008 (r
ef: 2007 admission year)
HR
0.9 (0.3 to 3.1)
Ye
s
Year of admission 2009 (r
ef: 2007 admission year)
HR
0.5 (0.1 to 2.1)
Ye
s
Year of admission 2010 (r
ef: 2007 admission year)
HR
0.7 (0.2 to 2.5)
Ye
s
Year of admission 2011 (r
ef: 2007 admission year)
HR
1.7 (0.5 to 5.3)
Ye
s
Year of admission 2012 (r
ef: 2007 admission year)
HR
1.8 (0.2 to 15.7)
Ye
s
Labs/Assessments
Sever
e anaemia (Hgb<5
g/dL)
HR
0.8 (0.1 to 7.5)
Ye
s
Sex
Female
HR
0.5 (0.3 to 1.1)
Ye
s
Social determinants of health
Residence distance fr
om hospital (per km)
HR
1.0 (0.9 to 1.1)
Ye s Symptoms Capillary refill>2 s HR
2.4 (0.5 to 12.1)
Ye
s
Impair
ed consciousness
HR
1.1 (0.2 to 7.8)
Ye
s
Wheezing
HR
0.5 (0.1 to 2.4)
Ye s Cough for>14 days HR
0.2 (0.1 to 5.5)
Ye
s
Jaundice
HR
12.5 (1.1 to 13.7)
Ye s Vital signs Hypoxia (SaO 2 <90%) HR
1.9 (0.7 to 5.4)
Ye
s
Axillary temperatur
e<36°C (r
ef: axillary temperatur
e 36°C–39°C)
HR
0.3 (0.1 to 2.8)
Ye
s
Axillary temperatur
e>39°C (r
ef: axillary temperatur
e 36°C–39°C)
HR
1.1 (0.4 to 3.0)
Ye s Newberry et al 36 Intervention Pr ednisone (r ef: placebo) RR
0.63 (0.41 to 0.95)
Bolded values ar
e statistically significant.
m, month; NCHS, National Center for Health Statistics; PDM, postdischar
ge mortality; RR, r
elative risk; TB, tuber
culosis.
Table 6
Continued
on September 22, 2020 by guest. Protected by copyright.
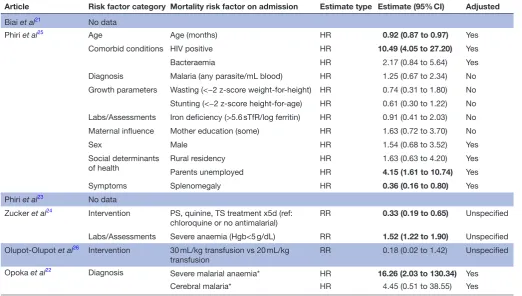
2.4%.23 Children with anaemia experienced higher
rates of inpatient (13% anaemia; 9% no anaemia) and postdischarge mortality (18.8% anaemia; 10.3% no anaemia).24 In both cohorts, death after discharge
was greater than death in-hospital. Rates of readmis-sion to hospital within 18 months were quantified in one study (18.4% severe anaemia; 9% no anaemia) and postdischarge mortality rates (11.6% anaemia; 2.7% no anaemia) exceed those of inpatient mortality rates (6.4% anaemia; 0% no anaemia).25 Although
this study had approximately 18% loss to follow-up, 71% of anaemic and 60% of non-anaemic total post-discharge deaths had occurred by 26 (of 78) weeks.25
An RCT conducted in Uganda studied the effect of transfusion volume (30 mL/kg vs the standard 20 mL/ kg) in severely anaemic children, which showed reduced inpatient mortality rates but no differ-ence for deaths after discharge (table 8).26 Rates of
death were consistently higher after discharge than in hospital in paediatric patients presenting with
Article Risk factor category Mortality risk factor on admission
Estimate
type Estimate (95% CI) Adjusted
Roy et al19 No data
Stanton et al37 No data
Islam et al20
Age Age<6 months RR 4.57 (2.90 to 7.18) Yes
Growth parameters Weight-for-age median<60% RR 1.04 (0.57 to 1.89) Yes
Length-for-age median<85% RR 2.97 (1.43 to 6.16) Yes
Maternal influence Mother’s education (no school vs >1 year) RR 2.12 (1.37 to 3.28) Yes
No breast feeding RR 2.35 (1.44 to 3.84) Yes
Sex Female RR 1.73 (1.14 to 2.65) Yes
Social determinants
of health Immunisation not up-to-date RR
1.36 (1.25 to 1.48) Yes
Bolded values are statistically significant. PDM, postdischarge mortality; RR, relative risk.
Table 8 Risk factors for PDM in anaemia/malaria studies
Article Risk factor category Mortality risk factor on admission Estimate type Estimate (95% CI) Adjusted
Biai et al21 No data
Phiri et al25 Age Age (months) HR 0.92 (0.87 to 0.97) Yes
Comorbid conditions HIV positive HR 10.49 (4.05 to 27.20) Yes
Bacteraemia HR 2.17 (0.84 to 5.64) Yes
Diagnosis Malaria (any parasite/mL blood) HR 1.25 (0.67 to 2.34) No
Growth parameters Wasting (<−2 z-score weight-for-height) HR 0.74 (0.31 to 1.80) No
Stunting (<−2 z-score height-for-age) HR 0.61 (0.30 to 1.22) No
Labs/Assessments Iron deficiency (>5.6 sTfR/log ferritin) HR 0.91 (0.41 to 2.03) No
Maternal influence Mother education (some) HR 1.63 (0.72 to 3.70) No
Sex Male HR 1.54 (0.68 to 3.52) Yes
Social determinants
of health Rural residencyParents unemployed HRHR 1.63 (0.63 to 4.20)4.15 (1.61 to 10.74) YesYes
Symptoms Splenomegaly HR 0.36 (0.16 to 0.80) Yes
Phiri et al23 No data
Zucker et al24 Intervention PS, quinine, TS treatment x5d (ref:
chloroquine or no antimalarial) RR 0.33 (0.19 to 0.65) Unspecified
Labs/Assessments Severe anaemia (Hgb<5 g/dL) RR 1.52 (1.22 to 1.90) Unspecified
Olupot-Olupot et al26 Intervention 30 mL/kg transfusion vs 20 mL/kg
transfusion RR 0.18 (0.02 to 1.42) Unspecified
Opoka et al22 Diagnosis
Severe malarial anaemia* HR 16.26 (2.03 to 130.34) Yes
Cerebral malaria* HR 4.45 (0.51 to 38.55) Yes
*Risk factor for readmission.
Hgb, haemoglobin; PDM, postdischarge mortality; RR, relative risk.
on September 22, 2020 by guest. Protected by copyright.
throughout these studies, severe anaemia was found to be highly significant for postdischarge death24 and
readmission to the hospital.22 HIV status profoundly
influenced mortality, with a HR of 10.49 (95% CI 4.05 to 27.20) for death postdischarge in children who tested positive.25
DIsCussIOn
Twenty-four studies examining postdischarge mortality in paediatric populations in developing countries were included in this systematic review, together substantiating the significant and unaddressed challenge continuing to plague children around the world. Significant heteroge-neity in study characteristics was noted, within inclusion criteria, study design, length of follow-up, interventions (if any), risk factors and risk factor definitions. Studies were conducted primarily in African countries, and examined a variety of populations, including all admissions, tious disease admissions, malnutrition, respiratory infec-tions, diarrhoea, malaria and anaemia. Studies examining anaemia and/or malaria had the lowest PDM rates, while those of malnutrition and respiratory infections had the highest. Results from the studies identified through the updated search generally reflected the results from the earlier systematic review; rates of postdischarge mortality continued to be high and comparable to (sometimes exceeding) in-hospital mortality, with most postdischarge deaths occurring at home.5 With so many deaths occurring
after discharge, it is critical that effective interventions be developed and evaluated as a means to addressing this neglected cause of childhood deaths. Furthermore, no analysis of cause for death postdischarge was identified within any of the reviewed studies, highlighting this as an important area for further research.
When reported, over two-thirds of postdischarge deaths were noted to occur outside of the hospital, generally at home. In order to develop interventions to reduce the burden of PDM, an understanding of circumstances and barriers to care following discharge is of utmost impor-tance. In a recent qualitative study, mothers of children who died postdischarge identified barriers to seeking care prior to their child’s death; barriers included lack of access to health facilities and services, poor health-seeking behaviour, finances, transportation and a lack of recognition of symptoms and perceptions of recovery in children recently discharged even in the midst of persisting illness.27 Additional factors that contribute
to poor socioeconomic conditions may relate to deaths after discharge, as they further disadvantage children and families. Socioeconomically disadvantaged children continue to be served by health sectors that are poorly resourced and lack the resilience to be able to deal with large numbers of patients seen every day. Follow-up care after initial hospitalisation is an important and yet largely ignored aspect of comprehensive healthcare in both developing countries.2 With so few patients returning
understanding the barriers and targeted interventions required to enhance outcomes must be initiated during the original hospitalisation.
Risk factors consistently identified across all types of infectious admissions as highly associated with postdis-charge mortality included HIV status, young age, pneu-monia, malnutrition, anthropometric factors, hypoxia, anaemia, leaving the hospital against medical advice and previous hospitalisations. An important observation, therefore, is that regardless of the underlying infectious aetiology, certain risk factors consistently identify vulner-ability. These observations suggest that vertical, disease-based, approaches to addressing postdischarge mortality are likely to be ineffective in comparison to simple, broadly applicable interventions. Specific illness (ie, pneumonia, diarrhoea, malaria) are often both difficult to differentiate clinically and often co-exist, especially in children in low-resource settings.28 Sepsis, therefore, as
the final common pathway for the majority of infectious disease-related deaths, may be a helpful framework within which to explore paediatric postdischarge mortality and to develop interventions. Instead of focusing on a specific body system or infectious agent, pragmatic interventions towards time-sensitive treatment can be focused towards sepsis as the overarching syndrome, increasing the poten-tial for impactful results.28 The Integrated Management
of Childhood Illness (IMCI) pocketbook by the WHO uses a similar approach through their identification of danger signs and treatments as opposed to individual diseases. Addressing sepsis through clinical management is an important component in the reduction of prevent-able childhood death, requiring sustained efforts by the global community including healthcare providers, patients, pharmaceutical companies and policy makers if large-scale change is to occur.29
While knowledge of risk factors alone has only moderate utility in the identification of vulnerable children, the development of robust prediction models can provide a more reliable means of risk evaluation. In resource-lim-ited environments, the use of prediction modelling is appealing, especially in relation to interventions aimed at improving postdischarge outcomes. A recent proof-of-concept study found that a simple discharge intervention including education and routine postdischarge follow-up could substantially improve postdischarge health seeking and health outcomes.30 Such approaches, if focused
primarily on the most vulnerable children, can ensure that limited resources are most effectively used and have the highest possible level of cost-effectiveness.
This systematic review is subject to several important limitations. First, it is possible that some relevant arti-cles may not have been identified through the system-atic search. Although the search was comprehensive, including both Medline and EMBASE, no MeSH/Emtree terms currently exist for postdischarge mortality and even so, many studies measure postdischarge mortality as a secondary end point. A further limitation of this review
on September 22, 2020 by guest. Protected by copyright.
in African countries. Therefore, these results may not be as applicable to countries outside of this setting. This highlights the continued need for ongoing research in resource-poor settings both within and outside of Africa. Significant heterogeneity in duration of follow-up, as well as when postdischarge mortality was assessed, was noted between the studies, potentially leading to a decreased ability to compare mortality rates. Many studies included in this review had high losses to follow-up (ranging between 0% and 39.3%), and very few were conducted prospectively with the stated intent of exploring postdis-charge mortality. Studies with significant attrition due to follow-up likely underestimate the true rate of postdis-charge mortality as these losses undoubtedly represent a more vulnerable population. While one study focused on barriers to care following discharge among those children who died in the community, one important remaining gap is that studies did not evaluate the causes of postdischarge mortality, which is difficult to measure given that most deaths occur in the community.10 27 The ongoing,
multi-country, Childhood Acute Illness and Nutrition (CHAIN) network, is attempting to understand the specific reasons for deaths postdischarge among malnourished children.31 It is through contributions such as this that
further interventions can be developed and implemented that target the specific and causal factors affecting paedi-atric mortality rates in developing countries.
COnClusIOns
In conclusion, the studies identified emphasise the signif-icant burden of postdischarge mortality in countries where overextended and resource-limited health systems serve millions of socioeconomically disadvantaged chil-dren. The scale of this burden continues to be under-rec-ognised, in part due to the inability of health systems to observe patient outcomes after discharge. Addressing these issues with specific regard to the identification of vulnerable children, and the development of effective postdischarge interventions, will be an essential compo-nent towards the achievement of the child mortality targets of the SDGs.
Author affiliations
1College of Nursing, University of Saskatchewan, Saskatoon, Saskatchewan,
Canada
2Department of Medicine, University of North Carolina, Raleigh, North Carolina, USA
3Department of Pediatrics, University of British Columbia, Vancouver, British
Columbia, Canada
4Center for International Child Health, BC Children's Hospital, Vancouver, British
Columbia, Canada
5Anesthesiology, Pharmacology and Therapeutics, University of British Columbia,
Vancouver, Canada
6Division of Global Health, Massachusetts General Hospital, Boston, Massachusetts,
USA
7Maternal, Newborn and Child Health Institute, Mbarara University of Science and
Technology, Mbarara, Uganda
8Faculty of Medicine, Mbarara University of Science and Technology, Mbarara,
Uganda
manuscript and approved the final manuscript as submitted. LE: contributed to analysis, reviewed and revised for important intellectual content and approved the final manuscript as submitted. NK: contributed to conception and design, interpretation of data and reviewed and revised the manuscript for important intellectual content and approved the final manuscript as submitted. JMA: contributed to conception and design, interpretation of data, reviewed and revised the manuscript for important intellectual content and approved the final manuscript as submitted. PPM: contributed to interpretation of data, reviewed and revised the manuscript for important intellectual content and approved the final manuscript as submitted. JK: contributed to interpretation of data, reviewed and revised the manuscript and approved the final manuscript as submitted. SF-K: contributed to interpretation of data, review and revision of manuscript for important intellectual content and approved the final manuscript as submitted. EK: contributed to interpretation of data, review and revision for intellectual content and revised the manuscript and approved the final manuscript as submitted. MOW: conceptualised and designed the review, coordinated and supervised analysis, critically reviewed and revised the manuscript and approved the final manuscript as submitted. All authors approved the final manuscript as submitted and agree to be accountable for all aspects of the work.
Funding The authors have not declared a specific grant for this research from any funding agency in the public, commercial or not-for-profit sectors.
Competing interests None declared. Patient consent Not required.
Provenance and peer review Not commissioned; externally peer reviewed. Data sharing statement There is no additional unpublished data from this study, as it is a systematic literature review. Any additional information is contained within the submitted appendices.
Open access This is an open access article distributed in accordance with the Creative Commons Attribution Non Commercial (CC BY-NC 4.0) license, which permits others to distribute, remix, adapt, build upon this work non-commercially, and license their derivative works on different terms, provided the original work is properly cited, appropriate credit is given, any changes made indicated, and the use is non-commercial. See: http:// creativecommons. org/ licenses/ by- nc/ 4. 0/.
rEFErEnCEs
1. Transforming our world: the 2030 Agenda for Sustainable
Development. New York: United Nations General Assembly, 2015.
2. Wiens MO, Kissoon N, Kabakyenga J. Smart discharges to address a
neglected epidemic in sepsis. JAMA pediatrics 2018;172:213–4.
3. Reinhart K, Daniels R, Kissoon N, et al. Recognizing sepsis
as a global health priority - a WHO resolution. N Engl J Med
2017;377:414–7.
4. Kissoon N, Reinhart K, Daniels R, et al. Sepsis in children: global
implications of the World Health Assembly Resolution on Sepsis.
Pediatr Crit Care Med 2017;18:e625–7.
5. Wiens MO, Pawluk S, Kissoon N, et al. Pediatric post-discharge
mortality in resource poor countries: a systematic review. PLoS One
2013;8:e66698.
6. Jahan S. Overview: human development report 2016: human
development for everyone. New York, NY: United Nations
Development Programme, 2016.
7. Klugman J. Human development report 2011. New York: United
Nations Development Program, 2011.
8. Veirum JE, Sodeman M, Biai S, et al. Increased mortality in the year
following discharge from a paediatric ward in Bissau, Guinea-Bissau.
Acta Paediatr 2007;96:1832–8.
9. Moïsi JC, Gatakaa H, Berkley JA, et al. Excess child mortality after
discharge from hospital in Kilifi, Kenya: a retrospective cohort
analysis. Bull World Health Organ 2011;89:725–32.
10. Wiens MO, Kumbakumba E, Larson CP, et al. Postdischarge
mortality in children with acute infectious diseases: derivation
of postdischarge mortality prediction models. BMJ Open
2015;5:e009449.
11 Wiens MO. Childhood mortality from acute infectious diseases in
Uganda: Studies in sepsis and post-discharge mortality: University of
British Columbia, 2015.
12. Kerac M, Bunn J, Chagaluka G, et al. Follow-up of post-discharge
growth and mortality after treatment for severe acute malnutrition
(FuSAM study): a prospective cohort study. PLoS One 2014;9:1–10.
on September 22, 2020 by guest. Protected by copyright.