RESEARCH
Lipid production and molecular
dynamics simulation for regulation of
acc
D
gene in cyanobacteria under different N and P
regimes
Roshan Kumar
1,2, Koushik Biswas
3, Puneet Kumar Singh
4, Pankaj Kumar Singh
5, Sanniyasi Elumalai
2,
Pratyoosh Shukla
4*and Sunil Pabbi
1Abstract
Background: Microalgae grown under different nutrient deficient conditions present a good source of natural lipids with applications for several types of biofuels. The expression of acetyl-CoA carboxylase gene can further provide an insight to the mechanisms leading to enhanced lipid production under such stresses. In this study, two nutrients viz. nitrogen and phosphorus were modulated to see its effect on lipid productivity in selected cyanobacteria and its cor-relation with Accase followed by molecular dynamics simulation.
Results: Selected cyanobacteria viz. Oscillatoria sp. (SP8), Anabaena sp. (SP12), Anabaena sp. (SP13), Microcoleus sp. (SP18), and Nostoc sp. (SP20) varied in their ability to accumulate lipids which ranged from a lowest of 0.13% in Ana-baena sp. (SP13) to the maximum of 7.24% in Microcoleus sp. (SP18). Microcoleus sp. (SP18) also recorded highest lipid accumulation at both N (6 mM NaNO3) and P (0.20 mM K2HPO4) limiting conditions. The overall expression of accD was found to be upregulated in both Oscillatoria sp. (SP8) and Microcoleus sp. (SP18) for all nitrogen concentrations but was differentially regulated with both positive and negative induction under phosphorus stress conditions. Maxi-mum induction was observed in Microcoleus sp. (SP18) at 0.20 mM K2HPO4. The obtained 3D structure of SP8 protein (21.8 kDa) showed six alpha helices, while SP18 protein (16.7 kDa) exhibited four alpha helices and four beta sheets. The phi (φ)/psi(ψ) angles of the amino acid residues observed in Ramachandran plot analysis showed that both SP8 and SP18 proteins were highly stable with more than 90% amino acids in allowed regions. The molecular dynamics simulation results also indicated the stability of ligand-bound protein complexes.
Conclusion: It has been demonstrated that cyanobacterial isolates are affected differently by nutrient limitation leading to variation in their lipid productivity. The same has been revealed by the behavior of accD gene expression which was regulated more by nutrients concentrations rather than the organism. However, the ligand-bound protein complexes were stable throughout MD simulations.
Keywords: Cyanobacteria, Nitrogen, Phosphorus limitation, Lipid production, accD gene expression
© The Author(s) 2017. This article is distributed under the terms of the Creative Commons Attribution 4.0 International License (http://creativecommons.org/licenses/by/4.0/), which permits unrestricted use, distribution, and reproduction in any medium, provided you give appropriate credit to the original author(s) and the source, provide a link to the Creative Commons license, and indicate if changes were made. The Creative Commons Public Domain Dedication waiver (http://creativecommons.org/ publicdomain/zero/1.0/) applies to the data made available in this article, unless otherwise stated.
Background
Bio-energy production has in recent past become a topic of intense interest due to increased concern over limited
petroleum-based fuels supplies and the contribution of the use of these fuels to atmospheric CO2 levels. It is
fur-ther envisaged that with developing world economies, the global energy consumption will also rise leading to more environmental damage. Above all, continued use of petroleum-based fuels and a limited supply has raised a question on its sustainability in near future. Thus, one of the most challenging problems facing mankind today
Open Access
*Correspondence: [email protected]
4 Enzyme Technology and Protein Bioinformatics Laboratory, Department
of Microbiology, Maharshi Dayanand University, Rohtak, Haryana 124001, India
is to find clean and renewable energy sources which are sustainable in the medium to long term. The available alternative sources such as solar, wind, geothermal, wave, and nuclear energy have many benefits but these are gen-erally limited to producing electricity rather than liquid and gaseous energy storage forms and do not provide a solution for other products derived from petroleum. Extensive research has also been carried out to use edible sources like soybean, rapeseed, sunflower, saffola oils [1], and non-edible products as jatropha, greases, tallow, and mahua oils [2–5] as biodiesel; however, higher feed cost is a major bottleneck in its commercial exploitation. Biolog-ical systems have the potential to function as feedstock for producing liquid or gaseous fuels and biomass-based fuels are ideal as these are renewable, can achieve high efficiencies and are generally well distributed geographi-cally. Moreover, there are few other related reports for coagulation, flocculation, and sedimentation processes of microalgae which have potential for related studies [6–13]. Among biological systems, many cyanobacteria have the capacity to accumulate substantial amounts of triacylglyceride (TAG) as a storage lipid (ranging from 20 to 50% of cell dry weight) under photo-oxidative stress condition or other environmental stress condition and depending on the species/strain, can also produce differ-ent kinds of lipids.
When microalgae are grown in nutrient limited con-dition, it causes a gradual decline in cell division rate; however, the fatty acids biosynthesis is maintained under such conditions [14]. When the cell growth is slow, the synthesis of new compounds stops but the microalgae accumulate fatty acids and TAG and this works as a pro-tective mechanism. In normal growth condition, ATP and NADPH produced during photosynthesis are used for biomass production and ADP and NADP+ are finally made available again for photosynthesis as acceptor mol-ecules. In case, when cell growth and multiplication is impaired due to nutrient deprivation, the pool of NADP+ decrease leading to formation of NADPH which is used for fatty acid biosynthesis (which in turn are stored in TAGs) thus replenishing the pool of NADP+ [14–16]. Nitrogen manipulation plays a critical role for high lipids production [17–22] and is also cost effective compared to other factors. Some microalgae like Chlorella sp., Nan-nochloropsis sp., Neochloris oleoabundans, Botryococ-cus braunii accumulate highest amount of lipids under nitrogen starvation [23] and considered to be one of the best conditions for the enhancement of lipids, SFA and MUFA in microalgae [24]. Nevertheless, nitrogen stress might not always promote lipid induction but can result in change in lipid composition as well with accumula-tion of fatty acids like C16:0, C18:1, C18:2, and C18:3 [25,
26]. Similarly, phosphate limitations have been shown to
induce lipid accumulation mainly as TAGs in Phaeodac-tylum tricornutum, Chaetoceros sp., Isochrysis galbana, and Pavlova lutheri, but decrease in Tetraselmis sp. [15,
27]. In phosphate-deprived medium, C16:0 and C18:1 fatty acid production was enhanced whereas other fatty acids like C18:4ω3, C20:5ω3, and C22:6ω3 decreased [27].
Fatty acid biosynthesis and acetyl‑CoA
The first important committing step in lipid biosynthesis begins with acetyl-CoA carboxylase (ACC). It catalyzes the biotin-dependant carboxylation of acetyl-CoA to form malonyl-CoA. Carbon of all fatty acids is made available from the pool of acetyl-Coenzyme A (CoA) present in the plastid and act as precursor for fatty acid synthesis path-way. The acetyl-Coenzyme A concentration in chloroplast is only 30–50 µM [28] which is enough for the biosynthe-sis of fatty acids. However, the acetyl-CoA pool should remain relatively constant, even when fatty acid synthesis rates vary greatly, depending on light (when synthesis is relatively high) and dark (when synthesis is low). Thus, a system must be there in plastids that quickly produces acetyl-CoA for continuous fatty acid production. There are multiple pathways which are involved in higher lipids production in microalgae and transcriptomics serves as an excellent tool to provide initial, broad idea of car-bon partitioning, and regulation of TAG biosynthesis in microalgae during stress responses [29]. However, the most potential strains identified so far by growth experi-ments and lipid content have not been sequenced and do not have fully annotated genomes [30–34]. Today tran-scriptomic studies are mainly focused on specific micro-algae which have fully sequenced genome compared to oleaginous [35, 36] and a number of genes in central carbon metabolism and TAG biosynthesis pathway have been monitored to know, how cell are adapting in stress environment with changes in molecular level that induce TAG hyperaccumulation [37, 38]. Cronan and Waldrop [37] reported that nitrogen, phosphorous, and iron limi-tation also trigger the increase of accA and accD gene expression level in microalgae [39]. However, studying the lipid content and expression analysis of three genes (involved in carbon fixation and lipids biosynthesis path-way) viz. homomeric/eukaryotic acetyl-CoA carboxylase (acc1 gene), heteromeric/bacterial acetyl-CoA carboxy-lase (ACCase) beta subunit (accD gene), and ribulose 1,5-bisphosphate carboxylase/oxygenase (RuBisCO) large subunit (rbcL gene) in Chlorella Sorokiniana CCTCC M209220 strain found that the expression level of all three genes were increased in stationary phase than logarithmic phase at different glucose concentration (10 g/l).
enabled us to find the catalytic potential of particular enzyme. These three-dimensional modeled structures of protein imitate the interaction of enzyme substrate to provide the catalytic efficiency of enzymes [40, 41]. This progress has occurred due to new methodology to gather large amount of information in sequence and structure database and improved computational descriptions of protein energetics [42]. Metabolic network reconstruc-tion provides avenue to design different metabolic reac-tions to maximize the growth of particular byproduct. Apart from this, metabolic reconstruction also helps to reveal the inhibiting factors [43–48]. Furthermore, there are recent reports on utilizing gene editing, novel plat-form technologies which are quite evident towards devel-oping novel insights about gene expression levels [49, 50].
Methods
Microorganism and experimental design
Five cyanobacterial strains viz. Oscillatoria sp. (SP8), Anabaena sp. (SP12), Anabaena sp. (SP13), Microcoleus sp. (SP18), and Nostoc sp. (SP20) isolated from the soil of different regions of India viz. Tamil Nadu, Haryana, Delhi, Kashmir, and Bihar and conserved in germplasm center at Centre for Conservation and Utilisation of Blue Green Algae, IARI, New Delhi, India were used for the study. The strains were maintained in BG-11 medium [51] in a culture room under cool white fluorescent light intensity of 50–55 μmol photons/m2/s with photoperiod
of 16:8 h light/dark at 28 ± 2 °C. The 14-day-old culture was used as inoculum and a 2% inoculum was used to inoculate the experimental flasks. The cultures were stud-ied for production of total lipids at different incubation periods viz. 7, 14, 21, 28, and 35 days. For stress-related studies, the observations were made after 28 and 35 days of incubation when lipid production was maximum. The cultures were grown in different sets with two differ-ent sets each for five NaNO3 concentrations (3, 6, 9, 12,
and 15 mM) and two different sets each for five K2HPO4
concentrations (0.05, 0.10, 0.15, 0.20, and 0.25 mM) for nitrogen and phosphorous stress, respectively, by sup-plementing in normal media and under normal condi-tions of temperature and light. One set of cultures was removed at the end of each incubation period (28th and 35th days after inoculation) and analyzed for biomass [52] and total lipids [53]. The lipid samples were pro-cessed for preparation of fatty acid methyl esters (FAME) [54] and fatty acid profile for each of the experimental conditions was determined using gas chromatography (Shimadzu GC-2010) as described by [55].
PCR based molecular detection of acetyl‑CoA carboxylase The genomic DNA isolated from the cyanobacterial cul-tures was used as template to amplify Acc carboxylase
gene which is well known for active involvement in fatty acid synthesis pathway and also in biofuel production using gene specific primers with the help of PCR. Two sets of gene specific degenerate primers were designed (SP8-PCR and SP18-PCR) (Additional file 1: Table S1) based on the available gene sequence information in National Center for Biotechnology Information data-base (NCBI) using Integrated DNA Technology (IDT) online tool. The PCR reaction was performed in a total volume of 25 µl having designed primers (10 mM, 0.5 μl each), dNTPs (25 mM, 0.25 μl), MgCl2 (1.25 μl), DNA
polymerase buffer (10x, 2.5 μl), and 1U of Taq Polymer-ase (Merck, USA). Amplification was achieved in an automated thermal-cycler (GeneAmp PCR9700 sys-tem, Applied Biosystems, USA) set for initial denatura-tion (94 °C for 3 min.) followed by 35 cycles comprising of denaturation (95 °C for 1 min.), annealing (56 °C for 1 min.) and extension (72 °C for 45 s) followed by a final extension of 5 min at 72 °C. PCR product was subjected to further purification using QIAquick PCR purification kit protocol (Qiagen, USA) for nucleotide sequencing. Amplicons of sizes 924 and 1142 bp obtained for strains SP8 (Oscillatoria sp.) and SP18 (Microcoleus sp.), respec-tively, (Fig. 3) were sequenced. The obtained nucleotide sequences were analyzed by NCBI-BLAST sequence similarity search and submitted to EMBL-EBI database (Accession No. LN606590 and LN606589) (Additional file 1: Table S2).
RNA isolation and q RT‑PCR based expression profiling of acetyl‑CoA carboxylase
Two selected strains of BGA viz. SP8 (Oscillatoria sp.) and SP18 (Microcoleus sp.) were taken, and 35-day-old culture grown under five different concentrations of K2HPO4 and NaNO3 was used for isolation of total
μl–5 μl); and PCR grade water (3 μl) and reaction was performed in LightCycler® 480 Real-time RT-PCR sys-tem (Roche Diagnostics GmbH, Penzberg, Germany) set for 40 cycles with initial denaturation at 95 °C for 3 min, denaturation at 95 °C for 10 s, annealing temperature at 55 °C for 30 s, extension temperature at 72 °C for 1 s, with an additional melting temperature having ramp from 65 to 95 °C. For endogenous control, constitu-tively expressed 16S-rRNA gene was used as an internal standard to normalize differences between the loading intensity of target and reference gene. The experiments were repeated twice independently, and the fold change data were taken as average. All events were performed according to the manufacturers’ directions. The 2−
ΔΔCT method was used to analyze the fold change in gene expression [56].
Insilico analysis
Gene predictions in SP8 and SP18 sequences were per-formed by FGENESB (http://linux1.softberry.com/) after editing the sequences through BioEdit v.7.2.3 soft-ware [57]. The active site prediction was performed by ScanProsite tool of ExPasy (http://prosite.expasy.org/ cgi-bin/prosite/). Predicted proteins of both sequences SP8 and SP18 were used for 3D modeling and struc-ture prediction. The 3D models were predicted by both ways based on homology and ab initio modeling. The homology-based models were built by SWISS-MODEL (http://swissmodel.expasy.org/) using default param-eters. The 3D models of SP8 and SP18 were generated by ab initio structure prediction method using I-TASSER web-based server (http://zhanglab.ccmb.med.umich. edu/I-TASSER/). The 3D structures and predicted mod-els were visualized using RasMol v.2.7.5.2 (http://www. rasmol.org/) and UCSF Chimera v.1.9 [58] softwares. The later software was also used in the analysis of 3D confor-mational structural comparison between SP8 and SP18 proteins and generation of Ramachandran plot of the proteins. The models were also tested by PDBsum server (http://www.ebi.ac.uk/thornton-srv/databases/pdbsum) to get detailed structural information of SP8 and SP18 proteins. The physicochemical properties of the protein sequences of both genes SP8 and SP18 were calculated using Protparam software ( http://web.expasy.org/prot-param/). The QMEAN server (http://swissmodel.expasy. org/qmean/cgi/index.cgi/) was used to find the overall quality of three-dimensional structure of SP8 and SP18 proteins. The predicted 3D models were subjected for docking with Biotin protein (1C2Q.pdb) retrieved from protein data bank (http://www.rcsb.org/pdb/home/ home.do/). The unbound docking was performed by ZDOCK 3.0server (http://zdock.umassmed.edu/) to check their all possible interactions.
Statistical analyses
The data (in triplicate sets) for the parameters evaluated were subjected to ANOVA (analysis of variance) accord-ing to the experimental design (completely randomized design) using the statistical package MSTAT-C to quan-tify and evaluate the source of variation, and CD (critical differences) values (calculated at P level of 0.05). Alpha-betical superscripts in tables denote ranking in descend-ing order, i.e., a denotes the highest value accorddescend-ing to Duncan’s multiple range test (DMRT) and similarity matrix. For studying the similarity/dissimilarity between the cyanobacterial strains, cluster analysis was performed using SAS 9.3. The Dendrogram was constructed using unweighted pair-group method using arithmetic aver-ages (UPGMA) based on Euclidean distance. Three basic statements were used. viz. PROC DISTANCE (to calcu-late the distance matrix between species), PROC CLUS-TER (to calculate the clusters) and PROC TREE (to draw the dendrogram).
Molecular dynamic simulation
The simulation was executed with GROMACS v. 4.5 package with the force field as Gromos43a1. The PRODRG server was used to prepare the necessary coor-dinate and topological files with GROMACS compatibil-ity. The ligand and protein salvation was executed with SPC water model in a cubic box (10.8 × 10.8 × 10.8 nm3).
Here, the Counter-ion (1 Cl−) was included to counter-balance the solvated system. With the aim to guarantee that there are negligible steric clashes or improper geom-etry in such solvated system of protein–ligand complex, it was processed for energy minimization using the steepest algorithm up to a maximum 25,000 steps or until the maximum force (Fmax) is not greater than 1000 kJ/ mol nm which is the default threshold. The quantity of steps necessitated to reach minimization criteria were scrutinized to be around 400 for such complex. This step was performed after the equilibration of the com-plete system by means of both NVT/ and NPT ensem-bles for 50,000 steps (100 ps) at 300 K and 1 atm. Here, the system was firstly equilibrated using NVT ensemble followed by NPT ensemble. After this equilibration pro-cess, the molecular dynamics simulation was carried out for 2 ns long. Finally, the simulations were evaluated, and RMSD, RMSF, and hydrogen bonds plots were calculated for complete episode of simulations.
Results and discussion Total lipids
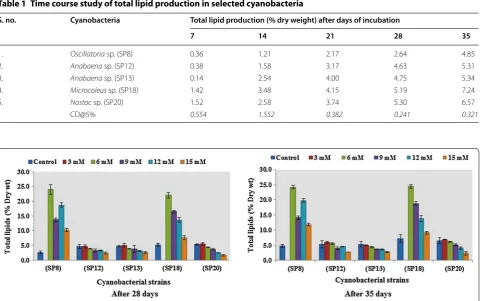
weight percentage (Table 1). Maximum amount of lipids was accumulated at 35 days which was a gradual increase from day 7 till the end of incubation. Total lipids produc-tion in all the isolates varied and ranged from a lowest of 0.14% in Anabaena sp. (SP13) to the maximum of 7.24% in Microcoleus sp. (SP18).
To investigate the effect of varied nitrogen and phos-phorus concentrations on total lipids production, the biomass and lipid accumulation was evaluated after 28 and 35 days duration (Figs. 1, 2). It was very interest-ing to note that Oscillatoria sp. (SP8) and Microcoleus sp. (SP18) which did not survive at lower nitrogen con-centration of 3 mM showed maximum fold increase in total lipid accumulation when grown at 6 mM nitrogen. All other cultures showed variable level of total lipids at different N concentration. Total lipids showed the increasing trend from 10.2 to 23.9%, 2.46 to 4.62%, 2.52 to 5.10%, 7.67 to 22.2%, and 1.63 to 5.57% at 28 days of incubation and 11.8 to 24.2%, 2.73 to 5.98%, 2.83 to 5.03%, 9.14 to 26.8%, and 2.37 to 6.89% at 35 days in Oscillatoria sp. (SP8), Anabaena sp. (SP12), Anabaena sp. (SP13), Microcoleus sp. (SP18), and Nostoc sp. (SP20), respectively. Microcoleus sp. (SP18) and Oscillatoria sp. (SP8) recorded highest lipid accumulation under 6 mM
nitrogen. Maximum percentage increase of 26.8% in lipid production was achieved in Microcoleus sp. (SP18) at 6 mM nitrogen concentration after 35 days of incubation (Fig. 1). Lipid accumulation in cyanobacterial strains at different levels of phosphorus viz. 0.05, 0.10, 0.15, 0.20, and 0.25 mM increased by varied amounts as compared to control i.e., from 4.49 to 12.5%, 4.99 to 11.1%, 4.70 to 8.19%, 7.94 to 15.2%, and 7.32 to 11.8% at 28 days of incu-bation and 5.67 to 15.9%, 3.17 to 10.0%, 5.71 to 8.85%, 9.73 to 17.7%, and 7.53 to 13.2% at 35 days of incubation in Oscillatoria sp. (SP8), Anabaena sp. (SP12), Anabaena sp. (SP13), Microcoleus sp. (SP18), and Nostoc sp. (SP20), respectively. Maximum lipid productivity increase of 153% was again shown by Microcoleus sp. (SP18) at 0.20 mM phosphate concentration after 35 days of incu-bation (Fig. 2). Consistent with a number of studies, the modulation of N and P nutrition resulted in increase in total lipid accumulation [31, 38, 59]. However, the cur-rent literature provides fragmented information regard-ing the strategies for lipid production improvement, the one that is most commonly applied is the design of nutri-ents viz. nitrogen, phosphorus, and sulfur starvation or limitation. Ito et al. [60] reported that under nitrogen stress conditions, the quantities of neutral lipids in micro
Table 1 Time course study of total lipid production in selected cyanobacteria
S. no. Cyanobacteria Total lipid production (% dry weight) after days of incubation
7 14 21 28 35
1. Oscillatoria sp. (SP8) 0.36 1.21 2.17 2.64 4.85
2. Anabaena sp. (SP12) 0.38 1.58 3.17 4.63 5.31
3. Anabaena sp. (SP13) 0.14 2.54 4.00 4.75 5.34
4. Microcoleus sp. (SP18) 1.42 3.48 4.15 5.19 7.24
5. Nostoc sp. (SP20) 1.52 2.58 3.74 5.30 6.57
CD@5% 0.554 1.552 0.382 0.241 0.321
algal cells were greatly increased, while amino acids were significantly reduced to 1/20 of the amount or even less. Mandal et al. [61] cultivated the microalgae Scenedesmus obliquus under phosphorus starvation and witnessed a lipid content increase from 10.0 to 29.5%. Temperature modulation along with nutrient stress is another strat-egy which not only enhances lipid productivity but also affects the composition of lipids produced. With nitrogen deprivation, the total and neutral lipids increased with increasing temperature, and the highest lipid content of 47.60% of cell dry weight and the highest TAG content of 79.66% of total lipid was achieved at 33 °C. Thus, high temperature induced carbon flux from starch towards TAG accumulation in microalgae during nitrogen star-vation and further reduced the degree of the fatty acid unsaturation and favored a better biodiesel production [62].
It is of particular significance in large scale microalgal lipid production processes suggesting that nitrogen and phosphorus starvation strategy is most favorable for lipid productivity.
Expression study
For molecular detection of Acc carboxylase gene, PCR amplification was performed using two distinct sets of designed degenerate primers (SP8-PCR and SP18-PCR) (Additional file 1: Table S1) and amplicons of sizes 924 and 1142 bp obtained for strains SP8 (Oscillatoria sp.) and SP18 (Microcoleus sp.), respectively, (Additional file 1: Figure S1) were sequenced. The obtained nucleo-tide sequences were analyzed by NCBI-BLAST sequence similarity search and submitted to EMBL-EBI database (Accession No. LN606590 and LN606589) (Additional file 1: Table S2). The sequence obtained from SP8 showed similarity with Oscillatoria acuminate PCC 6304 chro-mosome (complete genome) with percent identity of 72%
and query coverage up to 56%, whereas the sequence generated from SP18 displayed maximum similarity with Microcoleus sp. PCC 7113 chromosome (complete genome) with identity percentage of 73 and query cover-age up to 47%. In both cases, the results were found to be exactly similar with the cyanobacterial strains which were initially taken for molecular studies.
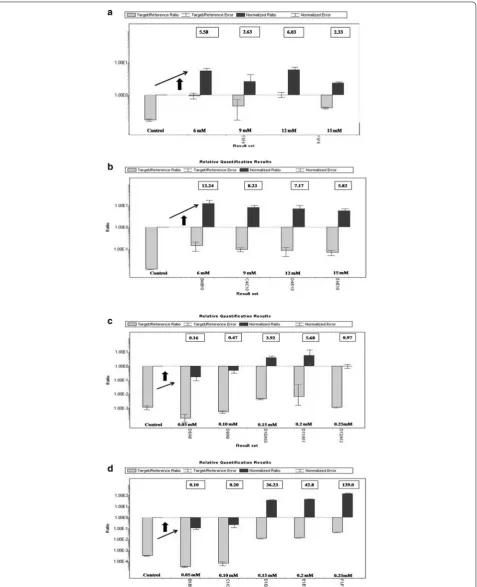
The expression levels of acetyl-CoA carboxylase gene in Oscillatoria sp. and Microcoleus sp. were studied under five limited doses of nitrogen and phosphorus using real-time PCR during stationary phase of their growth (Fig. 3). The overall expression of the Acc carboxylase gene related to lipid synthesis in Oscillatoria sp. and Microcoleus sp. was found to be upregulated for all lim-ited nitrogen stress conditions. In contrast, expression levels of this gene under limited phosphorus stress con-ditions were differentially regulated with a combination of positive and negative induction. However, the level of gene expression could not be determined under very lim-iting nitrogen stress condition with a lowest concentra-tion of 3 mM since at that level the algal cultures failed to survive. This is due to the fact that nitrogen is a basic nutritional source for BGA growth and multiplication and is required with a minimum threshold limit.
The effect of nitrogen limited condition on gene expression in Oscillatoria sp. is quite interesting which has shown a variable range of positive induction with a gradual increase of NaNO3 supply. Initially after
imme-diate increase of NaNO3 concentration from 3 to 6 mM,
activation of this enzyme, carboxylase gene product might have accumulated in sufficient amounts to neces-sitate the switching off of the gene and a continuous increase of nitrogen in the metabolic system further accelerated gene activity gaining induction up to 6.03-fold from near to ground level (FC-2.63) under 12 mM concentration of NaNO3. The expression of Acc
carbox-ylase finally downregulated to 2.33-fold at the terminal point of highest nitrogen abundant condition (Fig. 3). The overall expression pattern of the gene in Oscillatoria sp. showed zigzag type model and it could be possibly explained by the reasoning that most gene expression is dynamic in nature which is not expected to be upregu-lated in all points of factor. Wan et al. [39] also reported a similar type of expression behavior of this gene under nitrogen stress condition in Chlorella sorokiniana. On the other hand, the gene expression pattern in Microco-leus sp. under nitrogen stress condition was consider-ably different than in Oscillatoria sp. showing a gradual step down of induction as the NaNO3 concentration
changed from lower to upper limit. At initial supply of NaNO3 (6 mM), the gene instantly got upregulated
and its expression increased up to 12.24 in terms of FC (Fig. 3) which represents the highest level of stimula-tion of the gene product under nitrogen stress condi-tion as per conducted study, thereby confirming that the enzyme is solely involved and catalyzed maximum fatty acid biosynthesis reaction under lower limit of nitrogen supply. As the nutrient concentration is proportion-ately increased from 6 mM up to 15 mM, the expression level continuously decreased to a final value of 5.82-fold (Fig. 3). Overall, the enzyme performed better under limited nitrogen condition in Microcoleus sp. than in Oscillatoria sp., Huerlimann et al. [63] while studying the effect of nitrogen limitation on Accase expression reported its significant upregulation during nitrogen starvation and culture age in Chromera velia, whereas it was not differentially expressed in Isochrysis aff. gal-bana (TISO) but got upregulated during the logarithmic phase of nitrogen replete cultures. The study concluded that Accase changed with nutrient status and culture age in a species specific manner and nitrogen limitation did not always result in fatty acids accumulation [63]. The overall expression pattern of Acetyl-CoA carboxylase (ACCase) actively involved in the fatty acid biosynthetic pathway might be controlled by the individual regula-tion behavior of its three subunits viz. accA, accD, and bccp [64]. Therefore, it is quite possible that the acc gene expression outline is not only inclining under nitrogen stress gradient but sometimes do not follow a specific up- or downregulation pattern under various salinity stress conditions in oleaginous culture [65].
The effect of phosphorus concentration on Acc car-boxylase gene expression is quite different from nitrogen and it was a combination of positive and negative regu-lation of gene function under variable ranges of stress points of K2HPO4 supply. When the phosphorus stress
was imposed with limited quantity in Oscillatoria sp., the gene is slightly downregulated with a fold change of 0.16 at initial concentration of K2HPO4 (0.05 mM). As
the phosphorus availability is gradually increased, the induction of the gene is turning from negative to posi-tive with a steady enhancement viz. 0.47, 3.92, and 5.68 (Fig. 3). However, at highest concentration of K2HPO4
stationary phase of both algal species is directly associ-ated with the high expression of the said gene and that is equally important for accumulation and synthesis of lipids. Several studies on relative quantification of Acc carboxylase gene affirmed that stationary phase is more promising than log (exponential) phase in terms of higher gene expression. The relative expression of accD gene in Chlorella sorokiniana under nitrogen deprivation condi-tions suggested that the gene induction level was low in log phase in all the cultures [39]. Similar results were also found in another study where effects of mixotrophy were correlated with microalgal growth, lipid production, as well as expression of three pathway genes including accD gene [68]. This could be a superior indicator of lipid con-tent under nutrient deficient conditions [39, 68].
In silico analysis
Gene prediction and docking
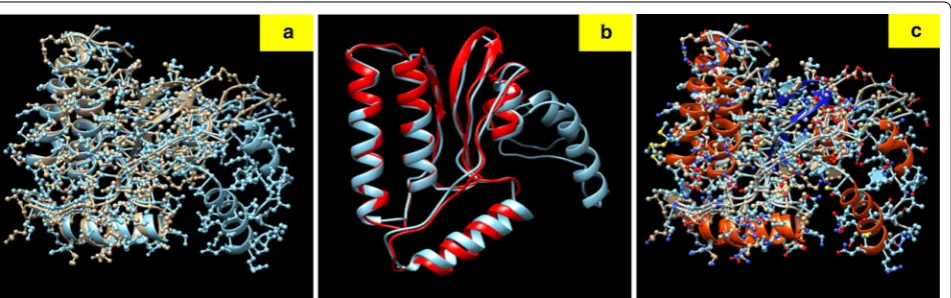
Predicted SP18 gene (456 bp) from Microcoleus sp. was smaller than SP8 gene (585 bp) from Oscillatoria sp. and both the genes were found to be full-length genes. Acetyl-Coenzyme A carboxyl transferase domain at N-terminal region (COA_CT_NTER) identified as an active site in both the proteins. Except first 44 amino acids, SP8 protein (45–194 aa) showed the COA_CT_ NTER active site (score = 13.021), whereas in SP18 pro-tein, the active site (score = 12.196) displayed from 1 to 151 aa. For three-dimensional (3D) structure model, both the proteins (SP8 and SP18) were submitted for ab initio as well as homology-based modeling (Additional file 1: Figures S2–S4). The obtained 3D structure of SP8 pro-tein (21.8 kDa) showed only six alpha helices. While SP18 protein (16.7 kDa) exhibited four alpha helices and four beta sheets (Fig. 4). There was no beta sheet present in the 3D structure of the SP8 protein.
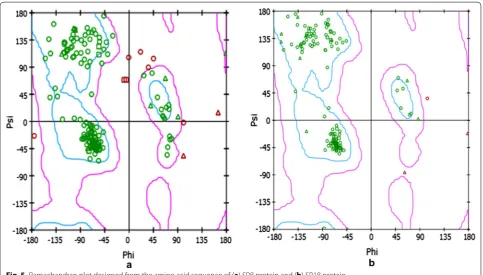
To compare both proteins i.e., SP8 and SP18 at the structural level, the SP18 protein was found more stable than SP8 protein with the occurrence of beta sheets in its secondary structure (Fig. 4). The physicochemical prop-erties of the protein sequences of both genes, SP8 and SP18 were calculated and the amino acid compositions of the proteins are given in Additional file 1: Tables S3– S6. In this analysis, the instability index was computed for both SP8 and SP18 proteins. The instability index of SP8 and SP18 proteins was 37.21 and 30.47, respectively. They were classified as a stable protein by the software. In this analysis, similar trend was observed stating that SP18 protein is more stable than SP8 protein because it has lower instability index value than that of SP8 pro-tein. The phi(φ)/psi(ψ) angles of the amino acid residues observed in Ramachandran plot analysis has shown that both proteins, SP8 and SP18, were highly stable and having more than 90% amino acids in allowed regions (Fig. 5). The allowed amino acid residues in this plot were 95.87% for SP8 protein and 98.67% for SP18 protein. The QMEAN server used to find the overall quality of three-dimensional structure of SP8 and SP18 proteins and the QMEAN score of SP8 and SP18 displayed was 0.535 and 0.464, respectively.
The QMEAN score gives a combined score of six dif-ferent parameter viz., C_beta interaction energy, all-atom pairwise energy, solvation energy, torsion angle energy, secondary structure agreement, and solvent accessibil-ity agreement. The estimated model reliabilaccessibil-ity was in the range between 0 and 1 and they were considered as reliable 3D conformational structure. The docking results of protein–protein interaction (SP8-1C2Q; SP18-1C2Q) were obtained in the ZDOCK score. The highest ZDOCK score for a particular protein–protein binding is considered as the highest rank for their first interacting
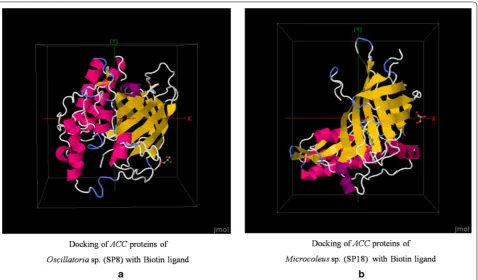
complex. This scoring function includes shape comple-mentarity, electrostatics, and a pair wise atomic statis-tical potential developed using contact propensities of transient protein complexes. In our analysis, the highest ZDOCK score obtained was 1324.398 for SP8-1C2Q and 1217.939 for SP18-1C2Q. Here the protein binding affin-ity shown with biotin was more in case of SP8 protein than SP18 protein (Figs. 6, 7). Although the stability of
SP18 protein is higher than SP8, affinity of SP18 towards Biotin is lesser than SP8. This might be due to the higher accessible vertices present in SP8 (72.81) than present in case of SP18 (63.75). The predicted local error of SP18 structure model for first 50 amino acids is higher than SP8 structure model and this might be another possi-ble reason for their varying interacting affinity towards biotin.
Fig. 5 Ramachandran plot designed from the amino acid sequence of (a) SP8 protein and (b) SP18 protein
Molecular dynamics simulation
The energy minimization of ligand-bound protein com-plexes was analyzed after simulations were carried out for stabilizing the same. The protein deviated about 1 Å in the first ns and then acquired a stable conformation for the rest of trajectory. RMSF per residue and Hydro-gen bonds throughout simulations between protein and ligand has been calculated. A nominal change in the hydrogen bond formation between ligand and protein was observed (Fig. 8). Thus, the complex was stable for most part of the simulation trajectory. Also, root mean squared fluctuation (RMSF) is the time-average of root mean squared deviation (RMSD) for each residue (Fig. 9). In most cases, residues lying in the core protein regions have low RMSF while exposed loops have high RMSF val-ues. As observed, the peaks in the graph possess a value between 0.2 and 0.4 nm. Both these results indicate that the ligand-bound protein complexes were stable through-out MD simulations and thus ligands possess the ability to stably bind to protein.
Conclusion
The study revealed a time-dependent accumulation of lipids in selected cyanobacteria showing increase with increase in incubation time. The changes in the lipid content and the acetyl-Co A carboxylase (accD) gene
expression under nitrogen/phosphorus limitation could be correlated and provide an insight into the regulation of genes involved in lipid production pathway. The pre-dicted 3D structure of the proteins confirmed goodness of the built model and the Instability index (Ii) of less than 40 indicated that the proteins are stable. This has been further confirmed as the ligand-bound proteins were stable throughout MD simulations. The ligand and Fig. 7 Docking of predicted 3D models. a Docking of ACC proteins of Oscillatoria sp. (SP8) and b Docking of ACC proteins of Microcoleus sp. (SP18) subjected with Biotin ligand protein
protein were forming h-bond which indicated an effec-tive binding. This indicated that these cyanobacteria may be stable and could be utilized for algal biofuel produc-tion on large scale.
Abbreviations
FAME: fatty acid methyl esters; ACC: CoA carboxylase; CoA: acetyl-Coenzyme; TAG: triacylglyceride; ATP: adenosine triphosphate; NADPH: nicotinamide adenine dinucleotide phosphate; ADP: adenosine 5′ -diphos-phate; NADP+: nicotinamide adenine dinucleotide phosphate; SFA: saturated fatty acid; MUFA: mono unsaturated fatty acid; BGA: blue green algae; mM: milliMolar; DNA: deoxyribonucleic acid; RNA: ribonucleic acid; rRNA: ribosomal ribonucleic acid; cDNA: complementary DNA; PCR: polymerase chain reac-tion; q RT-PCR: quantitative-real-time-reverse transcription polymerase chain reaction; 3D: three-dimensional; ANOVA: analysis of variance; CD: critical differ-ences; DMRT: Duncan’s multiple range test.
Authors’ contributions
RK performed all experiments, analyzed the data. KB designed molecular experiment and analyses, PKS performed the bioinformatics analysis, PKS was involved in molecular dynamics simulation study, and SP supervised the study. SE and SP contributed to data analysis. SP and PS conceptualized, rewritten, edited the manuscript. All authors read and approved the final manuscript.
Author details
1 Centre for Conservation and Utilisation of Blue Green Algae,
Divi-sion of Microbiology, ICAR-Indian Agricultural Research Institute, New Delhi 110012, India. 2 Department of Plant Biology and Biotechnology,
Additional file
Additional file 1: Table S1. Primers used for gene specific amplification and quantitative real time PCR analysis of Acetyl-CoA carboxylase (accD) gene (Y = C/T, R = A/G, N = A/T/G/C, H = A/C/T, W = A/T, D = A/G/T).
Table S2. Relationship of accD gene of test organism as done by BLAST search results and the accession numbers. Table S3. ProtParam analysis for fetching the physicochemical parameters of predicted protein of Oscil-latoria sp. (SP8). Table S4. Secondary structural features of SP8 protein.
Table S5. ProtParam analysis for fetching the physicochemical parameters of predicted protein of Microcoleus sp. (SP18). Table S6. Secondary struc-tural features of SP18 protein. Figure S1. Amplification of accD gene in SP8 and SP18. Figure S2. protein structure of Oscillatoria sp. (SP8). Figure S3. protein structure of Microcoleus sp. (SP18).
Presidency College, Chennai 600005, India. 3 Department of Biotechnology,
Shri JJT University, Jhunjhunu, Rajasthan 333001, India. 4 Enzyme Technology
and Protein Bioinformatics Laboratory, Department of Microbiology, Maharshi Dayanand University, Rohtak, Haryana 124001, India. 5 ICAR-National Research
Centre on Plant Biotechnology (NRCPB), New Delhi 110012, India.
Acknowledgements
The authors are thankful to ICAR-Indian Agricultural Research Institute (IARI), New Delhi, India and Department of Plant Biology and Biotechnology, Presi-dency College, Chennai, India for providing necessary facilities. PS acknowl-edges the support from major research project, UGC, New Delhi [42-457/2013 (SR)].
Competing interests
The authors declare that they have no competing interests.
Availability of data and materials
This research paper has cited the relevant references as necessary. Supporting tables and figures analyzed during this study are included in this published article and its supplementary information files.
Consent for publication
This research paper does not contain any individual’s personal data in any form.
Ethics approval and consent to participate
This research article does not contain any studies with human participants or animals performed by any of the authors.
Funding
SP acknowledges Department of Biotechnology, Govt. of India for providing funding. PS acknowledges UGC, New Delhi, India for financial support for UGC MRP [F. No. 42-457/2013 (SR)].
Publisher’s Note
Springer Nature remains neutral with regard to jurisdictional claims in pub-lished maps and institutional affiliations.
Received: 23 November 2016 Accepted: 5 April 2017
References
1. Lang X, Dalai AK, Bakhshi NN, Reaney MJ, Hertz PB. Preparation and characterization of bio-diesels from various bio-oils. Bioresour Technol. 2001;8:53–62.
2. Montefrio MJ, Xinwen T, Obbard JP. Recovery and pre-treatment of fats, oil and grease from grease interceptors for biodiesel production. Appl Energy. 2010;87:3155–61.
3. Alcantara R, Amores J, Canoira LT, Fidalgo E, Franco MJ, Navarro A. Cata-lytic production of biodiesel from soy-bean oil, used frying oil and tallow. Biomass Bioenergy. 2000;18:515–27.
4. Becker K, Francis G. Biodiesel from Jatropha plantations on degraded land. A brief technical report. University of Hohenheim, Stuttgrart. 2002. 5. Ghadge SV, Raheman H. Biodiesel production from mahua (
Mad-huca indica) oil having high free fatty acids. Biomass Bioenergy. 2005;28(6):601–5.
6. Banerjee C, Ghosh S, Sen G, Mishra S, Shukla P, Bandopadhyay R. Study of algal biomass harvesting using cationic guar gum from the natural plant source as flocculant. Carbohydr Polym. 2013;92(1):675–81.
7. Banerjee C, Ghosh S, Sen G, Mishra S, Shukla P, Bandopadhyay R. Study of algal biomass harvesting through cationic cassia gum, a natural plant based biopolymer. Bioresour Technol. 2014;31(151):6–11.
8. Banerjee C, Singh PK, Shukla P. Microalgal bioengineering for sustainable energy development: recent transgenesis and metabolic engineering strategies. Biotechnol J. 2016;11(3):303–14.
Hameed S editor. Contemporary issues in biotechnology: progress and applications. Astral International. 2015.
10. Banerjee C, Bandopadhyay R, Singh PK, Agrawal HK, Shukla P. Innovations in microalgal harvesting using biopolymer-based approach. In: Microbial Factories. Berlin: Springer; 2015. pp. 127–38.
11. Imam J, Singh PK, Shukla P. Biohydrogen as biofuel: future prospects and avenues for improvements. In: Biofuel technologies. Berlin: Springer; 2013. pp. 301–15.
12. Banerjee C, Bandopadhyay R, Shukla P. A simple novel agar diffusion method for isolation of indigenous microalgae Chlamydomonas sp. CRP7 and Chlorella sp. CB4 from operational swampy top soil. Indian J Micro-biol. 2012;52(4):710–2.
13. Banerjee C, Gupta P, Mishra S, Sen G, Shukla P, Bandopadhyay R. Study of polyacrylamide grafted starch based algal flocculation towards applica-tions in algal biomass harvesting. Int J Biol Macromol. 2012;51(4):456–61. 14. Thompson GA. Lipids and membrane function in green algae. Biochim
Biophys Acta. 1996;1302(1):17–45.
15. Sharma KK, Schuhmann H, Schenk PM. High lipid induction in microalgae for biodiesel production. Energies. 2012;5(5):1532–53.
16. Hu Q, Sommerfeld M, Jarvis E, Ghirardi M, Posewitz M, Seibert M, Darzins A. Microalgal triacylglycerols as feedstocks for biofuel production: per-spectives and advances. Plant J. 2008;54(4):621–39.
17. Takagi M, Watanabe K, Yamaberi K, Yoshida T. Limited feeding of potas-sium nitrate for intracellular lipid and triglyceride accumulation of Nan-nochloris sp. UTEX LB1999. Appl Microbiol Biotechnol. 2000;54(1):112–7. 18. Liu ZY, Wang GC, Zhou BC. Effect of iron on growth and lipid
accumula-tion in Chlorella vulgaris. Bioresour Technol. 2008;99(11):4717–22. 19. Xiong W, Li X, Xiang J, Wu Q. High-density fermentation of microalga
Chlorella protothecoides in bioreactor for microbio-diesel production. Appl Microbiol Biotechnol. 2008;78(1):29–36.
20. Xu J, Cho H, O’Malley S, Park JH, Clarke SD. Dietary polyunsaturated fats regulate rat liver sterol regulatory element binding proteins-1 and-2 in three distinct stages and by different mechanisms. J Nutr. 2002;132(11):3333–9.
21. Tornabene TG, Holzer G, Lien S, Burris N. Lipid composition of the nitro-gen starved green alga Neochloris oleoabundans. Enzyme Microb Technol. 1983;5(6):435–40.
22. Li Y, Qin JG. Comparison of growth and lipid content in three Botryococ-cus braunii strains. J Appl Phycol. 2005;17(6):551–6.
23. Metzger P, Largeau C. Botryococcus braunii: a rich source for hydrocarbons and related ether lipids. Appl Microbiol Biotechnol. 2005;66(5):486–96. 24. Olofsson M, Lamela T, Nilsson E, Berge JP, Del Pino V, Uronen P, Legrand
C. Combined effects of nitrogen concentration and seasonal changes on the production of lipids in Nannochloropsis oculata. Mar Drugs. 2014;12(4):1891–910.
25. Tang D, Han W, Li P, Miao X, Zhong J. CO2 biofixation and fatty acid
com-position of Scenedesmus obliquus and Chlorella pyrenoidosa in response to different CO2 levels. Bioresour Technol. 2011;102(3):3071–6.
26. Rodolfi L, Chini Zittelli G, Bassi N, Padovani G, Biondi N, Bonini G, Tredici MR. Microalgae for oil: strain selection, induction of lipid synthesis and outdoor mass cultivation in a low-cost photobioreactor. Biotechnol Bioeng. 2009;102(1):100–12.
27. Reitan KI, Rainuzzo JR, Olsen Y. Effect of nutrient limitation on fatty acid and lipid content of marine microalgae1. J Phycol. 1994;30(6):972–9. 28. Post-Beittenmiller D, Roughan G, Ohlrogge JB. Regulation of plant fatty
acid biosynthesis analysis of acyl-coenzyme A and acyl-acyl carrier protein substrate pools in spinach and pea chloroplasts. Plant Physiol. 1992;100(2):923–30.
29. Bourgis F, Kilaru A, Cao X, Ngando-Ebongue GF, Drira N, Ohlrogge JB, Arondel V. Comparative transcriptome and metabolite analysis of oil palm and date palm mesocarp that differ dramatically in carbon partitioning. Proc Natl Acad Sci. 2011;108(30):12527–32.
30. Griffiths MJ, Harrison ST. Lipid productivity as a key characteristic for choosing algal species for biodiesel production. J Appl Phycol. 2009;21(5):493–507.
31. Li Y, Horsman M, Wang B, Wu N, Lan CQ. Effects of nitrogen sources on cell growth and lipid accumulation of green alga Neochloris oleoabun-dans. Appl Microbiol Biotechnol. 2008;81(4):629–36.
32. Guarnieri MT, Nag A, Smolinski SL, Darzins A, Seibert M, Pienkos PT. Examination of triacylglycerol biosynthetic pathways via de novo
transcriptomic and proteomic analyses in an unsequenced microalga. PLoS ONE. 2011;6(10):e25851.
33. Rismani-Yazdi H, Haznedaroglu BZ, Bibby K, Peccia J. Transcriptome sequencing and annotation of the microalgae Dunaliella tertiolecta: path-way description and gene discovery for production of next-generation biofuels. BMC Genom. 2011;12(1):1.
34. Radakovits R, Jinkerson RE, Darzins A, Posewitz MC. Genetic engineering of algae for enhanced biofuel production. Eukaryot Cell. 2010;9:486–501. 35. Miller R, Wu G, Deshpande RR, Vieler A, Gärtner K, Li X, Moellering ER,
Zäuner S, Cornish AJ, Liu B, Bullard B. Changes in transcript abundance in Chlamydomonas reinhardtii following nitrogen deprivation predict diver-sion of metabolism. Plant Physiol. 2010;154(4):1737–52.
36. Gonzalez-Ballester D, Casero D, Cokus S, Pellegrini M, Merchant SS, Grossman AR. RNA-seq analysis of sulfur-deprived Chlamydomonas cells reveals aspects of acclimation critical for cell survival. Plant Cell. 2010;22(6):2058–84.
37. Cronan JE, Waldrop GL. Multi-subunit acetyl-CoA carboxylases. Prog Lipid Res. 2002;41(5):407–35.
38. Fan J, Cui Y, Wan M, Wang W, Li Y. Lipid accumulation and biosynthesis genes response of the oleaginous Chlorella pyrenoidosa under three nutrition stressors. Biotechnol Biofuels. 2014;7(1):1.
39. Wan M, Liu P, Xia J, Rosenberg JN, Oyler GA, Betenbaugh MJ, Nie Z, Qiu G. The effect of mixotrophy on microalgal growth, lipid content, and expression levels of three pathway genes in Chlorella sorokiniana. Appl Microbiol Biotechnol. 2011;91(3):835–44.
40. Singh PK, Joseph J, Goyal S, Grover A, Shukla P. Functional analysis of the binding model of microbial inulinases using docking and molecular dynamics simulation. J Mol Model. 2016;22(4):1–7.
41. Baweja M, Tiwari R, Singh PK, Nain L, Shukla P. An alkaline protease from Bacillus pumilus MP 27: functional analysis of its binding model toward its applications as detergent additive. Front Microbiol. 2016;7.
42. Petrey D, Honig B. Protein structure prediction: inroads to biology. Mol Cell. 2005;20(6):811–9.
43. Shastri AA, Morgan JA. Flux balance analysis of photoautotrophic metabolism. Biotechnol Prog. 2005;21(6):1617–26.
44. Knoop H, Zilliges Y, Lockau W, Steuer R. The metabolic network of Syn-echocystis sp. PCC 6803: systemic properties of autotrophic growth. Plant Physiol. 2010;154(1):410–22.
45. De Oliveira Dal’Molin CG, Quek LE, Palfreyman RW, Nielsen LK. AlgaGEM– a genome-scale metabolic reconstruction of algae based on the Chla-mydomonas reinhardtii genome. BMC Genom. 2011;12(4):1. 46. Yoshikawa K, Kojima Y, Nakajima T, Furusawa C, Hirasawa T, Shimizu H.
Reconstruction and verification of a genome-scale metabolic model for Synechocystis sp. PCC6803. Appl Microbiol Biotechnol. 2011;92(2):347–58. 47. Wang B, Wang J, Zhang W, Meldrum DR. Application of synthetic biology
in cyanobacteria and algae. Front Microbiol. 2012;3:1–15.
48. Banerjee C, Dubey KK, Shukla P. Metabolic engineering of microalgal based biofuel production: prospects and challenges. Front Microbiol. 2016;7.
49. Gupta SK, Shukla P. Advanced technologies for improved expression of recombinant proteins in bacteria: perspectives and applications. Crit Rev Biotechnol. 2015;36(6):1089–98.
50. Gupta SK, Shukla P. Gene editing for cell engineering: trends and applica-tions. Crit Rev Biotechnol. 2016;1–3. doi:10.1080/07388551.2016.1214557. 51. Stanier RY, Kunisawa R, Mandel M, Cohen-Bazire G. Purification and prop-erties of unicellular blue-green algae (order Chroococcales). Bacteriol Rev. 1971;35(2):171.
52. Richmond A, Grobbelaar JU. Factors affecting the output rate of Spirulina platensis with reference to mass cultivation. Biomass. 1986;10:253–64. 53. Snyder F, Stephens N. A simplified spectrophotometric determination of
ester groups in lipids. Biochem Biophys Acta. 1959;34:244–5.
54. Metcalfe LD, Schmitz AA, Pelka JR. Rapid preparation of fatty acid esters from lipids for gas chromatographic analysis. Anal Chem. 1996;38:514–5. 55. Bhakar RN, Kumar R, Pabbi S. Total lipids and fatty acid profile of different
Spirulina strains as affected by salinity and incubation time. Vegetos. 2013;26(2s):148–54.
• We accept pre-submission inquiries
• Our selector tool helps you to find the most relevant journal
• We provide round the clock customer support
• Convenient online submission
• Thorough peer review
• Inclusion in PubMed and all major indexing services • Maximum visibility for your research
Submit your manuscript at www.biomedcentral.com/submit
Submit your next manuscript to BioMed Central
and we will help you at every step:
57. Hall TA. BioEdit: a user-friendly biological sequence alignment editor and analysis program for Windows 95/98/NT. In: Nucleic acids symposium series. 1999; 41: 95–98.
58. Pettersen EF, Goddard TD, Huang CC, Couch GS, Greenblatt DM, Meng EC, Ferrin TE. UCSF Chimera—a visualization system for exploratory research and analysis. J Comput Chem. 2004;25(13):1605–12.
59. Illman AM, Scragg AH, Shales SW. Increase in Chlorella strain calorific values when grown in low nitrogen medium. Enzyme Microb Technol. 2000;27:631–5.
60. Ito T, Tanaka M, Shinkawa H. Metabolic and morphological changes of an oil accumulating trebouxiophycean alga in nitrogen-deficient conditions. Metabolomics. 2013;9(1):178–87.
61. Mandal S, Mallick N. Microalga Scenedesmus obliquus as a potential source for biodiesel production. Appl Microbiol Biotechnol. 2009;84(2):281–91. 62. Xia L, Song S, Hu C. High temperature enhances lipid
accumula-tion in nitrogen-deprived Scenedesmus obtusus XJ-15. J Appl Phycol. 2016;28:831–7.
63. Huerlimann R, Steinig EJ, Loxton H, Zenger KR, Jerry DR, Heimann K. The effect of nitrogen limitation on acetyl-CoA carboxylase expression and fatty acid content in Chromera velia and Isochrysis aff. galbana (TISO). Gene. 2014;543(2):204–11.
64. Fan J, Cui Y, Wan M, Wang W, Li Y. Lipid accumulation and biosynthesis genes response of the oleaginous Chlorella pyrenoidosa under three nutrition stressors. Biotechnol Biofuels. 2014;7(1):17.
65. Cheng RL, Feng J, Zhang BX, Huang Y, Cheng J, Zhang CX. Transcriptome and gene expression analysis of an oleaginous diatom under different salinity conditions. BioEnergy Res. 2014;7(1):192–205.
66. Adenan NS, Yusoff FM, Medipally SR, Shariff M. Enhancement of lipid pro-duction in two marine microalgae under different levels of nitrogen and phosphorus deficiency. J Environ Biol. 2016;37:669–76 (Special issue). 67. Reistetter EN, Krumhardt K, Callnan K, Roache-Johnson K, Saunders JK, Moore LR, Rocap G. Effects of phosphorus starvation versus limitation on the marine cyanobacterium Prochlorococcus MED4 II: gene expression. Environ Microbiol. 2013;15:2129–43.