R E S E A R C H
Open Access
A rapid assessment method for determination of
iodate in table salt samples
Preeti S Kulkarni
1*, Satish D Dhar
2and Sunil D Kulkarni
3Abstract
Background:In the present work, a simple and rapid method for determination of iodate is described.
Methods:Iodometric reaction between iodate, excess iodide, and acid has been used, and the iodine liberated is allowed to react with variamine blue (VB) dye in the presence of sodium acetate to yield a violet-colored species. Results:A calibration curve was obtained in the concentration range of 2 to 30μg of iodate in a final equilibration volume of 10 mL. The effect of different interfering anions on determination of iodate was also studied.
Conclusions:The developed method was applied to iodate determination in various iodized salt samples obtained from local markets in and around Pune city, India. The amount of iodate in various table salt samples was in the range of 10 to 25 ppm.
Keywords:Iodate; Table salt; Variamine blue dye; Iodometric reaction; Spectrophotometry
Background
Iodine is an essential trace element for human nutrition. The safe dietary intake of iodine as recommended by the World Health Organization (WHO) is 100 μg day−1for infants and 150μg day−1for adults (Hetzel 1983). Iodine is required by the thyroid gland for the synthesis of T3 and T4hormones (Visser 2006). The storehouse of iod-ine in the human body is the thyroid gland. Inadequate intake of iodine leads to iodine deficiency symptoms and disorders like goiter, extreme fatigue, mental retardation, and depression which are collectively called as iodine de-ficiency disorders (IDDs). In India, about 71 million people suffer from iodine deficiency disorders. Statistics furnished by the Ministry of Health and Family Welfare in its report revealed that Uttar Pradesh, Bihar, Madhya Pradesh, Maharashtra, and Gujarat states contributing to almost 70% population have maximum IDD cases.
The natural dietary sources of iodine include milk, vegetables, fruits, cereals, eggs, meat, spinach, and sea foods (Zimmermann 2009). However, natural sources of iodine may not satisfy its requirement by the body as iodine from these sources may not be in bioavailable form and also the concentration of iodine may be less.
Adequate intake of iodine can be achieved by consump-tion of iodized salt. Iodizaconsump-tion of salt is done by addiconsump-tion of iodate to salt samples due to its good stability and bioavailability (Bürgi et al. 2001). Thus, determination of iodate in salt samples is of considerable importance as the amount of iodate in the salt samples may vary with environmental conditions, the nature of transport, pack-ing conditions, and cookpack-ing methods (Bruchertseifer et al. 2003).
There are various analytical methods for determination of iodate in seawater and iodized salt samples. Some of the recent methods include kinetic spectrophotometric methods (Ni and Wang 2007), flow injection analysis (Shabani et al. 2011), microspectrophotometry after liquid-phase microextraction (Pereira et al. 2010), using cadmium sulfide quantum dots as fluorescence probes (Tang et al. 2010), liquid-liquid microextraction by high-performance liquid chromatography-diode array detection (Gupta et al. 2011), ion chromatography with integrated amperometric detection (Babulal et al. 2010), transient isotachophoresis-capillary zone electrophoresis (Wang et al. 2009), gas chro-matography–mass spectrometry (Das et al. 2004), using polymer membrane selective for molecular iodine (Bhagat et al. 2008), and neutron activation analysis method (Bhagat et al. 2009). A non-suppressed ion chromatography with in-ductively coupled mass spectrometry (ICP-MS) has been * Correspondence:[email protected]
1
Department of Chemistry, Postgraduate and Research Centre, MES Abasaheb Garware College, Pune-411005, India
Full list of author information is available at the end of the article
© Kulkarni et al.; licensee Springer. This is an open access article distributed under the terms of the Creative Commons Attribution License (http://creativecommons.org/licenses/by/2.0), which permits unrestricted use, distribution, and reproduction in any medium, provided the original work is properly cited.
developed for the simultaneous determination of iodate and iodide in seawater (Zul et al. 2007). Most of the tech-niques are complex and involve sophisticated instruments and complex procedures. It is also observed that application of these analytical methods for iodate determination in table salt is complicated due to the presence of huge excess of chloride, for example, in the case of anion exchange chromatography with conductometric detection which re-quires the removal of large excess of chloride from the sam-ple matrix (Kumar et al. 2001). Hence, development of a method that is selective for iodate and sensitive and re-quires simple and inexpensive experimental setup is of con-siderable scientific interest. Also, accurate determination of the contribution of iodine from table salt to total dietary in-take requires novel methods. With this objective in the present work, a simple and rapid method for determination of iodate is described. Iodometric reaction between iodate, excess iodide, and acid has been used, and the liberated iod-ine is allowed to react with variamiod-ine blue (VB) dye to yield a violet-colored species with absorbance maxima at 550 nm. The developed method was applied to determine the iodate concentration in table salt samples obtained from local markets in and around Pune city in India. The kinetics of the method is very fast, and a large number of table salt samples can be screened for their iodate content in a short time. The iodate content thus determined by the developed method was compared with the iodate content determined by conventional iodometric titration. The method developed in the present work has advantages over conventional methods, for example, it is free from losses of iodine and it is interference free.
Methods
Apparatus
A computer-based spectrophotometer (Systronics, Ahmedabad, India) was used for all the absorbance measurements. A pH meter (Labtronics, Panchkula, India) was used to monitor the pH of the equilibrating so-lutions. The pH meter was standardized using pH 4, 7, and 10 buffer solutions. A digital balance (Contech, Mumbai, India) was used for weighing all the reagents. Double-distilled water was used throughout all the work which was prepared using Equitron's instrument (Mumbai, India).
Reagents and solutions
All reagents used were of analytical reagent grade (A.R. grade) and used without further purification. Variamine blue (Merck, Mumbai, India), potassium iodate (S.M Che-micals, Mumbai, India), potassium iodide (Loba Chemie, Mumbai, India), sodium chloride (Qualigens, Mumbai, India), potassium bromate (Qualigens), ammonium oxalate (Qualigens), potassium chloride (Qualigens), sodium bicar-bonate (Qualigens), potassium nitrate (Qualigens), zinc sulfate (Qualigens), methyl alcohol (Qualigens), and
magnesium carbonate (Qualigens) were used. A variamine blue dye solution was prepared by dissolving 20 mg of the dye in methyl alcohol and diluting the solution to 50 mL using distilled water. A potassium iodate solution was pre-pared by dissolving 0.0122 g of KIO3in distilled water and diluting it to 100 mL [1 mL = 100 μg IO3−]. Sulfuric acid (1 M) was prepared by diluting 6.95 mL of stock H2SO4to the mark in a 250-mL volumetric flask with distilled water. A solution of potassium iodide was prepared by dissolving 25 mg potassium iodide in water and diluting it up to 100 mL [1 mL = 250 μg]. A solution of sodium acetate (2 M) was prepared by dissolving 13.608 g of A.R. grade sodium acetate in distilled water and diluting the solution to 100 mL in a volumetric flask The different interfering ion solutions such as potassium chloride (KCl), sodium bicarbonate (NaHCO3), potassium nitrate (KNO3), zinc sul-fate (ZnSO4), potassium bromate (KBrO3), etc. were pre-pared by dissolving and diluting suitable amounts of the respective salts in distilled water to make a concentration of 1 mL = 100μg.
Samples for iodate determination
A total of 12 different brands of iodized salt samples were analyzed in the present work. The samples were purchased from local markets in and around Pune city. The samples were stored in cool and dry conditions. The contents of the packets were transferred immedi-ately upon opening into an air tight container.
Optimization of parameters for the iodometric reaction Various parameters associated with the iodometric reac-tion were optimized. The amount of potassium iodide and the concentration of acid were optimized in a simi-lar manner as reported in our previous work (Bhagat et al. 2008) The concentration of iodate was fixed as 10μg during the optimization experiments. Experiments were performed to optimize the dye concentration and pH of the reaction mixture. pH adjustments were done using either 2 M NaOH or 2 M HCl. The time required for the completion of the reaction was measured by studying the changes in absorbance as a function of time. The absorbance values were recorded in the inter-vals of 30 s till 30 min.
Measurement of iodate in the aqueous solution
at 550 nm against water as a reagent blank. A calibration plot of absorbance values of VB dye was plotted against the amount of iodate in solution.
Interference studies
The effect of common interfering anions like Cl−, SO42−, NO3−, Br−, PO43− HCO−3, C2O42−, and BrO3− on determin-ation of iodate by the VB method was studied by the fol-lowing procedure. The concentration of iodate in the reaction mixture was kept fixed as 5.72 × 10⁻⁸ M, and the concentration of interfering anions in the equilibrat-ing solution was varied.
Application to table salt samples
Before application of the method to table salt samples, it was applied to A.R. grade laboratory reagent NaCl to study the effect of sodium chloride on the absorbance values. In the case of iodized table salt samples, a homogenous por-tion of 2 g of sample was weighed accurately on a balance and dissolved in distilled water. The final volume was made up to 25 mL, and the solution was used for further analysis. The concentration of iodate in the samples was calculated using a calibration curve. Each sample was analyzed five times, and the standard deviation was calculated. The iod-ate content in these salt samples was also analyzed by con-ventional iodometric titration using Na2S2O3with starch as an indicator.
Results and discussion
Iodometric reaction
When an oxidizing agent (analyte) is added to excess iodide in an acidic medium to produce iodine which is determined by titration, the method is called iodometry. Iodometry provides a simple and rapid method of analysis. It also pro-vides chemical amplification of signals (Zhang et al. 1998). However, conventional iodometric titrations suffer from several limitations like losses of iodine, titration error, lack of suitable indicators, and poor detection limits. These limi-tations can be overcome by converting the liberated iodine into an appropriate signal to prevent losses of iodine. Iodate is a good oxidizing reagent, hence oxidizes iodide to iodine in the presence of mineral acid (Pierce and Haenisch 1945). The reaction offers good signal enhancement as it can be seen from reaction 1 that the iodine content in the product side of the reaction is increased three times on a molar basis. This chemical amplification was conveniently used to determine the concentration of iodate in the present work.
IO3−þ5I−þ6Hþ→3H2Oþ3I2: ð1Þ
This modified iodometric reaction is selective towards iodate, and huge excess of chloride in the table salt sam-ples does not interfere the determination of iodate as chloride cannot oxidize iodide to iodine. The common
difficulty with the iodometric reaction for analytical pur-poses is the trapping of liberated iodine. In this work, the liberated iodine was allowed to react with the VB dye in the presence of sodium acetate (reaction 2). Variamine blue is known to be a suitable chromogenic reagent for iodine (Revansiddapa and Kumar 2001; Narayana and Cherian 2005; Coo and Martinez 2004). The liberated I2 oxidizes the dye to a violet color whose absorbance maxima is at 550 nm. The visible spectrum of the oxidized variamine blue dye is shown in Figure 1. The use of this dye offered an advantage of quick reaction kinetics so that complete utilization of liberated iodine is ensured.
3I2+
H N
O H2N
N
O HN
Variamine blue Violet coloured (oxidized dye)
(2)
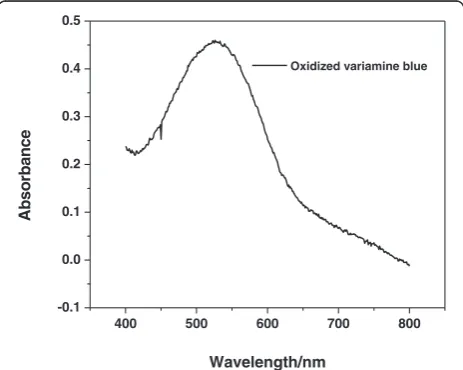
Optimization of parameters for iodometric reaction The optimization of different parameters related to the reaction was done. The concentration of the dye was varied in the range of 0.61 × 10⁻⁶to 12.2 × 10⁻⁶mol L−1. Figure 2 shows the effect of dye concentration on its ab-sorbance. It was observed that the maximum absorbance value was obtained for the dye concentration of 2.44 × 10⁻⁶ mol L−1. However, the absorbance values were lower at dye concentrations below and above this value. This concentration of the dye was used for all further experiments. The amount of iodide was varied between 250 and 1,000 μg. It was found that 250 μg of I− was enough to convert IO3− to I2quantitatively (Bhagat et al. 2008). The pH of the reaction mixture was varied be-tween 2.5 and 11. It was found that the maximum ab-sorbance was recorded at pH 5 as the oxidized form of
400 500 600 700 800
-0.1 0.0 0.1 0.2 0.3 0.4 0.5
Absor
bance
Wavelength/nm
Oxidized variamine blue
Figure 1Visible spectrum of the oxidized variamine blue dye. [IO3−] = 30μg, KI = 250μg, H2SO4= 1 mL [2 M], dye = 2.44μM,
variamine blue is stable at this pH (Figure 3). The effect of acid concentration on the uptake of iodate was stud-ied by varying the amount of H2SO4(1 M). It was found that 1 mL of H2SO4 gave maximum absorbance. To study the effect of time on the absorbance of VB dye, all other conditions were kept fixed and the absorbance was recorded at intervals of 30 s for 30 min. It was found that the time required for completion of the reaction was 300 s, after which the absorbance values remained constant (Figure 4). The optimized parameters in the method are given in Table 1.
Calibration curve and detection limits for iodate determination
The quantitative determination of iodate in aqueous so-lutions was done by constructing a calibration plot. The reaction was carried out using an iodate amount in the range of 2 to 30 μg in a final volume of 10 mL. Then addition of excess iodide was done followed by addition of acid, VB, and sodium acetate in that sequence. The absorbance values of the solutions were plotted as a
function of the iodate amount in the solutions and used as a calibration plot (Figure 5) for further quantifica-tions. The plot was found to be linear till 30 μg of iod-ate. The regression value obtained for the calibration plot is 0.987, and the equation of the calibration plot cal-culated using 15 standards in the range of 2 to 30 μg in a final volume of 10 mL isy= 0.013x. A good linear rela-tionship between absorbance values and amount of iod-ate suggests the use of the present method for quantitative determination of iodate in aqueous samples. The detection limit of the method is 0.25 μg, calculated using the relation DL = 3s/S, wheresis the standard de-viation of the reagent blank andSis the slope of the cali-bration curve.
Effect of interfering anions on determination of iodate The effect of interfering anions on determination of iod-ate in aqueous samples like Cl−, SO42−, NO3−, Br−, PO43−, HCO3−, C2O42−, and BrO3− was studied. The amount of iodate in aqueous samples was kept as 5.72 × 10⁻⁸ M, 0
0.02 0.04 0.06 0.08 0.1 0.12 0.14 0.16 0.18
0 2 4 6 8 10 12 14
Absor
b
ance at
550
nm
Dye concentration (µM)
Figure 2Effect of the concentration of variamine blue dye on
absorbance at 550 nm.[IO3−] = 10μg, KI = 250μg, H2SO4= 1 mL
[2 M], CH3COONa [2 M] = 2 mL, equilibration time = 300 s.
0 0.05 0.1 0.15 0.2 0.25 0.3
0 2 4 6 8 10 12
Absor
bance at
530nm
pH
Figure 3Effect of the pH of reaction mixture on the absorbance value.[IO3−] = 10μg, KI = 250μg, H2SO4= 1 mL [2 M], dye = 2.44μM,
CH3COONa [2 M] = 2 mL, equilibration time = 300 s.
0 0.05 0.1 0.15 0.2 0.25 0.3 0.35 0.4
0 500 1000 1500 2000 2500
Absor
bance Value
Time (s)
Figure 4Absorbance of variamine blue dye as a function of the
time of reaction.[IO3−] = 10μg, KI = 250μg, H2SO4= 1 mL [2 M],
and the amount of interfering anions in the equilibrating solution was varied. The uptake of IO3− in the presence of excess of anions likely to be encountered in the food samples and other aqueous samples was calculated by measuring the absorbance of VB in the solution as a function of the ratio [X−]/[IO
3
−], where [X−] is the
con-centration of the interfering anion. The tolerance limits of various anions are given in Table 2.
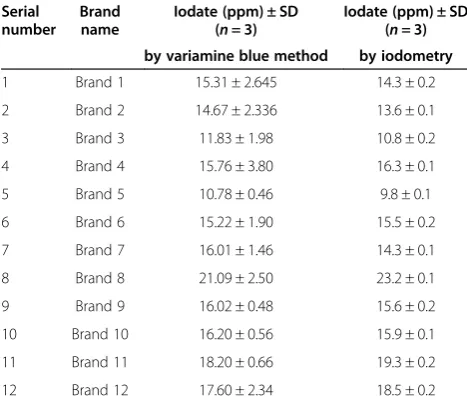
Determination of iodate in iodized salt samples
Fortification of table salt is done with KIO3in order to meet the requirements of iodine in human beings. Iodate is added in the range of 15 to 50 ppm to table salt. Vari-ous brands of iodized salt samples were subjected to the method described above for determination of iodate content. Before analyzing the iodized salt samples, the protocol was used for iodate determination in A.R. grade NaCl (lab reagent), and it was found that there was no effect of NaCl on the absorbance of VB. Consequently, the analysis method was applied to various iodized salt brands. The iodate concentrations obtained in these samples are given in Table 3. It is found that the iodate content was found to be in the range of 10 to 22 ppm. A set of five measurements were carried out for each sam-ple, and the mean values are reported along with stand-ard deviations. The standstand-ard deviation is in the range of 0.40 to 3.8. Brand number 3 and 5 showed less values of
iodate as compared to the quoted value when analyzed by this method. The iodine content as quoted by the manufacturer is also given in Table 3. The amount of iodine obtained by conventional iodometric titration is also given in the table.
According to WHO, the daily dietary intake of iodine is 150μg for adults. Considering the spicy food habits in India, the average intake of salt through food may be in the range of 2 to 3 g per day. Using this approximation, the contribution of iodine from table salt can be calcu-lated to be around 30 to 40μg per day. The bioavailabil-ity of iodine may be considered to be 100% due to its solubility in digestive fluids. The contribution of iodine from table salt is estimated to be 20% to 40% of the total iodine requirement. This contribution may not be enough in regions where the soil is deficient in iodine content. Consequently, iodine deficiency disorders will be prevalent in these regions.
y = 0.0137x R² = 0.9878
0 0.05 0.1 0.15 0.2 0.25 0.3 0.35 0.4 0.45
0 5 10 15 20 25 30 35
Absor
bance at
530nm
µg of
IO3-Figure 5Calibration curve of iodate.[IO3−] = 2 to 30μg, KI =
250μg, H2SO4= 1 mL [2 M], dye = 2.44μM, CH3COONa [2 M] =
2 mL, equilibration time = 300 s.
Table 1 Optimized parameters used for analysis
Serial number Optimized parameters Value
1 IO3− 2 to 30μg
2 KI 250μg
3 H2SO4 1 mL [2 M]
4 pH 5.0
5 Dye 2.44μM
6 Sodium acetate 2 mL of 2 M
7 Time 300 s
Table 2 Effect of some interfering anions on iodate determination
Serial number Interfering anion [X−] Tolerated ratio [X−]/[IO3−]
1 Cl− 500
2 NO3− 100
3 SO42− 50
4 Br− 50
5 PO43− 50
6 HCO3− 5
7 C2O42− 25
8 BrO3− 5
Table 3 Iodate values obtained in local brands of table salt
Serial number
Brand name
Iodate (ppm) ± SD (n= 3)
Iodate (ppm) ± SD (n= 3)
by variamine blue method by iodometry
1 Brand 1 15.31 ± 2.645 14.3 ± 0.2
2 Brand 2 14.67 ± 2.336 13.6 ± 0.1
3 Brand 3 11.83 ± 1.98 10.8 ± 0.2
4 Brand 4 15.76 ± 3.80 16.3 ± 0.1
5 Brand 5 10.78 ± 0.46 9.8 ± 0.1
6 Brand 6 15.22 ± 1.90 15.5 ± 0.2
7 Brand 7 16.01 ± 1.46 14.3 ± 0.1
8 Brand 8 21.09 ± 2.50 23.2 ± 0.1
9 Brand 9 16.02 ± 0.48 15.6 ± 0.2
10 Brand 10 16.20 ± 0.56 15.9 ± 0.1
11 Brand 11 18.20 ± 0.66 19.3 ± 0.2
Conclusions
A simple and rapid method has been developed for de-termination of iodate in aqueous samples. The method is applicable to iodate determination in the concentra-tion range of 2 to 30 μg in a final equilibration volume of 10 mL. Optimized parameters for the method are IO3− (2 to 30 μg), KI (250μg), 2 M H2SO4(1 mL), pH (5.0), time of equilibration (20 min), 2.44 μM dye (20 μg, 1 mL), and 2 mL sodium acetate (2 M). The concentra-tion of IO3−obtained in the salt samples was in the range of 10 to 22 ppm. The results obtained by the present method are in good agreement with those obtained by conventional iodometry, thus validating the method.
Competing interests
Authors declare that there are no competing interests.
Authors’contributions
PSK: Original idea, design of work, SDD: Execution of experiments, SDK: Data interpretation and manuscript writing. All authors read and approved the final manuscript.
Author details
1
Department of Chemistry, Postgraduate and Research Centre, MES Abasaheb Garware College, Pune-411005, India.2Modern College,
Shivajinagar, Pune 411005, India.3Department of Chemistry, Sir Parashurambhau, Pune-411030, India.
Received: 20 June 2013 Accepted: 18 October 2013 Published:
References
Babulal R, Parimal P, Ghosh PK (2010) Determination of iodide and iodate in edible salt by ion chromatography with integrated amperometric detection. Food Chem 123:529–534
Bhagat PR, Pandey AK, Acharya R, Natarajan V, Rajurkar NS, Reddy AVR (2008) Molecular iodine selective membrane for iodate determination in salt samples: chemical amplification and preconcentration. Anal Bioanal Chem 391:1081–1089
Bhagat PR, Acharya R, Nair AGC, Pandey AK, Rajurkar NS, Reddy AVR (2009) Estimation of iodine in food, food products and salt using ENAA. Food Chem 115:706–710
Bruchertseifer H, Cripps R, Guentay S, Jaeckel B (2003) Analysis of iodine species in aqueous solutions. Anal Bioanal Chem 375:1107–1110
Bürgi H, Schaffner T, Seiler JP (2001) The toxicology of iodate: a review of the literature. Thyroid 11:449–456
Coo LD, Martinez IS (2004) Nafion-based optical sensor for the determination of selenium in water samples. Talanta 64:1317–1322
Das P, Gupta M, Jain A, Verma KK (2004) Single drop microextraction or solid phase microextraction-gas chromatography–mass spectrometry for the determination of iodine in pharmaceuticals, iodized salt, milk powder and vegetables involving conversion into 4-iodo-N,N-dimethylaniline. J Chroma-togr A 1023:33–39
Gupta M, Pillai AKKV, Singh A, Jain A, Verma KK (2011) Salt assisted liquid-liquid microextraction for the determination of iodine in table salt by
high-performance liquid chromatography-diode array detection. Food Chem 124:1741–1746
Hetzel BS (1983) Iodine deficiency disorders (IDD) and their eradication. Lancet 2:1126–1127
Kumar SD, Maiti B, Mathur PK (2001) Determination of iodate and sulphate in iodized table salt by ion chromatography with conductivity detection. Talanta 53:701–705
Narayana B, Cherian T (2005) Rapid spectrophotometric determination of trace amounts of chromium using variamine blue as a chromogenic reagent. J Brazil Chem Soc 16:197–201
Ni Y, Wang Y (2007) Application of chemometric methods to the simultaneous kinetic spectrophotometric determination of iodate and periodate based on consecutive reactions. Microchem J 86:216–226
Pereira FP, Ferreiro SS, Lavilla I, Bendicho C (2010) Determination of iodate in waters by cuvetteless UV–vis micro-spectrophotometry after liquid-phase microextraction. Talanta 81:625–629
Pierce WC, Haenisch EL (1945) Quantitative analysis, 2nd edition. Wiley, New York, pp 199–216
Revansiddapa H, Kumar TLK (2001) A facile spectrophotometric method for the determination of selenium. Anal Sci 17:1309–1312
Shabani AMH, Ellis PS, McKelvie ID (2011) Spectrophotometric determination of iodate in iodised salt by flow injection analysis. Food Chem 129:704–707 Tang CR, Su Z, Lin B, Huang H, Zeng Y, Li S, Huang H, Wang Y, Li C, Shen G, Yu R
(2010) A novel method for iodate determination using cadmium sulfide quantum dots as fluorescence probes. Anal Chim Acta 678:203–207 Visser TJ (2006) The elemental importance of sufficient iodine intake: a trace is
not enough. Endocrinol 147:2095–2097
Wang T, Zhao S, Shen C, Tang J, Wang D (2009) Determination of iodate in table salt by transient isotachophoresis-capillary zone electrophoresis. Food Chem 112:215–220
Zhang M, Zhan G, Chen Z (1998) Iodometric amplification methods for the determinations of microgram amounts of manganese (II), manganese (VII), chromium (III) and chromium (VI) in aqueous solution. Anal Sci 14:1077–1083 Zimmermann MB (2009) Iodine deficiency. Endocrine Rev 30:376–408
Zul C, Megharaj M, Naidu R (2007) Speciation of iodate and iodide in seawater by non-suppressed ion chromatography with inductively coupled plasma mass spectrometry. Talanta 72:1842–1846
Cite this article as:Kulkarniet al.:A rapid assessment method for determination of iodate in table salt samples.Journal of Analytical Science and Technology
Submit your manuscript to a
journal and benefi t from:
7 Convenient online submission
7 Rigorous peer review
7 Immediate publication on acceptance
7 Open access: articles freely available online
7 High visibility within the fi eld
7 Retaining the copyright to your article
Submit your next manuscript at 7 springeropen.com
15 Nov 2013
10.1186/2093-3371-4-21
![Figure 2 Effect of the concentration of variamine blue dye onabsorbance at 550 nm. [IO−3] = 10 μg, KI = 250 μg, H2SO4 = 1 mL[2 M], CH3COONa [2 M] = 2 mL, equilibration time = 300 s.](https://thumb-us.123doks.com/thumbv2/123dok_us/9571884.1940151/4.595.58.541.537.702/figure-effect-concentration-variamine-blue-onabsorbance-coona-equilibration.webp)