The Assessment of Water Quality and Primary Productivity in Earthen
Fishponds Stocked with Stripped Mullet (
Mugil cephalus
) and Subjected to
Different Feeding Regimes
Introduction
Phytoplankton is a functional aquatic community base upon which the aquatic food web is culminating (Reynolds, 1984). Studies on physico-chemical factors and phytoplankton standing crop of its habitat are essential for the proper management of water resources and for the prediction of the potential changes in the aquatic ecosystem (Kobia, 1982; Descy, 1987). Sheehan (1984) reported that phytoplankton populations are mostly structured by the physical and chemical variables of their environment. These factors have also been reported to be responsible for the heterogeneity in phytoplankton composition and biomass (El-Ayouty et al., 1994, 1999; Ahmad et al., 2001; Ibrahim et al., 2003).
Striped mullet (Mugil cephalus) is one of the best-known members of Mugilidae and has significant commercial value in many countries (Oren, 1981). It is a euryhaline marine teleost that inhabits coastal waters but enters estuaries and rivers (Harrison and Senou, 1997), and it is widely cultured in both brackish and freshwater semi-intensive fishponds (Lupatsch et al., 2003). As adults, they eat all available food, microalgae including apiphytic and benthic forms, and decaying plant detritus. They feed at the lowest trophic level, being able to utilize the direct algal grazing or plant detritus as energy sources (Odum, 1970; Brusle, 1981). Porter et al. (1996) indicated that striped mullet is able to reduce the organic matter in the sediment underneath the cages. Moreover, Jana et al. (2004) found that grey mullet
(M. cephalus) could efficiently use peryphyton that colonized the bamboo substrates in inland saline groundwater. Thus, Katz et al. (2002) and Lupatsch et al. (2003) used striped mullet (Mugil cephalus) to remove the organic matter deposited on the sea floor due to the deposition of solid waste from undigested feed. In Abbassa fishponds, striped mullet is one of the most important components of fish polyculturing system.
Organic and/or inorganic fertilizers are used in pond fertilization. Many studies have shown positive correlation between pond fertilization and fish production (Schroeder, 1974; Boyd, 1984; Abdel-Tawwabet al. 2002 a, b). Increases in fish production in fertilized ponds were attributed to the increments in primary productivity (Diana et al., 1991; Ahmad et al. 2001; Abdel-Tawwab et al., 2002a; 2002b). Phytoplankton in turn increases secondary production (zooplankton); thereby producing greater yields of fish (Stickney, 1979; Seymour, 1980).
The main aim of this study was to evaluate the phytoplankton productivity in relation to pond management. Also, the impact of striped mullet (M. cephalus) on phytoplankton abundance in fishponds that received either organic or inorganic fertilizers and/or artificial feed was studied.
Materials and Methods
The study was conducted in nine earthen ponds (surface area 1,000 m2each) at Central Laboratory of Aquaculture Research, Abbassa, Sharqia, Egypt. The
Abstract
The effects of different feeding regimes of striped mullet (Mugil cephalus) on water quality and phytoplankton fluctuations in earthen fishponds were studied. Striped mullet (35.1r1 g) was stocked at a rate of 1 fish/m2 for 105 days. The first treatment ponds (control) received only organic and inorganic fertilizers. The second treatment ponds (T1) received organic and inorganic fertilizers as in the first treatment and supplemental feed at a rate of 3% of fish body weight (bw). The third treatment ponds (T2) received only supplemental feed at a rate of 5% of bw. Each treatment was represented by three replicates. Results revealed that there were no significant differences in water temperature, pH, free ammonia, and water conductivity among the treatments. Dissolved oxygen, orthophosphate and nitrate concentrations in control and T1 ponds were significantly higher than those of T2 ponds. Water turbidity was significantly higher in T1 ponds than that of the other treatment ponds. Phytoplankton and zooplankton abundances were significantly higher in control and T1 ponds than those of T2 ponds. The final weight of striped mullet was maximized at T2 ponds, while the lowest one was in control ponds. It could be concluded that striped mullet could utilize both supplemental and/or natural food.
Key Words: Water quality, phytoplankton, zooplankton, supplemental feed, striped mullet, growth.
Mohsen Abdel-Tawwab1,*, Abdel-Hamid M. Eid2, Ali E. Abdelghany3, Hany I. El-Marakby3
1
Fish Ecology Department, Central Laboratory for Aquaculture Research, Abbassa, Abo-Hammad, Sharqia, Egypt. 2
Department of Animal Production, Faculty of Agriculture, Suez Canal University, Ismailia, Egypt.
3 Fish Nutrition Department, Central Laboratory for Aquaculture Research, Abbassa, Abo-Hammad, Sharqia, Egypt.
* Corresponding Author: Tel.: +2 055 231 98 21; Fax: +2 055 340 04 98; E-mail: mohsentawwab@yahoo.com
freshwater from El-Wadi Canal derived from Ismailia Canal. The water level was kept at 0.8-1.0 m. This experiment started on September 9, 1994 and lasted for 105 days.
Three treatments were assigned to evaluate the acceptability of natural food and/or supplemental feed by striped mullet. The first three ponds received only organic and inorganic fertilizers (control), the second three ponds (T1) received organic and inorganic fertilizers as in control ponds and supplementary feed at a rate of 3% of fish bw. The third three ponds (T2) received only supplementary feed at a rate of 5% of fish bw. Before the experiment started, control and T1 ponds were fertilized with cow manure at a rate of 300 kg/acre. The manure was distributed randomly on the bottom of pond. After stocking the fish, chicken manure was applied at a rate of 10 kg/acre biweekly. In addition to chicken manure, inorganic fertilizers of urea and monosuperphosphate were also applied biweekly at a rate of 1 kg/acre and 5 kg/acre, respectively. The inorganic fertilizers were dissolved and spread on the water surface of fishponds. Striped mullet (35.1r1 g) was stocked at a rate of 1 fish/m2. In T1 and T2 ponds, the diet used contained 35% crude protein that was given to fish twice daily. Every two weeks, 25 fish from each pond were sampled and length and weight of each fish was measured. The amounts of feed given were readjusted according to changes in fish biomass.
Water samples for chemical analyses were collected weekly using a water sampler between 08:30 and 09:30 at 30 cm depth from each pond. Dissolved oxygen and temperature were measured at 30 cm depth with a YSI model 58 oxygen meter (Yellow Spring Instrument Co., Yellow Springs, Ohio, USA). Water conductivity was measured with YSI model 33 conductivity meter (Yellow Spring Instrument Co., Yellow Springs, Ohio, USA). pH and free ammonia were measured colorimetrically using Hach kits (Hach Co., Loveland, Colorado, USA). The chemical parameters were analyzed according to APHA (1985). Orthophosphate was colorimetrically determined using stannous chloride method and nitrate was colorimetrically determined using phenoldisulphonic acid method (Boyd, 1984).
Water samples for phytoplankton were collected using 1-liter bottle at the same depth and preserved by adding 1 ml of 4% formalin solution. Samples were allowed to settle for 15 days and the supernatant was siphoned to 50 ml. Samples for zooplankton determination were collected by plankton net (50 Pm) filtering 20 litres and immediately preserved by adding 1 ml of 10% formalin solution. Phytoplankton and zooplankton counting was performed using Sedgwick-Rafter cell under a binocular microscope with appropriate magnification. The phytoplankton in samples was identified to genus level according to Prescott (1961). Shannon and Weaver (1949) equation
diversity.
Water quality data were analyzed comparing the treatments with Kruskal-Wallis One Way Analysis of Variance on Ranks, using dates as blocks to determine significant differences. Mean separations were determined using Tukey’s test at the 5% probability level. Spearman correlation and multiple stepwise regressions of the obtained data were done. All statistical analyses were conducted with SPSS software program (SPSS, Richmond, USA) version 10 as described by Dytham (1999).
Results
Water Quality Parameters
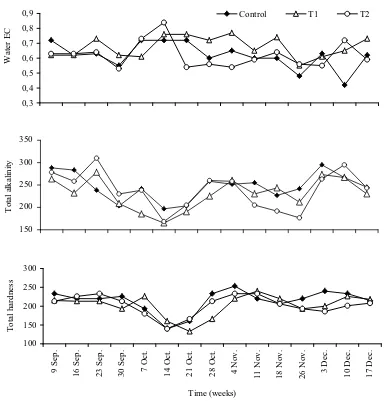
The variations in water quality parameters are presented in Figures 1, 2 and 3. Water temperature of different treatments was approximately the same. Moreover, water temperature showed remarkable decrease with maximum value of 29.3°C in September, and the lowest value of 15.3°C in December. pH did not vary much among treatments. It varied from 8.3 to 8.7 for all treatments. Dissolved oxygen was also affected significantly by treatments (P<0.01) where it was higher in T1 than that of control and T2. Turbidity was negatively affected by treatments (r = -0.76; P<0.01). Free ammonia in different treatments was approximately the same (0.13-0.14 mg/l; Figure 2). It was less than the critical concentration affecting fish health. Phosphate and nitrate concentrations were varied significantly (P<0.05) in the different treatments (Figure 2). They were significantly lower at T1 ponds than those of control and T2 (P<0.05). Water conductivity, total alkalinity and total hardness were not affected by treatments in this study (Figure 3).
Phytoplankton Abundance
The dominant phytoplankton groups were Bacillariophyceae, Chlorophyceae, Cyanobacteria, and Euglenophyceae in all treatments (P<0.05; Table 1). All of these groups except Cyanobacteria, were significantly affected by treatments (P<0.05). Cyanobacteria and Euglenophyceae exhibited low abundance compared with other groups. Euglenophyceae disappeared completely in some months. Bacillariophyceae and Chlorophyceae were the dominant groups. Bacillariophyceae and Chlorophyceae were recorded in control and T1 ponds without exhibiting significant differences. T2 yielded less phytoplankton numbers (Table 1).
respectively), while the minimum value was recorded in September and October at T2 (21 and 30 org./ml, respectively).
Table 2 shows the different genera of each phytoplankton group. The recorded genera were 8, 8, 5 and 2 for Bacillariophyceae, Chlorophyceae, Cyanobacteria and Euglenophyceae, respectively. The most abundant genera of Bacillariophyceae were
Navicula, Nitzschia, and Synedra. Other genera of Bacillariophyceae were Cyclotella, Cymbella, Gyrosigma, Melosira, and Pinnularia. Navicula and
Nitzschia were the most abundant genera at all treatments during the study period. Navicula exhibited
the highest number in September and November at T1 (18 and 15 org./ml, respectively). The highest number ofNitzschia was recorded in November at control (16 org./ml) and in September at T1 (15 org./ml). Moreover, Synedra was abundant at control, and the highest number was obtained in November in control (13 org./ml).
In Chlorophyceae, Pediastrum, Scenedesmus
andTetraedron were found to be the most abundant genera. In addition, Ankistrodesmus, Chlorella, Coilastrum, Crucigenia, and Pandorina were recorded. The maximum Scenedesmus number was recorded in November in T1 (34 org./ml), while the 12
17 22 27 32
T
em
p
erat
u
re (C) Control T1 T2
8,2 8,3 8,4 8,5 8,6 8,7 8,8
pH
0 2 4 6 8 10
D
is
so
lve
d oxyge
n (m
g/l)
0 20 40 60 80
9 Se
p.
16
Sep
.
23
Sep
.
30
Sep
.
7 O
ct.
14
Oct.
21
Oct.
28
Oct.
4 N
ov.
1
1
N
ov.
1
8
N
ov.
2
6
N
ov.
3
Dec.
10
Dec.
17
Dec.
Time (weeks)
Wa
te
r turbidity (NTU)
0 0,05 0,1 0,15 0,2 0,25
F
ree ammon
ia Control T1 T2
0 0,5 1 1,5 2 2,5 3 3,5
N
it
rate c
o
n
c
0 0,2 0,4 0,6 0,8 1 1,2 1,4 1,6 1,8
9 S
ep.
16 S
ep.
23 S
ep.
30 S
ep.
7 O
ct
.
14 O
ct
.
21 O
ct
.
28 O
ct
.
4 N
ov.
11 N
ov.
18 N
ov.
26 N
ov.
3
Dec.
10 D
ec
.
17 D
ec
.
Time (weeks)
Phos
pha
te
c
onc
Figure 2. Monthly variations of free ammonia, nitrate and phosphate concentrations (mg/L) in earthen ponds stocked with stripped mullet and subjected to different feeding regimes.
Table 1. Variance and distribution of major phytoplankton groups (org/ml) in earthen ponds stocked with stripped mullet and subjected to different feeding regimes
Control T1 T2
Phytoplankton
Groups Sep. Oct. Nov. Dec. Sep. Oct. Nov. Dec. Sep. Oct. Nov. Dec.
Cyanobacteria 9 4 11 5 4 5 9 4 4 5 7 4
% 11.2 7.7 9.0 9.6 4.6 10.2 8.1 8.3 19.1 16.7 10.4 11.8
Chlorophyceae 30 17 69 31 39 23 59 28 7 13 35 19
% 37.5 32.7 56.5 59.6 44.9 46.9 53.2 58.4 33.3 43.3 52.3 55.8
Bacillariophyceae 28 18 39 16 37 14 38 16 6 6 21 11
% 35.0 34.6 32.0 30.8 42.5 28.6 34.2 33.3 28.6 20.0 31.3 32.4
Euglenophyceae 13 13 3 0 7 7 5 0 4 6 4 0
% 16.3 25.0 2.5 0.0 8.0 14.3 4.5 0.0 19.0 20.0 6.0 0.0
Total number 80 52 122 52 87 49 111 48 21 30 67 34
% 100 100 100 100 100 100 100 100 100 100 100 100
Control: ponds received only organic and inorganic fertilizers.
0,3 0,4 0,5 0,6 0,7 0,8 0,9
Wa
te
r E
C
Control T1 T2
150 200 250 300 350
To
tal
alk
ali
n
it
y
100 150 200 250 300
9 Se
p.
16 Se
p.
23 Se
p.
30 Se
p.
7 O
ct
.
14 O
ct
.
21 O
ct
.
28 O
ct
.
4 Nov.
11
Nov.
18
Nov.
26
Nov. 3 D
ec.
10 De
c.
17 De
c.
Time (weeks)
Tot
al
ha
rdne
ss
Figure 3. Monthly variations of water conductivity (PS/cm), total alkalinity and total hardness (mg/l as CaCO3) in earthen ponds stocked with stripped mullet and subjected to different feeding regimes.
minimum number was obtained in September in T2 (3 org./ml). The highest number of Pediastrum was recorded in November in T1 (11 org./ml).
Among Cyanobacteria, Anabaena and
Merismopedia were the most dominant genera. Other genera such as Chroococcus, Gleocapsa, and
Oscillatoria were also present in the ponds. The highest number was recorded for Anabaena in November and Oscillatoria in September at control ponds and Merisomopediain November at T1 ponds with the same number (4 org./ml).
Euglenophyceae was represented only by the genera Euglena and Phacus. They were recorded in all treatments during the experimental period except December. Generally, Phacus was less abundant than
Euglena. The high occurrence of Euglena was recorded during September and October in control (9 and 8 org./ml, respectively). In case of Phacus, the highest number was obtained in September and
October in control (4 and 5 org./ml, respectively). The Shannon-Weaver diversity index of overall phytoplankton genera decreased by time in control and T2 ponds, while it increased in T1 (Figure 4). It could be seen that the diversity index in September and October was lower than that of November and December in all treatments, except T1.
Zooplankton Abundance
that in October in control (16 org/L). The minimum number of zooplankton was recorded in December in control and T2 ponds (5 and 4 org./L; Table 3). Dominant Cladocera included Moina, Bosmania, Diaphanosoma and Daphnia. Cyclops was the most common copepod and common rotifers included
Brachionus and Keratella.
Fish Growth
Concerning fish growth, Figure 5 shows that the mean weight of striped mullet gradually increased up to the end of the experimental period. The maximum final weight of striped mullet was obtained at T1 and T2 treatments without significant difference (78.5 and
Control T1 T2
Phytoplankton
General Sep. Oct. Nov. Dec. Sep. Oct. Nov. Dec. Sep. Oct. Nov. Dec.
Bacillariophyceae
Cyclotella 1 - 1 2 - - 1 2 1 - 1 -
Cymbella - 3 4 1 - - - 1 - -
Gyrosigma 1 1 - - - 1 2 - - - 1 1
Melosira - - 1 - 2 - 1 - - - 2 -
Navicula 3 2 4 2 18 7 15 4 2 2 7 2
Nitzschia 9 3 16 7 15 5 12 6 2 2 3 5
Pinnularia 14 6 - - - 2 -
Synedra - 3 13 4 2 1 7 4 1 1 5 3
Chlorophyceae
Ankistrodesmus 6 - 4 - - 4 3 2 - - - 1
Chlorella 4 2 7 2 - 2 4 - - 3 8 -
Coilastrum - - 4 2 - - - 3 - - - 2
Crucigenia 3 - 19 1 - 1 2 5 1 2 5 3
Pandorina - 1 4 - 5 - - -
Pediastrum 3 1 6 3 5 2 11 3 2 2 7 1
Scenedesmus 12 9 20 21 23 12 34 6 3 5 13 12
Tetraedron 2 4 7 2 4 2 5 9 1 - 2 -
Cyanobacteria
Anabaen 2 2 4 1 2 - 2 1 2 2 - 1
Chroococcus 2 1 2 3 - - - 1 1 - 2 2
Gleocapsa 1 1 2 - - 1 - - - 1 2 -
Merismopedia - - 1 1 1 1 4 1 1 1 2 1
Oscillatoria 4 - 2 - 1 3 3 1 - 1 1 -
Euglenophyceae
Euglena 9 8 2 0 5 4 3 0 2 4 2 0
Phacus 4 5 1 0 2 3 2 0 2 2 2 0
Control: ponds received only organic and inorganic fertilizers.
T1: ponds received organic and inorganic fertilizers, and 3% artificial feed. T2: ponds received 5% artificial feed only.
2,5 2,7 2,9 3,1 3,3 3,5 3,7 3,9 4,1
Sep. Oct. Nov. Dec.
D
ive
rs
ity inde
x (
H
')
Control T1 T2
83.2 g, respectively), while the lowest final weight of fish was obtained in control (74.0 g).
Discussion
Effective water management in fishponds is one of the important factors contributing to the success of fish culture, reducing the occurrence of fish disease and enhancing fish growth and survival. Factors such as light, temperature and nutrients play an important role in phytoplankton productivity in aquatic systems (Hutchinson, 1967; Wetzel, 1983). In this study, water temperature was decreasing until the end. So, the number of phytoplankton and zooplankton was almost less than that reported before in Abbassa fishponds by El-Ayouty et al. (1994), (1999), Ahmad et al. (2001) and Ibrahim et al. (2003). Certainly, the low water temperature affected the growth of striped mullet (r = -0.968; P<0.01) although it could survive and grow at temperature range of 8–24°C (Harrison and Senou, 1997).
There were no significant variations in water conductivity, free ammonia, total alkalinity and total hardness among treatments. Significantly higher concentrations of phosphate and nitrate at control and T1 treatments might have been principally due to the fertilizer inputs. However, T2 ponds did not receive fertilizers. In this concern, Diana et al. (1994) found no significant differences in water quality between combined treatments (feed and fertilizer) and fertilizer alone. Furthermore, Diana et al. (1996) reported that the efficient use of supplemental feed at a limiting rate, along with fertilizer and natural feeds did not adversely affect water quality.
Water turbidity was higher in T1 than that in control and T2, which might have resulted from the dispersion of colloidal clay particles, and the suspended organic particles due to fish movement in pond and the abundance of phytoplankton (Boyd, 1984). Moreover, the high concentration of dissolved oxygen in T1 compared to control and T2 could be due to the high occurrence of phytoplankton that
Table 3. Variance and distribution of zooplankton groups (org/L) in earthen ponds stocked with stripped mullet and subjected to different feeding regimes
Control T1 T2
Zooplankton
Groups Sep. Oct. Nov. Dec. Sep. Oct. Nov. Dec. Sep. Oct. Nov. Dec.
Cladocera 8 9 4 3 6 7 10 4 5 4 3 2
% 57.2 56.3 50.0 60.0 60.0 53.8 55.6 50.0 55.6 57.1 50.0 50.0
Copepods 4 5 2 1 2 4 5 2 2 2 2 1
% 28.6 31.3 25.0 20.0 20.0 30.8 27.8 25.0 22.2 28.6 33.3 25.0
Rotifers 1 1 1 1 1 1 2 2 1 1 1 1
% 7.1 6.2 12.5 20.0 10.0 7.7 11.1 25.0 11.1 14.3 16.7 25.0
Others 1 1 1 0 1 1 1 0 1 0 0 0
% 7.1 6.2 12.5 0.0 10.0 7.7 5.5 0.0 11.1 0.0 0.0 0.0
Total number 14 16 8 5 10 13 18 8 9 7 6 4
% 100 100 100 100 100 100 100 100 100 100 100 100
30 40 50 60 70 80 90 100
0 2 4 6 8 10 12 14
Time (week)
F
ish wei
ght
(
g
)
Control T1 T2
production. In this respect, Talling (1986) stated that, oxygen supersaturation due to photosynthetic activity is often recorded with abundant phytoplankton. Generally, dissolved oxygen in this study was adequate for fish culture in the three treatments.
The control and T1 ponds exhibited high number of phytoplankton organisms in comparison to that of T2. This result might be due to the availability of nutrients required for phytoplankton flourishing on account of fertilizers application. The low abundance of phytoplankton recorded in T2 might be because of the low nitrogen and phosphorus concentrations. However, no organic and/or inorganic fertilizers were added.
The number of phytoplankton depended mainly on the number of Bacillariophyceae and Chlorophyceae, which were the most abundant groups (r = 0.956 and 0.931, respectively; P<0.05), while Cyanobacteria and Euglenophyceae were the less abundant ones in all treatments (r = 0.605 and 0.189, respectively; P<0.05). Some of Cyanobacteria algae apparently disappeared at certain periods and reappeared later. These results are quite similar to those found in studies on Abbassa ponds (El-Ayouty
et al., 1994; 1999; Ahmad et al., 2001). Moreover, Cyanobacteria have slower growth rate than the green algae (Benemann et al., 1977; Cromar and Fallowfield, 1997). Such temporary disappearance of these algae is probably due to the fact that the species concerned either become too scarce or occur as spores, resting eggs, etc., which are not easily detectable (Hutchinson, 1967).
The great diversity in the phytoplankton biomass and structure might be related to environmental fluctuations and competition on nutrients (D’Elia et al., 1986), predation by zooplankton (Verity, 1986) and planktivorous fish. All of these factors might cause major changes in plankton community structure (Lazzaro 1987; Northcote 1988) and the size of phytoplankton (Lynch and Shapiro 1981; Lehman and Sandgren 1985). On the other side, the impact of fish on phytoplankton depends on the rate of filter feeding by fish and phytoplankton growth rates as well as the predatory pressure on phytoplankton (Turker et al., 2003).
The effect of zooplankton on phytoplankton is not simply related to filtering and nutrients regeneration rates. It might also vary considerably with body size (Peters and Downing, 1984) and zooplankton actively generates nutrients through their feeding and metabolic activities. These nutrients are usually in forms directly available for algal intake (Gardner and Scavia, 1981). Moreover, the necessity of zooplankton for young fish is considered universal (Fernando, 1994) as well as its importance for adults of many fish (Mavuti, 1990).
In this investigation, phytoplankton is not affected by zooplankton (r = -0.318; P>0.05). This
(2001) in Abbassa fishponds. They found a significant interaction between zooplankton and phytoplankton, which should be considered when discussing productivity and trophic structure in pond system. The difference herein probably was due to the low water temperature that negatively affected the growth and flourishing of phytoplankton and in turn zooplankton abundance. Jeppesen et al. (2004) found low zooplankton biomass in winter because of low specimen turnover during winter mediated by low fecundity, which, in turn, reflects food shortage and low winter hatching from resting eggs. They also found that in shallow lakes, the zooplankton : phytoplankton biomass ratio was substantially higher during summer than in winter, suggesting a higher zooplankton grazing potential during summer.
The optimum fish growth could be obtained when supplemental feed was given to fish. These results are much as expected where the feed supplementation to fishponds resulted in significantly higher yields and growth rates compared to fertilization alone. However, fish growth was high at T2 due to considerable consumption of supplemental food. Green (1992) found that the growth of Nile tilapia was significantly lower in fertilization-alone ponds than in feed-alone or combined fertilizer-feed treatments.
The stepwise regression indicating that fish growth, as a dependant variable was affected by treatments, phytoplankton abundance and temperature. These relations were summarized in the following equation:
Fish growth = 17.857 + 0.849 Treatments – 2.743 Temperature – 0.128 Phytoplankton
In conclusion, there were no significant differences in water temperature, pH-value, free ammonia and water conductivity among the different treatments. Dissolved oxygen and concentrations of orthophosphate and nitrate in control and T1 were significantly higher than those of T2. Water turbidity was significantly higher in T1 ponds than the other treatments. Number of phytoplankton and zooplankton was significantly higher in control and T1 than that in T2. Striped mullet could utilize both supplemental feed and/or natural food, and could completely consume artificial feed.
References
Abdel-Tawwab, M., Abdelghany, A.E., El-Ayouty, Y.M. and El-Essawy, A.A. 2002b. Effect of inorganic fertilizers with different N/P/K ratios on water quality, primary productivity and production of Nile tilapia (Oreochromis niloticus L.) in earthen ponds. Egypt. J. Agric. Res., 80(4): 1909-1923.
Ahmad, M.H., Abdelghany, A.E. and Abdel-Tawwab, M. 2001. Phytoplankton dynamics in fertilized earthen ponds received supplemental feed at different timing for different periods. Egypt. J. Botony, 41(1): 79-98. American Public Health Association, APHA, 1985.
Standard Methods for the Examination of Water and Wastewater, 16th ed. American Public Health Association, Washington, D.C., USA.
Benemann, J.R., Weissman, J.C., Koopman, B.L. and Oswald, W.J. 1977. Energy production by microbial photosynthesis. Nature, 268: 19-23.
Boyd, C.E. 1984. Water Quality in Warmwater Fishponds. Auburn University, Agricultural Experimental Station, Auburn, Alabama, USA.
Brusle, J. 1981. Food and feeding in grey mullet. In: O.H. Oren (Ed.), Aquaculture of Grey Mullet, Cambridge University Press, Cambridge, UK: 185-217.
Cromar, N.J. and Fallowfield, H.J. 1997. Effect of nutrient loading and retention time on performance of high rate algal ponds. J. Applied Phycology, 9: 301-309. D’Elia, C.F., Sanders, J.G. and Boynton, W.R. 1986.
Nutrient enrichment studies in a coastal plain estuary: phytoplankton growth in large-scale, continuous cultures. Canad. J. Fish. Aquat. Sci., 43: 397-406. Descy, J.P. 1987. Phytoplankton composition and dynamics
in river Meuse (Belgium). Arch. Hydrbiol. (Suppl. 78), 2: 225-247.
Diana, J.S., Lin, C.K. and Schneeberger, P.J. 1991. Relationships among nutrient inputs, water nutrient concentrations, primary productivity and yield of
Oreochromis niloticus in ponds. Aquaculture, 92: 323-341.
Diana, J.S., Lin, C.K. and Jaiyen, K. 1994. Supplemental feeding of tilapia in fertilized ponds. J. World Aquacult. Soc., 25: 497-506.
Diana, J.S., Lin, C.K. and Yang, Y. 1996. Timing of supplemental feeding for tilapia production. J. World Aquacul. Soc., 27(4): 410-419.
Dytham, C. 1999. Choosing and Using Statistics: A Biologist’s Guide. Blackwell Science Ltd., London, UK. 147 pp.
El-Ayouty, Y.M., El-Essawy, A.A. and Said, A.A. 1999. The assessment of water quality of Enan and El-Abbassa ponds, Egypt. Acta Hydrobiol., 41(2): 117-137.
El-Ayouty, Y. M., El-Essawy, A.A., Abdelghany, A.E. and Abdel-Tawwab, M. 1994. Effect of different N/P/K ratios on physico-chemical changes and phytoplankton standing crop in fish pond. Bull. Fac. Sci. Zag. Univ., 16(1): 216-239.
Fernando, C.H. 1994. Zooplankton, fish and fisheries in tropical fresh waters. Hydrobiologia, 272: 105-123. Gardner, W.S. and Scavia, D. 1981. Kinetic examination of
nitrogen release by zooplankters. Limnol. Oceanogr., 26: 801-810.
Green, B.W. 1992. Substitution of organic manure for pelleted feed in tilapia production. Aquaculture, 101: 213-222.
Harrison, I.J. and Senou, H. 1997. Mugilidae: Mullets. In: K.E. Carpenter and V. Niem (Eds.), FAO Identification Guide for Fishery Purposes, The
Western Central Pacific References No. 9812, 41-42. Hutchinson, G.E. 1967. A Treatise on Limnology. Vol. II.
Introduction to Lake Biology and the Limnoplankton. John Wiley and Sons, Inc., New York, USA, 660 pp. Ibrahim, A.M., Abd El-Hakim, N.F., Nagdy, Z.A. and Ali,
N.A. 2003. Effect of fish pond fertilization systems on water physico-chemical properties and phyto and zooplankton communities. (Ain Shams Univ.) J. Environ. Sci., 7(1): 107-133.
Jana, S.N., Garg, S.K. and Patra, B.C. 2004. Effect of periphyton on growth performance of grey mullet,
Mugil cephalus (Linn.), in inland saline groundwater ponds. J. Appl. Ichthyol., 20(2): 110-117.
Jeppesen, E., Jensen, J.P., Søndergaard, M., Fenger-Grøn, M., Bramm, M.E., Sandby, K., Møller, P.H. and Rasmussen, H.U. 2004. Impact of fish predation on cladoceran body weight distribution and zooplankton grazing in lakes during winter. Freshwater Biology, 49 (4): 432-447.
Katz, T., Herut, B., Genin, A. and Angel, D.L. 2002. Gray mullets ameliorate organically enriched sediments below a fish farm in the oligotrophic Gulf of Aqaba (Red Sea). Marine Ecology Progress Series, 234: 205-214.
Kobbia, I.A. 1982. The standing crop and primary production of phytoplankton in Lake Brollus. Egypt. J. Botany, 25 (1-3): 109-127.
Lazzaro, X. 1987. A review of planktivorous fishes: their evolution, feeding behaviours, selectivities and impacts. Hydrobiologia, 146: 97-167.
Lehman, J.T. and Sandgren, C.D. 1985. Species-specific rates of growth and grazing loss among freshwater algae. Limnol. Oceanogr., 30: 34-46
Lupatsch, I., Katz, T. and Angel, D.L. 2003. Assessment of the removal efficiency of fish farm effluents by grey mullets: a nutritional approach. Aquacult. Res., 34: 1367-1377.
Lynch, M. and Shapiro, J. 1981. Predation, enrichment and phytoplankton community structure. Limnol. Oceanogr., 26: 86-102
Mavuti, K.M. 1990. Ecology and role of zooplankton in the fishery of lake Naivasha. Hydrobiologia, 208: 131-140.
Northcote, T.G. 1988. Fish in the structure and function of freshwater ecosystems: a "top-down" view. Canad. J. Aquat. Sci., 45:361-3.
Odum, W.E. 1970. Utilization of the direct grazing and plant detritus food chains by the striped mullet Mugil cephalus. In: J.J. Steele (Ed.), Marine Food Chain. Oliver and Boyd, Edinburgh: 222-240.
Oren, O.H. 1981. Aquaculture of Grey Mullets. Cambridge University Press, New York, USA, 507 p.
Peters, R.H. and Downing, J.A. 1984. Empirical analysis of zooplankton filtering and feeding rates. Limnol. Oceanogr., 29: 763-784.
Porter, C.B., Krost, P., Gordin, H. and Angel, D.L. 1996. Preliminary assessment of grey mullet (Mugil cephalus) as a forager of organically enriched sediments below marine fish farms. Israel J. Aquaculture, 48: 47-55.
Prescott, G.W. 1961. Algae of the Western Great Lakes Area. W.M.C. Brown Company Publishers, Dubuque, IA, USA, 990 pp.
brackish water fishponds. In: O.H. Oren (Ed.), Aquaculture of Grey Mullet, Cambridge University Press, Cambridge, UK: 391-409.
Schroeder, G.L. 1974. Use of fluid cowshed manure in fish ponds. Bamidgeh, 26: 84-96.
Seymour, E.A. 1980. The effects and control of algal blooms in fish ponds. Aquaculture, 19: 55-74.
Shannon, C.R. and Weaver, W. 1949. The Mathematical Theory of Communication. Urbana University Press, Urbana, Illinois, 117 pp.
Sheehan, J.P. 1984. Effects of pollutants on community and ecosystem structure and dynamics. In: J.P. Shaheen, D.R. Miller, G.C. Butler and P. Bourdeau (Eds.), Effects Of Pollutants At The Ecosystem Levels. John Wiley Sons Ltd., New York: 51-99.
Stickney, R.R. 1979. Principles of Warmwater Aquaculture.
Talling, J.F. 1986. The seasonality of phytoplankton in African lakes. In: M. Munawar and J.F. Talling (Eds.), Seasonality of Freshwater Phytoplankton: A Global Perspective. Junk Publ., Boston, USA: 139-160.
Turker, H., Eversole, A.G. and Burne, D.E. 2003. Effect of Nile tilapia, Oreochromis niloticus (L.), size on phytoplankton filtration rate. Aquacult. Res., 34(12): 1087-1091.
Verity, P.G. 1986. Grazing of phototrophic nanoplankton by microzooplankton in Narragansett Bay. Mar. Ecol. Prog. Ser., 29: 105-115.
Wells, R.D. 1984. The food of grey mullet Mugil cephalus
L. in lake Waahi and the Waikato River at Huntly, New Zealand. J. Mar. Freshwater Res., 18(1): 13-19. Wetzel, R.G. 1983. Limnology. 2nd edition. Saunders