Copyright © The Author(s). All Rights Reserved. Published by American Research Institute for Policy Development DOI: 10.15640/jfbm.v7n1a1 URL: https://doi.org/10.15640/jfbm.v7n1a1
Corporate Ownership Structure and Cost of Raising Capital for Seasoned Equity Offerings
Jang-Shee Barry Lin
1, Bingsheng Yi
2, Chia-Wei Chen
3& Yi Ming Zheng
4Abstract
This paper examines the differences in announcement effects among Combined, Primary, and Secondary SEOs. Earlier studies suggest that primary SEOs might signal stock over-pricing, while secondary SEOs might increase misalignment of interests between insiders and shareholders. Theoretically, combined SEO might experience the negative incentive effects from both the primary and secondary SEOs. However, the empirical result is curious. We find that Primary SEO suffers the most negative 3-day cumulative abnormal returns (CAR) upon announcement, followed by Combined SEOs, while Secondary SEOs experience the smallest, but statistically significant negative 3-day CAR. To seek some explanation for this curious empirical result, we investigate the patterns of ownership among the three types of SEOs. Insider ownership is highest for combined SEO, while institutional ownership is highest for the secondary issues, with block ownership also highest for the combined SEOs. We argue that such differences in ownership structure at least provide some explanation to the reason why combined SEOs are not perceived to exhibit the negative incentive effects associated with both primary and secondary SEOs.
Keywords: Seasoned Equity Offerings, Ownership Structure, Announcement Effect 1. Introduction
Previous studies have found that stock market prices drop significantly, two to three percent points, when firms announce seasoned equity issue (see Asquith and Mullins (1986), Masulis (1986), Smith (1986), Jung, Kim and Stulz (1996), among others. Smith (1986) reports that the announcement day stock market reaction to equity issuance is about 2.88 percent more negative than the reaction to debt issuance. Bayless (1994) finds that the issue costs for equity would be 35.4 to 48.6 percent greater than those for a similar debt issue using Asquith-Mullin (1986) measure.5
Lee, Lochhead, Ritter and Zhao (1996) report that the total direct costs of seasoned equity issues are 7.11 percent of total proceeds on average, whereas the total direct costs of debt issues represent 2.24 percent of total proceeds. These empirical findings show that, in general, in terms of issuing costs, equity financing is costly and also more costly than debt financing. However, individually, a firm might issue equity because of other incentives.
In a paper looking at insider activities, Gokkaya and Highfield (2014) find evidence that announcement effects are negatively related to C-level executive insider sales, but unrelated to that of nonexecutive insiders. Roskelley and Gokkaya (2011) use amendments to SEO shares as a measure of revealed demand and find evidence that insiders use a demand-conditioned adjustment strategy on such amendments and act opportunistically to maximize their personal wealth in the SEO process. These empirical results point to differed incentives in how insiders determine and change the SEOs.
1 Khalifa University of Science and Technology, Abu Dhabi, UAE, barry.lin@ku.ac.ae
2 Department of Accounting & Finance, College of Business Administration and Public Policy, California State University - Dominguez Hills, Carson, California, USA, byi@csudh.edu
3 Tunghai University, Taichung, Taiwan, achen@thu.edu.tw
4 Boston University, Boston, Massachusetts, USA, ymzheng@bu.edu
Lee (1997) and Khale (2000) suggest that primary SEO issues can be signals of stock over pricing. Meyers and Majluf (1984) suggest that it can be a signal of lower expected future earnings. Jensen and Meckling (1976) argue that when insiders sell secondary shares, mis-alignment of interests between insiders and shareholders increases. Jung, Kim and Stulz (1996) suggest that mis-aligned interests might be a reason for negative announcement effects when investor fear that proceeds could be mis-used by managers. Related to this, Choe, Masulis and Nanda (1993) find less negative announcement effect when the economy is in expansion, implying lower likelihood of unproductive use of the proceeds. Mikkelson and Partch (1986) find that SEOs with proceeds designated for capital expenditures, rather than for debt refinance, are associated with less negative announcement effect. Dierkens (1991) finds evidence of a significant positive relationship between growth opportunities and announcement effect. Mola and Loughran (2004) and Intintoli and Kahle (2010) report a negative relationship between under-pricing and the relative issue size. Brazel and Webb (2006) find announcement effect to be more negative when CEO compensation includes more equity-based components.
The primary goal of this study is to expand earlier studies in an important direction: while most studies focus on only primary and secondary SEOs, there are a significant numbers of issue that combine both primary and secondary issues. Such issues had as yet not been explicitly investigated. Examining such combined issues and compare them to primary and secondary issues may yield valuable empirical result that compliment earlier findings. We also examine how ownership structure affects the outcomes of the issue. This paper proceeds as follows. Section 2 describe our data source and samples. Section 3 reports our empirical findings and Section 4 summarizes and concludes.
2. Data
Firms offering seasoned or equity over 1984-2002 period are selected from the Security Data Company (SDC) global new issues database. We eliminate firms issuing more than one times within a one year period. Firms in financial industry (sic 6000-6999) are excluded. Accounting data at calendar year end prior to security issue announcements are collected from research insight, and (-255, -46) pre-issue daily Stock return data are available from CRSP. Our final sample includes 522 primary seasoned equity issues, 157 secondary seasoned equity issues and 433 combined issues. Table 1 reports the list of variables, their definition and computation as well as the data sources.
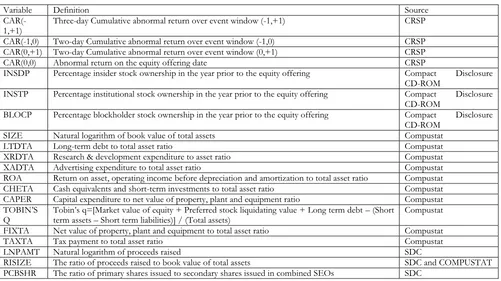
Table 1.Variable Description
Variable Definition Source
CAR(-1,+1) Three-day Cumulative abnormal return over event window (-1,+1) CRSP
CAR(-1,0) Two-day Cumulative abnormal return over event window (-1,0) CRSP
CAR(0,+1) Two-day Cumulative abnormal return over event window (0,+1) CRSP
CAR(0,0) Abnormal return on the equity offering date CRSP
INSDP Percentage insider stock ownership in the year prior to the equity offering Compact Disclosure
CD-ROM
INSTP Percentage institutional stock ownership in the year prior to the equity offering Compact Disclosure
CD-ROM
BLOCP Percentage blockholder stock ownership in the year prior to the equity offering Compact Disclosure
CD-ROM
SIZE Natural logarithm of book value of total assets Compustat
LTDTA Long-term debt to total asset ratio Compustat
XRDTA Research & development expenditure to asset ratio Compustat
XADTA Advertising expenditure to total asset ratio Compustat
ROA Return on asset, operating income before depreciation and amortization to total asset ratio Compustat
CHETA Cash equivalents and short-term investments to total asset ratio Compustat
CAPER Capital expenditure to net value of property, plant and equipment ratio Compustat
TOBIN’S
Q Tobin’s q=[Market value of equity + Preferred stock liquidating value + Long term debt – (Short term assets – Short term liabilities)] / (Total assets) Compustat
FIXTA Net value of property, plant and equipment to total asset ratio Compustat
TAXTA Tax payment to total asset ratio Compustat
LNPAMT Natural logarithm of proceeds raised SDC
RISIZE The ratio of proceeds raised to book value of total assets SDC and COMPUSTAT
The cumulative abnormal return is based on market model by regressing a firm’s daily return to value-weighted market index daily return over [-255, -46] period relative to the equity offering date. Compustat information is for the fiscal year end prior to the security offering year.
3. Empirical results and discussions 3.1. Summary statistics
Table 2 compares the announcement effect of the three types of SEO issues. It shows that debt issues have much lower offering costs than equity issues. Panel A reports the 3-day announcement effects, with the primary issues reporting a -2.69% drop, the secondary issues reporting a -0.61% drop and the combined issues reporting a -1.68% drop. In Panel B, we compare the mean announcement effects differences, and all three mean differences are statistically significant, with combined SEO issues out-performing primary issues by just over 1% and combined SEO issues under-performing secondary issues by just over 1%.
Table 2: Three-day Cumulative Abnormal Returns for Combined (CB), Primary (P), and Secondary (S) SEO's
Panel A: Summary statistics
Type of SEO # Obs CAR(-1, +1) Std. Dev. Min. Max.
Combined (CB) 433 -1.68% 7.78% -27.45% 25.93%
Primary (P) 522 -2.69% 7.90% -30.52% 27.97%
Secondary (S) 157 -0.61% 5.94% -13.34% 28.51%
Panel B: Difference in Mean Three-day CAR's between Types of SEO's
Diff. t-statistics p-value
CB - P 1.01% 1.9845 0.048
CB - S -1.07% -1.7691 0.078
P - S -2.08% -3.2746 0.001
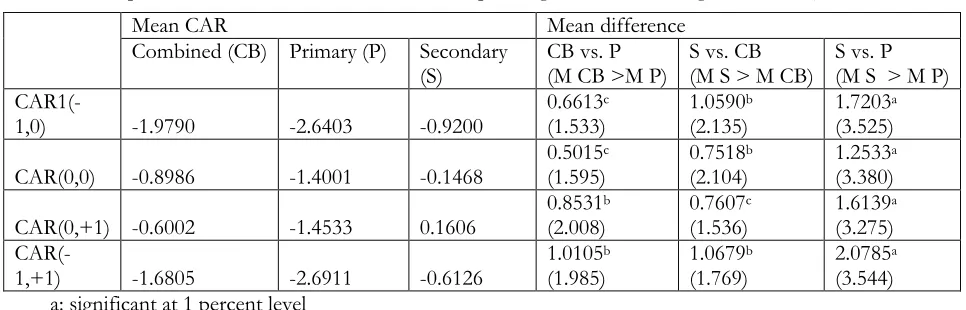
In Table 3, we report separately the 1-day performance for day -1, day 0 and day +1 of the issues, and we find similar patterns among the three types of issues, confirming the results in Table 2.
Table 3: Comparing CARs between Types of SEOs
(The value in the parenthesis is the t-statistic for the corresponding mean difference greater than 0)
Mean CAR Mean difference
Combined (CB) Primary (P) Secondary
(S) CB vs. P (M CB >M P) S vs. CB (M S > M CB) S vs. P (M S > M P)
CAR1(-1,0) -1.9790 -2.6403 -0.9200 0.6613
c
(1.533) 1.0590
b
(2.135) 1.7203
a
(3.525)
CAR(0,0) -0.8986 -1.4001 -0.1468 0.5015
c
(1.595) 0.7518
b
(2.104) 1.2533
a
(3.380)
CAR(0,+1) -0.6002 -1.4533 0.1606 0.8531
b
(2.008) 0.7607
c
(1.536) 1.6139
a
(3.275)
CAR(-1,+1) -1.6805 -2.6911 -0.6126 1.0105
b
(1.985) 1.0679
b
(1.769) 2.0785
a
(3.544) a: significant at 1 percent level
b: significant at 5 percent level c: significant at 10 percent level
can yield interesting insights. Suppose investors are worried about mis-use of the primary SEO proceeds by managers/insiders. This distrust of managers/insiders would likely be positively associated with a similar distrust that managers/insiders are selling over-priced shares in the secondary offer. Given above, one would expect the combined SEO issues to be associated with a more negative announcement effect than either the primary issue or the secondary issue along. Our finding that combined SEOs experience a less negative announcement effect than the primary issue, however, is contrary to the above argument. The fact that the announcement effect of combined SEO being less negative than the primary issue announcement effect indicate a different kind of perception or risk profile.
Table 4: Comparing CARs between Types of SEOs
The value in the parenthesis is the t-statistic for the corresponding mean difference greater than 0
Mean CAR Mean difference
Combined
(CB) Primary (P) Secondary (S) CB vs. P (M CB >M P) S vs. CB (M S > M P) S vs. P (M S > M P) CAR1(-1,0) -1.9790 -2.6403 -0.9200 0.6613
c
(1.533) 1.0590
b
(2.135) 1.7203
a
(3.525) CAR(0,0) -0.8986 -1.4001 -0.1468 0.5015
c
(1.595) 0.7518
b
(2.104) 1.2533
a
(3.380) CAR(0,+1) -0.6002 -1.4533 0.1606 0.8531
b
(2.008) 0.7607
c
(1.536) 1.6139
a
(3.275) CAR(-1,+1) -1.6805 -2.6911 -0.6126 1.0105
b
(1.985) 1.0679
b
(1.769) 2.0785
a
(3.544) a: significant at 1 percent level
b: significant at 5 percent level c: significant at 10 percent level
3.2. Determinants of the different announcement effects
To further investigate what factors might be driving the earlier empirical results, we compute mean value of key variables for the three types of issues and compare their mean. Table 5 reports the results of these comparisons.
Table 5: Comparing Firm Characteristics between Types of SEOs The value in the parenthesis is the t-statistic for the equality of mean
Variable Mean CAR Mean difference
Combined (CB) Primary (P) Secondary (S) CB vs. P
(M CB = M P) S vs. CB (M S = M CB) S vs. P (M S = M P)
Insdp 27.7902 20.1348 25.7674 7.6554
a
(5.284) -2.0208 (-0.889) 5.6326
a
(2.619)
Instp 22.0755 27.9476 34.9806 -5.8721
a
(-4.438) 12.9052
a
(6.462) 7.0331
a
(3.484)
Blocp 33.5972 29.9256 32.4452 3.6716
b
(2.026) -1.1519 (-0.429) 2.5196 (0.988)
Size 4.2036 4.6131 5.8490 -0.4094
a
(-4.450) 1.6454
a
(11.444) 1.2360
a
(8.015)
Ltdta 0.1612 0.1988 1.1948 -0.0375
a
(-2.936) 0.0336
c
(1.667) -0.0039 (-0.196)
Xrdta 0.0424 0.1094 0.0386 -0.0670
a
(-6.799) -0.0038 (-0.317) -0.0708
a
(-4.878)
Xadta 0.0202 0.0100 0.0146 0.0102
b
(2.547) -0.0056 (-0.958) 0.0046 (0.988)
Caper 0.3885 0.3417 0.3137 0.0468
a
(3.009) -0.0749
a
(-3.599) -0.0280 (-1.382)
ROA 0.1452 -0.0200 0.1741 0.1652
a
(8.924) 0.0290
c
(1.707) 0.1942
a
(8.494)
Cheta 0.1783 0.2284 0.1579 -0.0501
a
(-3.176) -0.0204 (-1.135) -0.0705
a
(-3.646)
Tobin's q 2.2092 2.6870 2.2715 -0.4778
c
(-1.870) 0.0623 (0.290) -0.4154 (-1.360)
Taxta 0.0395 0.0182 0.0454 0.0213
a
(10.641) -0.0059 (-1.639) -0.0272
a
(-9.477)
Fixta 0.2528 0.3001 0.2970 -0.0473
a
(-3.383) -0.0442
b
(-2.283) 0.0031 (0.1530)
LNPAMT 3.6287 3.6006 4.2988 0.0280 (0.4620) -0.6701
a
(-6.4853) -0.6982
a
(-6.5813)
RISIZE 0.8620 0.7373 0.3850 0.1246 (1.3104) 0.7351
a
(5.5045) 0.3523
a
(5.3946)
b: significant at 5 percent level c: significant at 10 percent level
While many of the comparisons show statistically significant differences in the mean of many variables, we focus on the ownership variables. For insider ownership, combined issues have the highest insider ownership, at 27.89%, and primary issues have the lowest mean insider ownership, at just over 20%. Secondary issues have a mean insider ownership at 25.76%, but the difference in mean insider ownership between the combined and secondary issues is insignificant, while the other two mean differences are both highly significant. Since combined and secondary issues have substantially higher insider ownership, one might argue that the interests between insiders and outside shareholders are more aligned than in the case of primary issues. This provide a possible explanation why the combined issue exhibit less negative announcement effect than the primary issues.
In terms of institutional ownership, secondary issues have the highest mean institutional ownership, at just under 35%, with the combined issues having the lowest mean institutional ownership, at just over 22%. All three mean differences are highly significant. This provides a reason why the secondary issues exhibit the least negative announcement effect that institutional ownership represents effective monitoring. With respect to block ownership, which is often perceived as opportunistic, combined issues exhibit the highest mean, with primary issues the lowest. Only the difference between the combined issues and the primary issues is statistically significant. If we consider block holders as the smart short-term opportunistic investors, then this provides a possible explanation why the combined issues show a less negative announcement effect than the primary issues.
4. Summary and conclusion
References
Asquith, P. & Mullins, D. (1986). Equity issues and offerings dilution. Journal of Financial Economics, 15, 61-89. Bayless, Mark E. (1994). The influence of predictability on differences in the market reaction to debt and equity issue
announcements. Journal of Financial Research, 17, 117-131.
Brazel, J. & Webb E. (2006). CEO compensation and the seasoned equity offering decision. Managerial and Decision Economics. 27, 363–378.
Choe, Hyuk, Masulis, R. E. & Nanda E. (1993). Common stock offerings across the business cycle: theory and evidence. Journal of Empirical Finance, 1, 3-31.
Dierkens, Nathalie. (1991). Information asymmetry and equity issues. Journal of Financial and Quantitative Analysis, 26, 181–99.
Gokkaya, S. & Highfield, M. J. (2014). Sales of secondary shares in SEOs: A comparison across top managers, other insiders, and outsiders. Financial Management, 43, 757–794.
Intintoli, V. J. & Kahle K. M. (2010). Seasoned equity offers: The effect of insider ownership and float. Financial Management, 39, 1575-1599.
Jung, Kooyul, Kim, Y., & Stulz, R. (1996). Timing, investment opportunities, managerial discretion, and the security issue decision. Journal of Financial Economics, 42, 157-185.
Kahle, K. (2000). Insider trading and the long-run performance of new security issues. Journal of Corporate Finance, 6, 25-53.
Lee, I. (1997). Do firms knowingly sell overvalued equity? Journal of Finance, 52, 1439-1466.
Lee, Inmoo, Lochhead, S., Ritter, J. and Zhao Q. (1996). The costs of raising capital, Journal of Financial Research, XIX, 59-74.
Mikkelson, W. & Partch M. (1986). Valuation effects of security offerings and the issuance process. Journal of Financial Economics, 15, 31-60.
Mola, S. & Loughran T. (2004). Discounting and clustering in seasoned equity offering prices. Journal of Financial and Quantitative Analysis. 39, 1-23.
Myers, S. & Majluf N. (1984). Corporate financing and investment decisions when firms have information that investors do not have. Journal of Financial Economics, 13, 187–221.
Roskelley, K. and Gokkaya S. (2011). Asymmetric revisions to primary and secondary shares in seasoned equity offerings. Midwest Finance Association 2012 Annual Meetings Paper. Available at SSRN:
http://ssrn.com/abstract=1787389 or http://dx.doi.org/10.2139/ssrn.1787389