Copyright: ©2017 The Author(s); Published by Shahid Sadoughi University of Medical Sciences. This is an
open-access article distributed under the terms of the Creative Commons Attribution License
Use of Failure Mode and Effects Analysis
in Improving Safety: A Case Study
in An Oil Company
Malihe Kolahdouzi1, Gholam Hossein Halvani1, Ebrahim Nazaripour Abdehgah1,
Maryam Rostami Aghdam shendi2, Mohsen Yazdani aval3
1. Department of Occupational Health Engineering, School of Public Health, Yazd Shahid Sadoughi University of Medical Sciences,Yazd, Iran.
2. Department of Occupational Health Engineering, School of Public Health, Tehran University of Medical Sciences, Tehran, Iran.
3. Department of Occupational Health Engineering, School of Public Health and Research Center for Health Sciences, Hamadan University of Medical Sciences, Hamadan, Iran.
ARTICLE INFO ABSTRACT
Original
Received: 1 Jan 2017
Accepted: 23 May 2017
Introduction: The Failure Mode and Effects Analysis (FMEA), first of all, identifies dangerous modes in a process and, then, provides proper control measures that are required to reduce the level of risk. This study aims to investigate the risk level before and after the implementation of control measures in an edible oil factory.
Methods: This cross-sectional study was conducted in an edible oil factory in Tehran, Iran. The FMEA technique was used to identify failure modes related to equipment that existed in five units of this factory. After that, in all units, Risk Priority Numbers of all the processes were assessed on the basis of the FMEA method. With regard to the Risk Priority Number (RPN), some control measures were taken to reduce the risk of events. After nine months, risk assessment was repeated, and primary and secondary RPNs were compared with each other to investigate the effects of interventions.
Results: The results showed that the highest probability of danger was related to the installation unit. The probability of danger in this unit before and after interventional actions was 4.5 and 3.25 respectively and the highest degree of severity was related to tool production. The marginal homogeneity test showed the positive effect of control measures on the risk level in the factory. There was a significant inference between before- and after-data in RPN in the unit tool production, neutralization unit, and installation unit. The Tests of Repeated Measure showed that there was a statistically significant inference between before- and after-data in the total average of RPN criterion (pvalue < 0.001).
Conclusion: It can be concluded that the high risk level in the factory units was reduced after the application of interventional corrective measures. These actions have been useful. It can be mentioned that the FMEA has been successfully able to identify and control the level of risk in this factory.
Keywords: Risk Assessment, FMEA, Edible oil factory, RPN Corresponding Author:
Mohsen Yazdani Aval [email protected]
How to cite this paper:
Kolahdouzi M, Halvani GH, Nazaripour Abdehgah E, Rostami Aghdam shendi M, Yazdani aval M. Use of Failure Mode and Effects Analysis in improving safety: A case study in an oil company. J Community Health Research. 2017; 6(2): 85-92.
Introduction
The identification of dangers to evaluate and manage risks is a crucial step in any working process. It helps managers define corrective actions and implement them to mitigate the risks. Based on this step, proper safety plans can be formulated as well. To achieve better safety performance in the process, more precise identification of dangers is necessary (1). There is a lot of methods to implement risk assessment, but it should be considered whether a method would be useful for this as a particular goal, and whether it is appropriate for the activities and processes in the system (2). The Failure Mode and Effects Analysis (FMEA) is a widely used technique, with the application of which manufacturers are able to improve the quality, reliability, and safety of their products (3). The technique is used to predict failures in working processes in several industries (3–6). The FMEA initially identifies dangerous modes in the process and then provides proper control measures required to reduce the risk level. On the other hand, the activity-related failure modes and their potential effects are identified with the help of this technique, and some control measures are proposed to eliminate or significantly reduce the likelihood of failure (3, 7). Many studies have shown that the technique is a powerful method to prevent the occurrence of accidents; it is used frequently in high-risk industries, such as aerospace and nuclear power plants (8). It should be noted that conducting the FMEA is a time-consuming process and the effective implementation of the technique to evaluate a process requires that some information be precisely gathered (9).
The edible oil factories are considered among the important industries in Iran. However, enough studies have not been conducted to identify and to assess dangers—and, more importantly, to control existing dangers in such factories. Therefore, safe work procedures in such industries are very essential. To achieve this goal, the identification of dangers and the risk evaluation of the dangers are among the major actions that should be
properly carried out. Moreover, proposing the proper control actions to reduce the risk level in the industry and taking actions to prevent probable events in future is necessary. In view of the above statements, this study aimed to identify the dangers, proposing corrective measures, and implementing as also evaluating the efficiency of the measures at an edible oil factory in Tehran, using FMEA.
Methods
This cross-sectional and interventional study was conducted in an edible oil factory in Tehran in 2014. The FMEA technique was used to identify failure modes related to the equipment in five units and to evaluate them in the factory. To achieve this goal, necessary coordination with the management team of the factory was carried out to achieve the requisite justifications to enter the units. It should be noted that the FMEA was used in the present study because the units in the factory that were studied comprised mechanical compartments instead of chemical processes.
After visiting and studying different parts of the factory, five units were selected for the implementation of FMEA, based on whether there was dangerous equipment in the units. Also, the prioritized duties related to equipment were considered, using the accident frequency rate (AFR). Using FMEA Worksheets (3), the risks involved in the units were examined in detail, and the likelihood, severity, and detectability of dangers—the three parameters required to calculate the RPN score—were quantitatively studied.
To identify dangers in the selected units, including the units for the production and filling of cans, tools production, neutralization, and installation, we evaluated workers’ duties and the ways in which these were done. We checked the current instructions and regulations in the factory, evaluated the documented data related to the accidents that had occurred in the past, inspected the units, and also held interviews with the workers and their supervisors. The likelihood of danger was determined on the basis of documents
that were available and the repeatability of failures related to the dangers was considered. The severity and detectability of dangers were also determined after considering the documented information. After achieving the scores for all three factors, the RPN score was calculated, using Equation 1 (RPN = Occurrence × Severity × Detection). Finally, the risks of identified dangers were prioritized using the RPN number and a team consisting of researchers, health, safety and environment (HSE) experts, a production engineer, and one of the most experienced workers argued about control measures. The team proposed some corrective measures, using brainstorming, which could mitigate the RPN for any danger.
Some of the most important corrective actions included the use of equipment and tools designed in a safer way, the elimination or limitation of dangers, the deployment of guards, the use of audio-visual alarm signs, the use of specific education programs and instructions, and, finally, the application of personal protective equipment (PPE). After nine months, we reevaluated the safety status of the units and RPN2 was again calculated for all the dangers and primary and secondary RPNs were compared with each other to investigate the effects of the interventions.
Statistical analysis:
For the descriptive and analytical analysis, SPSS 23 was used. We compared primary and secondary RPNs to evaluate changes in the risk levels.
we used the median as a central tendency to describe the parameters of danger, when the nonparametric Wilcoxon test was implemented for statistical analysis. The Marginal Homogeneity Test was used to compare primary and secondary RPNs before and after the implementation of corrective measures. To compare parameters of danger before and after interventions in all the units, the Tests of Repeated Measure were used and the variable unit was considered a disturbance variable. Tukey’s test was also used for the further analysis that was
required. To verify the accuracy of the results of the repeated measures model, Levene’s test of homogeneity of variances, Mauchly’s sphericity test, and the Q-Q plot for normality of residuals were used. The significance level was considered 0.1 for the nonparametric Wilcoxon test used for units with small sample sizes, and because of the weakness of the test to clarify probable differences between before- and after-data. The significance level was considered at 0.05 for parametric tests.
Results
In the interventional study, conducted in an edible oil factory in Tehran, the dangers (73 dangers) in five units of the factory were identified and the risk level was also evaluated using RPN equation before and after implementing corrective actions using FMEA.
The comparison of danger parameters before and after interventions in the factory:
The Tests of Repeated Measure were used to clarify differences between before- and after-data in probability and severity and the detectability of danger and RPN number in all units. The results showed that there was a statistically significant inference between before- and after-data in probability in all the units (p value < 0.001). There was also a significant inference between the average of probability in different units (p value = 0.08).
The paired sample T-test was used to clarify how the probability of danger was different from the others and in which unit. The results, according to Fig. 1, showed that the probability of dangers had a statistical significant inference in the installation unit with the can production unit (p value = 0.031).
There was a statistically significant inference between before- and after-data in severity in all the units (p value < 0.001). There was no significant inference between t he average of severity in different units (p value = 0.08). This means that the average of dangers in all units was similar.
The results showed that there was no significant inference before and after between
detectability of the average score in different units (p value < 0.124). There was also no significant inference between the average of detectability of danger in different units (p value = 0.133).
There was a statistically significant inference between before- and after-data in a total average of RPN criteria (p value < 0.001). But there was no statistically significant inference between before- and after-data in the average of RPN criteria in different units (p value = 0.077). This means that the average of dangers in all units was similar. The results are presented in Fig.1.
The comparison of danger parameters before and after interventions in different units:
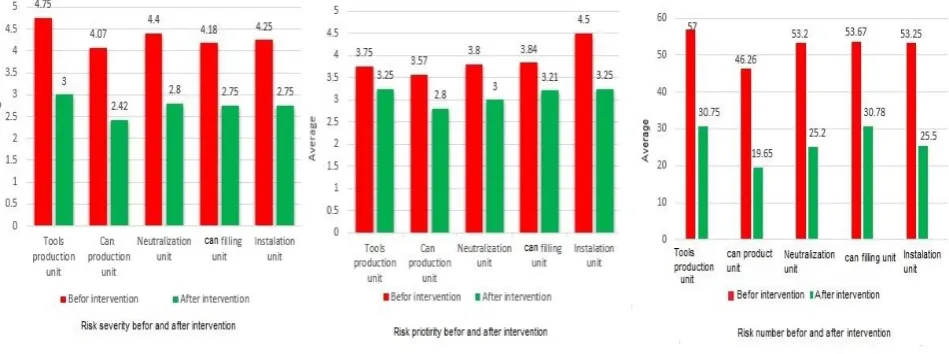
The results show that the highest degree of severity was related to the tool production unit and the average of the severity of danger in this unit before and after interventions was 4.75 and 3 respectively. The lowest amount of severity of danger was related to the can production unit, such that the amounts before and after intervention were respectively 4.07 and 2.42. The highest probability of danger was related to the installation unit. The probability of danger in this unit before and after interventional actions was
respectively 4.5 and 3.25. The lowest rate of this parameter was related to the can production unit and the numbers before and after interventional actions were respectively 3.6 and 2.8. The results are provided in Table 1.
The results showed that in the tools production unit, there is no statistically significant inference between before- and after-data in the probability criterion (p value = 0.1). In the two units— neutralization and installation—in contrast, there was a statistically significant inference between the before- and after-data in the probability criterion (p value = 0.059). In two units—can production and can filling—there was also a statistically significant inference between before- and after-data in probability criterion (p value < 0.001).
There was a statistically significant inference between before- and after-data in RPN in the unit tool production (p value = 0.066), neutralization unit (p value = 0.042), and installation unit (p value = 0.068). A significant inference was also seen between before- and after-data in RPN in the units of can production and can filling (p value < 0.001). The results are provided in Fig. 1.
Figure 1. The average of probability and severity of danger and RPN score before and after corrective actions in the units.
All the dangers identified in all the units with the minimum and maximum RPN scores are shown in Table 2. It is clear that the highest and lowest RPNs were respectively 80 and 4. The marginal homogeneity test was used to clarify the effects of interventions on the factory’s safety status. The test simultaneously tested the equality of marginal proportion for before- and after-, and the results show that there is a significant inference between marginal proportion (distribution) for before- and after- (p value < 0.001).
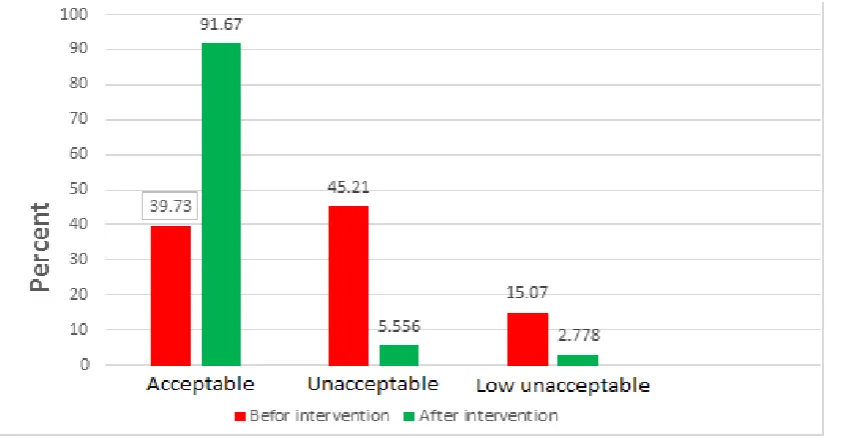
Considering these results, risk levels were categorized at three levels, including acceptable, relatively acceptable (with modifications), and unacceptable risk levels. The latter was categorized into three categories, including low, average, and high unacceptable
risk levels. Before implementing the control measures, low unacceptable risk level was 15.07%, and relatively acceptable and acceptable risk levels were 45.21% and 39.73% respectively. After the implementation of the control measures, the amounts of low unacceptable risk level and relatively acceptable risk level were reduced to 2.77% and 5.56% respectively while the amount of acceptable risk level increased to 91.67%. The results showed the positive effect of control measures on the risk level in the factory. The results are provided in Fig. 3. A control table was designed at the end of this study on the basis of the information obtained in the oil factory. The risk levels and RPN numbers were calculated and classified. The results are provided in Table 3.
Figure 2. Frequency of risk levels before and after the interventions.
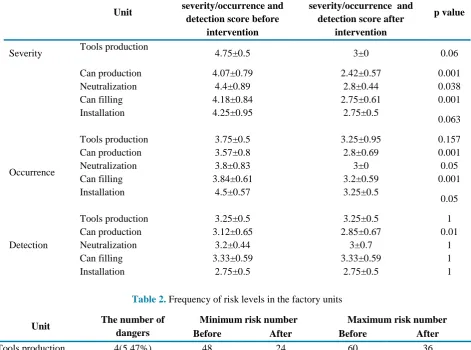
Table 1. Comparison of scores of occurrence and severity average before and after interventions in different units.
p value Average±STD of
severity/occurrence and detection score after
intervention Average±STD of
severity/occurrence and detection score before
intervention Unit 0.06 3±0 4.75±0.5 Tools production Severity 0.001 2.42±0.57 4.07±0.79 Can production 0.038 2.8±0.44 4.4±0.89 Neutralization 0.001 2.75±0.61 4.18±0.84 Can filling 0.063 2.75±0.5 4.25±0.95 Installation 0.157 3.25±0.95 3.75±0.5 Tools production Occurrence 0.001 2.8±0.69 3.57±0.8 Can production 0.05 3±0 3.8±0.83 Neutralization 0.001 3.2±0.59 3.84±0.61 Can filling 0.05 3.25±0.5 4.5±0.57 Installation 1 3.25±0.5 3.25±0.5 Tools production Detection 0.01 2.85±0.67 3.12±0.65 Can production 1 3±0.7 3.2±0.44 Neutralization 1 3.33±0.59 3.33±0.59 Can filling 1 2.75±0.5 2.75±0.5 Installation
Table 2. Frequency of risk levels in the factory units
Unit The number of dangers
Minimum risk number Maximum risk number Before After Before After
Tools production 4(5.47%) 48 24 60 36
Can production 26(35.6%) 18 4 80 48
Neutralization 5(6.84%) 36 18 80 36
Can filling 34(46.57%) 27 6 80 64
Installation 4(5.47%) 30 12 75 36
Table 3. Control levels
Range Risk level
60 > RPN > 45 Unacceptable
RPN < 45 As Low As Reasonably Practicable
( ALARP ) 60 ≤ RPN Acceptable Discussion
In the present study, the FMEA was used to identify and evaluate the risk of dangers in an edible oil factory in Tehran. After considering the probable occurrence of events based on the RPN scores, some corrective measures were implemented to reduce the risk level in the factory. The effects of the proposed measures were
evaluated by comparing primary and secondary RPN scores before and after applying the measures.
The results show that the highest risk level was related to the tools production unit. The average of RPN scores in this unit was 57 before interventions, and the score was reduced to 30.57 after the application of corrective measures. The
lowest average of RPN score was related to can production (46.39). After the implementation of the corrective actions, the score was reduced to 19.65. The results of the other studies— Khoshakhlagh et al. (10) and Pareek et al. (11)—have showed that the highest risk level was related to the installation unit. Similar results were observed in the present study, showing that there are instantaneously several risk factors and dangerous conditions (material and equipment for lubrication, welding, electric tools and splurge caused by repair of equipment), which together caused the results achieved in this unit.
The results of the present study showed that there is a statistically significant inference between RPN1 and RPN2. The results are in line with
the other studies (12, 13). These show that a proper risk assessment and implementation of the corrective actions could lead to a reduction in the RPN score.
Several corrective measure were taken in the present study. Some of the interventions included guarding, replacing tools and equipment, using personal protective equipment (PPE), limiting dangers by changing the distances between personnel and equipment, installing alarms and symbols such as auditory or visual warning alarms, and providing special instructions and educations programs. In a study, Bonfant et al. (14) showed that a significant reduction in the RPN score occurred after the implementation of some corrective measures at a hospital in Italy. It should be noted that some of the corrective measures—the use of specific operational instructions and procedures and educational programs for beginner workers— which were taken up in the present study—were similar to those taken in Bonfant et al.’s study (14).
In a study, Mohammadian and Hashemi Nejad
(9)
showed that the RPN score was reduced to near zero after corrective measures were applied. Hodaasadat Hosseini et al., in a study, showed that the RPN scores for three levels of risk—including low, average, and high risk levels—were 62.7, 31.6, and 5.7 respectively. After applying corrective measures in their study, the RPN scores for the low risk increased (30.6% more than the
primary score) and the scores for the two other abovementioned risk levels were reduced to 72% and 53% respectively, less than their primary scores. The results of the present study are in line with the two abovementioned studies (9). It can be concluded that the corrective measures that were implemented in this study had a useful effect on the risk level in the factory.
It should be noted that the involvement of the managers in the risk assessment process and the consideration of their viewpoints in offering corrective measures facilitated the implementation of the offers. The results of the present study showed that if the corrective measures proposed by researchers have taken into consideration the industry’s economic and physical conditions, convincing the manager to accept the offers becomes easier. The implementation of such corrective measures also minimized the potential risks by reducing the probability and probable consequences of dangers in an industry.
Conclusion
Finally, based on the findings of the present study, it can be concluded that the high risk level in the factory units that were studied was reduced after the application of interventional corrective measures. These actions have been useful. It can also be mentioned that the FMEA has been successfully able to identify and control risk levels in the factory.
It must be considered that the implementation of a proactive program to reduce the risk level of dangers in the processes is indispensable. One of the most important elements to prevent the occurrence of accidents in the industries is the use of appropriate safety programs. A good safety program, apart from describing the duties of all personnel in detail, can improve the level of responsibility of the people in an organization, including top managers, headmen, supervisors, and contractors. To achieve this goal, it has been necessary to use novel methods of assessment to monitor and evaluate all existing jobs, equipment, machinery, and behavior of personnel in the working project.
Acknowledgment
This article is extracted from Master’s Thesis. The authors would like to acknowledge the financial support of Yazd Shahid Sadoughi University of Medical Sciences. As well, the authors would like to appreciate all honorable
participants and the entire staff of the oil factory for their gracious cooperation.
Conflict of Interest
Authors declare that there is not any competing interest.
References
1. Ebrahimzadeh M, Halvani G, Mortazavi M, Soltani R. Assessment of Potential Hazards by Failure Modes and Effect Analysis (FMEA) Method in Shiraz Oil Refinery. Occupational Medicine Quarterly Journal. 2011;3(2):16-23. 2. Halvani GH ZM. Safety system engineering and risk management. Tehran: Asare Sobhan Publication; 2008.
3. Ebrahemzadih M, Halvani G, Shahmoradi B, et al. Assessment and Risk Management of Potential Hazards by Failure Modes and Effect Analysis (FMEA) Method in Yazd Steel Complex. Open Journal of Safety Science and Technology. 2014;4(3):127-135.
4. Paparella S. Failure mode and effects analysis: a useful tool for risk identification and injury prevention. Journal of Emergency Nursing. 2007;33(4):367-71.
5. MU SJ, JIANG Cm, WU Cg. The interrelationships between SDG and process hazard analysis. Acta Simulata Systematica Sinica. 2003;15(10):1381-84.
6. Chiozza ML, Ponzetti C. FMEA: a model for reducing medical errors. Clinica Chimica Acta. 2009;404(1):75-8. 7. Alimohammadi I, Adl J. The comparison of safety level in kilns in two gypsum production factories by Failure modes
and effects Analysis (FMEA). Iran Occupational Health. 2008;5(1):77-83.[Persian]
8. Ashley L, Armitage G, Neary M, et al. A practical guide to failure mode and effects analysis in health care: Making the most of the team and its meetings. The Joint Commission Journal on Quality and Patient Safety. 2010;36(8): 351-8.
9. Mohammadian M, Hashemi Nejad N. Hazard Analysis in Poly Van House Factory Using FMEA Method. Journal of Jiroft University of Medical Sciences. 2014;1(1):49-58. [Persian]
10. KHoshakhlagh A, Halvani Gh, Mehrparvar A, et al. Effectiveness of control measures to reduce the level of risk the dangers of working in the ceramics industry. tebe kar yazd. 2013;5(2):51-9. [Persian]
11. Pareek PK, Nandikolmath TV, Gowda P. FMEA Implementation in A Foundry In Bangalore To Improve Quality And Reliability.Mechanical Engineering and Robotics Search.2012;1(2):82-87.
12. Liu HT, Tsai Yl. A fuzzy risk assessment approach for occupational hazards in the construction industry. Safety science. 2012;50(4):1067-78.
13. Liao CJ, Ho CC. Risk management for outsourcing biomedical waste disposal–Using the failure mode and effects analysis. Waste management. 2014;34(7):1324-9.
14. Bonfant G, Belfanti P, Paternoster G, et al. Clinical risk analysis with failure mode and effect analysis (FMEA) model in a dialysis unit. JN journal of nephrology. 2010;23(1):111-118.