Vol. 6, No. 2, 2014 Article ID IJIM-00461, 8 pages Research Article
On the relative efficiency in general network structures
F. Boloori ∗, J. Pourmahmoud Gazijahani†‡
————————————————————————————————–
Abstract
Data Envelopment Analysis (DEA) is an efficiency measurement tool for evaluation of similar Decision Making Units (DMUs). In DEA, weights are assigned to inputs and outputs and the absolute efficiency score is obtained by the ratio of weighted sum of outputs to weighted sum of inputs. In traditional DEA models, this measure is also equivalent with relative efficiency score which evaluates DMUs in compare with the most efficient DMU. Recently network DEA models are appeared in the literature, which try to assess DMUs regarding their internal production divisions and intermediate products. In this paper we compare absolute and relative efficiency scores in network framework. Since in network DEA models, an efficient DMU does not exist necessarily, the relative efficiency model helps us to have at least one efficient DMU in our assessments.
Keywords: Network DEA; Absolute efficiency; Relative efficiency; Divisional efficiency; Overall effi-ciency.
—————————————————————————————————–
1
Introduction
D
Eof similar DMUs. All DMUs receive simi-A is a tool for measuring efficiency scores lar inputs to produce similar outputs, but within different amounts. In recent years, this method has been developed to the Network DEA mod-els [1]. Network DEA models not only consider to inputs and outputs as the external production factors, but also consider to internal structure of the DMUs and the internal production factors [2]. In fact, these models do not see DMUs just as black boxes which convert main inputs into main outputs. Network DEA models are now widely applied in different applications such as supply chain evaluations [3,4,5], banking industry [6] ,∗Department of Mathematics, Azarbaijan Shahid Madani University, Tabriz, Iran.
†Corresponding author. pourmahmoud @azaruniv.ac.ir
‡Department of Mathematics, Azarbaijan Shahid Madani University, Tabriz, Iran.
transportation network evaluation [7] and so on. They contribute internal divisions in their assess-ments and have more precise results. Network DEA was first introduced by Fare and Grosskopf [8]. Different models were appeared due to differ-ent network structures such as two-stage network structures [9,10] multistage [11], shared resource structures [12] series and parallel structures [13] in classifications in the literature. In different type of structures categories, different models are represented in multiplier and envelopment form which are not dual equivalent pairs. For instance see the models in [14, 15] and [16] for some in-stances in two-stage models.
Moreover, the models which are explicitly formu-lated for general network structures are stated in envelopment form [17,18]. Fukuyama and Mird-ehghan [19] and Chen et al. [20] reviewed some problems in efficiency scores in Tone and Tsutsuis model. Also Boloori et al. [21] investigated some pitfalls in Lozano’s model [17]. They explicitely formulated a multiplier model for general network
structure by following Kao [14] which considered a unique weight for a factor whatever it is used (either as an input or as an output). This multi-plier formulation is used in this paper in order to investigation on relative and absolute efficiency concepts in network DEA.
In DEA literature, the Absolute efficiency score for a DMU is defined by the ratio of its weighted sum of outputs to the weighted sum of inputs. This measure is commonly used in multiplier form of conventional DEA models. On the other hand, the relative efficiency score was first represented by Cooper et al. [22] and Thompson and Thrall [23]. The relative efficiency measure was defined in order to choose an optimal set of weights for a DMU which represents the assessed DMU in the best light in comparison to the other DMUs. Podinovski [24] mentioned that, in traditional DEA models [25] and in the absence of weight restrictions, the relative efficiency score coincides with the absolute efficiency score.
In this paper these efficiency scores are investi-gated in network DEA framework. Since one does not have an efficient DMU in network DEA mod-els necessarily, then the relative efficiency mea-sure helps us to have at least one 100 % efficient DMU in relative efficiency sense in our assess-ments.
The structure of the paper is organaized as fol-lows. Section 2 discusses on multiplier form of general network structures and its formulation represented in [21]. In Section 3 the absolute and relative efficiency scores in network struc-tures will be represented. Finally Section 4deals with an illustrative example which clarifies the abilities of this model.
2
Multiplier Model for General
Network Structures
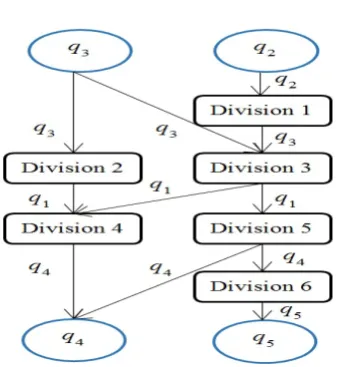
Based on the definition of general network struc-ture discussed in [21] , factors can simultaneously be the main or intermediate one and also they may be shared too. For more description consider Fig. 1 which depicts a network structure. Here an input or output factor may be shared among divisions. For instance input factor q3 is shared
among division 2 and division 3. Also output fac-tor q4 is produced from division 4 and division 5
cooperatively. In this figure, q2 is a main factor
only (as well as q5). But a main factor can be
used / produced as an intermediate factor too. For instance, factor q4 is an intermediate factor,
produced in division 5 for the use in division 6 . It is also a main output factor which is shared among division 4 and 5. Similarly factor q3 is
also main input and intermediate factor simulta-neously.
Figure 1: Example of a network structure
In order to formulating a general network struc-ture, let q = 1, ..., Q types of factors are flowing in the network either as main input/outputs or as intermediate ones. Also in division k, letMk, Nk be the set of main outputs and main inputs and also ˜Mk,N˜k to be the set of intermediate inputs and intermediate outputs of division k, respec-tively. Since a division may have inputs which are supplied both internally and externally, it is possible that Nk ∩N˜k ̸= ∅ for some division k. Also some outputs may be produced for internal use in another division of the network structure and also for external use as a final output. So, it is possible to haveMk∩M˜k̸=∅for some division
k. In fact, intermediate factors are not distinct from main factors necessarily and a factor in a division may be used / produced both internally and externally. Therefore the index set of factors are denoted by Mk, Nk,M˜k,N˜k as the subsets of
sets of factors can be defined by:
˜
Mk={q|∃h:k→qh} (a)
˜
Nk ={q|∃h:h→qk} (b)
Mk={q|q is a main output in div. k} (c)
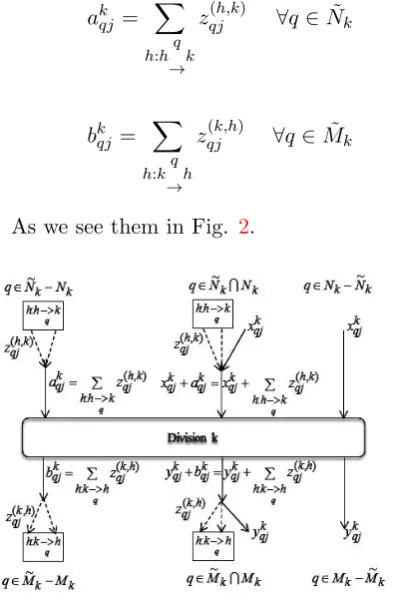
Nk ={q|q is a main input in div. k} (d) (2.1) Assume that there are j = 1, ..., J DMUs and each consists ofk= 1, ..., K production divisions. The flow amount of intermediate productq from division k to division h is denoted by zqj(k,h) . We may use the symbol k→qh to say that q flows from division k to division h, where needed. Also xkqj is the value of main input q devoted to division k in DMU j and ykqj is the value of main outputq produced by division k of DM Uj as the final output. Fig. 2 depicts a schema of a division in any general network structure. For brief notation, the amounts of intermediate factor q in division k which is used or produced are respectively denoted by:
akqj = ∑
h:hq
→k
zqj(h,k) ∀q∈N˜k
bkqj = ∑
h:kq
→h
zqj(k,h) ∀q ∈M˜k
(2.2)
As we see them in Fig. 2.
Figure 2: A division’s schema in a general network structure
Following Kao [13] , a unique weight is con-sidered for each factor whatever it is used. So
wq is used corresponding to q-th factor wherever it exists. So the divisional efficiency for general structures can be defined as below:
Definition 2.1 Absolute divisional efficiency score of division k in DMU j is defined by the ratio of weighted sum of outputs to the weighted sum of inputs (both main and intermediate factors):
AE.Divk.DM Uj =θ(j, k,w)
=
∑
q∈Mkwqy
k qj+
∑
q∈M˜kwqb
k qj
∑
q∈Nkwqx
k qj+
∑
q∈N˜kwqa
k qj
=
∑
q∈Mkwqy
k qj+
∑
q∈M˜k ∑
h:k→qhwqz
(k,h)
qj
∑
q∈Nkwqx
k qj+
∑
q∈N˜k ∑
h:h→qkwqz
(h,k)
qj
(2.3)
We denoteθ(j, k,w) byAE.Divk.DM Ujwhere needed. Also the overall efficiency as a mea-sure which deals with minimizing main input and maximizing main outputs can be defined as be-low:
Definition 2.2 Absolute overall efficiency score of DMUjis defined by the ratio of weighted mation of its main outputs to the weighted sum-mation of its main inputs:
AE.DM Uj =θ(j,w)
=
∑
q∈M
∑
k:q∈Mkwqy
k qj
∑
q∈N
∑
k:q∈Nkwqx
k qj
(2.4)
where N =∪kNk andM =∪kMk are the sets of
main inputs and main outputs respectively. Simi-larlyAE.DM Uj denotes toθ(j,w)where needed.
Note that since a main input or main output may be shared among division, their total amount for main DMU are ∑k:q∈N
kx
k qj or
∑
k:q∈Mky
the above definitions, the maximum absolute effi-ciency score of the under assessment DMU is as-sessed regarding s assigned to factors in divisions. So the model would be:
max{θ(o,w)|θ(j, k,w)≤1 ∀j, k} (2.5)
If the model becomes linear by Charnes-Cooper transformation [25] , the below model is obtained:
θ∗o = max∑ q∈M
∑
k:q∈Mk
wqyqok
s.t.∑
q∈N
∑
k:q∈Nk
wqxkqo= 1
∑
q∈Mk
wqykqj+
∑
q∈M˜k ∑
h:k→qh
wqzqj(k,h)
− ∑
q∈Nk
wqxkqj −
∑
q∈N˜k ∑
h:hq
→k
wqzqj(h,k) ≤0∀j, k
(2.6) Boloori et al. [21] introduced a unified dual pair of models for general network structures based on the above model. Since this multiplier model works for general network structures, we will use it as the base in this paper and by com-paring the absolute and relative efficiency con-cepts; we try to ensure having at least one effi-cient DMU.
3
Relative Efficiency In
Net-work DEA
As mentioned in the introduction, in network DEA models we may have not any 100% efficient DMU in contrast with conventional DEA mod-els. Therefore we use the relative efficiency con-cept as well as its definition in traditional DEA models[23]. Podinovski [24] mentioned that the relative efficiency and absolute efficiency scores coincide on each other in traditional DEA model in the absence of any weight restriction con-straint. This causes to have at least one efficient DMU in conventional DEA models. Here we de-fine similar definitions for relative efficiency of a DMU in network structures. Then we will see that the relative efficiency score introduces the at
least one %100 efficient DMU, while the absolute efficiency score do not do so necessarily.
Definition 3.1 Relative overall efficiency score of DMU j is defined by :
RE.DM Uj =
θ(j,w)
maxlθ(l,w) (3.7)
By the use of the definitions2.1,2.2and3.1we could have two types of models for evaluating the overall efficiency of a DMU as below which the first one measures the absolute overall efficiency score and the second one measures the relative overall efficiency score:
max AE.DM Uo
s.t: AE.Divk.DM Uj ≤1 ∀j, k
(3.8)
max RE.DM Uo
s.t: AE.Divk.DM Uj ≤1 ∀j, k
(3.9)
Note that we can define the relative divisional efficiency score similarly:
Definition 3.2 Relative divisional efficiency score of division k in DMU j is defined by:
RE.Divk.DM Uj =
θ(j, k,w) maxl θ(l, k,w)
(3.10)
Due to the definition of the relative divisional efficiency score, RE.Divk.DM Uj ≤ 1 are evi-dent constraints. So we did not add these in-equalities as the constraints in models (3.8) and (3.9). Model (3.8) is the same as model (2.6) stated before. In model (3.9) we should maxi-mize the relative overall efficiency of the under assessment DMU. In order to this, consider that
1
max
w βθ(o,w)
s.t: βθ(j,w)≤1
θ(j, k,w)≤1 ∀j, k
β ≥ϵ
(3.11)
Here β1 is considered as the minimum up-per bound for θ(j,w) ’s and it is positive. Equivalently β is greater than or equal to an Archimedean value ϵ. Substituting definitions 2.1, 2.2 and 3.1 in the above model and using Charnes-Cooper transformation yield to a NLP model as is brought in (3.12). So we have the following theorem:
Theorem 3.1 The relative overall efficiency score of the under assessment DMU in a network structure obtained by model (3.9) is equivalently obtained by model (3.12):
max β ∑
q∈M
∑
k:q∈Mk
wqykqo
s.t.∑
q∈N
∑
k:q∈Nk
wqxkqo= 1
β ∑
q∈M
∑
k:q∈Mk
wqyqjk ≤
∑
q∈N
∑
k:q∈Nk
wqxkqj ∀j
∑
q∈Mk
wqyqjk +
∑
q∈M˜k ∑
h:k→qh
wqz(qjk,h)
− ∑
q∈Nk
wqxkqj −
∑
q∈N˜k ∑
h:h→qk
wqzqj(h,k)≤0∀j, k
wq≥0, β≥ϵ
(3.12)
Model (3.8) or equivalently (2.6) has different results in compare with model (3.9) or equiva-lently (3.12) as the following Lemma indicates:
Lemma 3.1 The relative efficiency score in model (3.12) (or equivalently 3.9) is greater than or equal to the absolute efficiency score in model (2.6) (or equivalently 3.8).
Proof. It is enough to prove that the con-straints θ(k, j,w) ≤ 1 ∀j, k which are com-mon in both models imply that θ(j,w) ≤ 1 ∀j. Then, since β1 = maxj θ(j,w) and θ(j,w) ≤
1∀j we would have β1 ≤ 1 and consequently θ(j,w)
1/ β ≤ θ(j,w) which clearly indicates that
RE.DM Uj ≥AE.DM Uj . Now to see that con-straints θ(k, j,w)≤1 ∀j, kimply θ(j,w)≤1 ∀j
, consider their equivalent constraints:
∑
q∈Mk
wqyqjk +
∑
q∈M˜k ∑
h:k→qh
wqz
(k,h)
qj
− ∑
q∈Nk
wqxkqj −
∑
q∈N˜k ∑
h:h→qk
wqzqj(h,k) ≤0∀j, k
By the summation of these inequalities for all divisions, we will have the following inequality:
∑
k
∑
q∈Mk
wqykqj−
∑
k
∑
q∈Nk
wqxkqj
+[ ∑ k
∑
q∈M˜k ∑
h:k→qh
wqz(qjk,h)
−∑
k
∑
q∈N˜k ∑
h:h→qk
wqzqj(h,k)
]
≤0∀j
Tthe value in the bracket demonstrates the pro-duction of factor q as intermediate factor in all divisions minus its consumption in all division (multiplied by its price). So the barcket value clearly equals to zero. The remaining items im-ply that:
∑
k
∑
q∈Mkwqy
k qj
∑
k
∑
q∈Nkwqx
k qj
≤1∀j
This clearly indicates thatθ(j,w) ≤ 1∀j and by the descriptions stated at the beginning of the proof, we haveRE.DM Uj ≥AE.DM Uj .
In fact, In contrast with conventional DEA models, the relative overall efficiency score and the absolute efficiency score for a DMU are differ-ent in network structures. Clearly, the definition of the relative efficiency ensures the existence of at least one efficient DMU. The relative efficiency score in model (3.9) (or3.12) also may change the ranking of DMUs in compare with model (2.6) (or 3.8) too, as we will see in the next section.
4
Illustrative Example
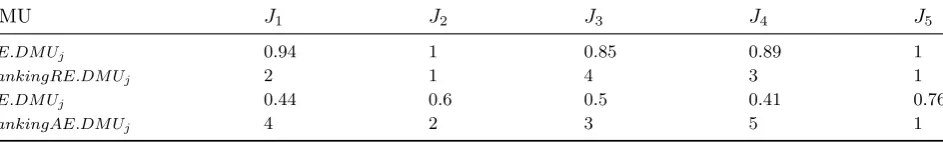
any efficient DMU. But by the use of model (3.9) (or equivalently 3.12) we have at least one effi-cient DMU (in this example we have 2 effieffi-cient DMUs). Also we see that, the relative efficiency scores in model (3.9) are greater than or equal to the absolute efficiency scores obtained in model (3.8) which verifies again the lemma proved be-fore. Consider five DMUs in a network structure as below:
Figure 3: Network structure used in a hy-pothetical example in [13]
The data set related to this network structure is as Table 1.
We applied models (3.12) and (2.6) and ob-tained the relative and absolute efficiency scores for these five DMUs. The efficiency measures and ranking of DMUs in each efficiency measure are reported in Table2.
As discussed later, the relative efficiency sore and absolute efficiency scores are different in net-work framenet-work in contrast with conventional DEA models. In model (3.12) there exists at least one efficient DMU (i.e. Relative overall efficient DMU). Also ranking orders of DMUs are changed as reported in above table. The relative efficiency scores are greater than or equal to absolute effi-ciency scores.
5
Conclusion
In network DEA models, there exist some pit-falls. We do not have efficient DMUs as well as conventional DEA models. Recently Boloori at al. [21] represented a dual pair of network DEA models to remove the duality pitfall in network DEA. In this paper, relative efficiency model was
investigated based on that dual pair of network DEA models. This model introduces at least one efficient DMU. The Lagrangian dual form of this model is represented for future studies.
References
[1] W. D. Cook, L. M. Seiford, Data envelop-ment analysis (DEA)- thirty years on, Eu-ropean Journal of Operational Research 192 (2009) 1-17.
[2] L. Castelli, R. Pesenti, W. Ukovich, A clas-sification of DEA models when the internal structure of the Decision Making Units is considered, Annals of Operations Research 173 (2010) 207-235.
[3] M. Tavana, H. Mirzagoltabar, S. M. Mirhe-dayatian, R. Farzipoor Saene, M. Azadi, A new network epsilon-based DEA model for supply chain performance evaluation, Com-puters and Industrial Engineering 66 (2013) 501-513.
[4] C. Chen, H. Yan, Network DEA model for supply chain performance evaluation, Euro-pean Journal of Operational Research 213 (2011) 147-155.
[5] L. Liang, F. Yang, W. D. Cook, J. Zhu,
DEA models for supply chain efficiency eval-uation, Annuals of Operational Research 145 (2006) 35-49.
[6] N. K. Avkiran, J. Zhu,Opening the black box of efficiency analysis: an illustration with banks, Omega 37 (2009) 930941.
[7] M. M. Yu, C. K. Fan,Measuring the perfor-mance of multimode bus transit: A mixed structure network DEA model, Transporta-tion Research Part E 45 (2009) 501-515.
[8] R. Fare, S. Grosskopf, Network DEA, Socio-Economic Planning Sciences 34 (2000) 35-49.
Table 1: Data set related to 5 DMUs in network structure of Fig. 3
J1 J2 J3 J4 J5
div1.q1 3 2 3 4 5
div1.q2 5 3 4 6 6
div2.q1 4 2 5 5 5
div2.q2 3 1 3 5 4
div3.q1 4 3 3 5 4
div3.q2 6 3 7 3 5
div1.div3.q3 2 1 1 1 1
div2.div3.q4 1 1 1 1 2
div1.q3 2 1 1 2 3
div2.q4 2 2 1 3 2
div3.q5 1 1 2 1 3 Table 2: Relative and Absolute efficiency scores and DMUs’ ranking
DMU J1 J2 J3 J4 J5
RE.DM Uj 0.94 1 0.85 0.89 1
RankingRE.DM Uj 2 1 4 3 1
AE.DM Uj 0.44 0.6 0.5 0.41 0.76
RankingAE.DM Uj 4 2 3 5 1
[10] W. D. Cook, L. Liang, J. Zhu,Measuring performance of two-stage network structures by DEA: a review and future perspective, Omega 38 (2010) 423-430.
[11] B. Golany, S. Hackman, U. Passy, An ef-ficiency measurement framework for multi-stage production systems, Annals of Opera-tions Research 145 (2006) 51-68.
[12] Y. Chen, J. Du, H. D. Sherman, J. Zhu,
DEA model with shared resources and effi-ciency decomposition, European Journal of Operational Research 207 (2004) 339-349.
[13] C. Kao, Efficiency decomposition in net-work data envelopment analysis: A rela-tional model, European Journal of Opera-tional Research 192 (2009) 949-962.
[14] Y. Chen, J. Zhu, Measuring information technologys indirect impact on firm perfor-mance, Infor Technol Manage J 5 (2010) 9-22.
[15] Y. Li, Y. Chen, L. Liang, J. Xie,DEA models for extended two-stage network structures, Omega 40 (2012) 611-618.
[16] C. Kao, S. N. Hwang, Efficiency decomposi-tion in two-stage data envelopment analysis:
An application to non-life insurance compa-nies in Taiwan , European Journal of Oper-ational Research 185 (2008) 418-429.
[17] S. Lozano, Scale and cost efficiency analy-sis of networks of processes, Expert Systems with Applications 38 (2011) 6612-6617.
[18] K. Tone, M. Tsutsui, Network DEA: A slacks-based measure approach, European Journal of Operational Research 197 (2009) 243-252.
[19] H. Fukuyama, S. M. Mirdehghan,Identifying the efficiency status in network DEA, Euro-pean Journal of Operational Research 220 (2012) 85-92.
[20] Y. Chen, W. D. Cook, C. Kao, J. Zhu,
Network DEA pitfalls: Divisional efficiency and frontier projection under general net-work structures , European Journal of Op-erational Research 226 (2013) 507-515.
[21] F. Boloori, M. Afsharian, J. Poormahmoud,
[22] W. W. Cooper, R. G. Thompson, R. M. Thrall, Extensions and new developments in DEA, Annals of Operations Research 66 (1996) 3-45.
[23] R. G. Thompson, R. M. Thrall,Polyhedral assurance regions with linked constraints, in: W.W. Cooper , A.B. Whinston (Eds.) (1994) 121-133.
[24] V. V. Podinovski, Side effects of absolute weight bounds in DEA models, European Journal of Operational Research 115 (1998) 538-595.
[25] A. Charnes, W. W. Cooper, E. Rhodes,Measuring the efficiency of de-cision making units, European Journal of Operational Research 2 (1978) 429-444.
Fatemeh Boloori is a Ph.D stu-dent in Azarbayjan Shahid Madani university in Operations Research field. She was graduated in Ms.C and Bs.C degree in Iran University of Science and Technology. She has published papers on Data Envelop-ment Analysis in Asia Pacific Journal of Opera-tioal Research and also different conferences.
![Figure 3: Network structure used in a hy-pothetical example in [13]](https://thumb-us.123doks.com/thumbv2/123dok_us/8877786.1817890/6.595.65.257.204.373/figure-network-structure-used-hy-pothetical-example.webp)