Evaluation
of
the
Mineral
Contents
in
Fish
Meal
by
FT
NIR
using
PLS
and
Kernel
PLS
S.MASOUM1,*,A.ALISHAHI2,M.SHEKARCHI3 AND H.FARAHMAND2
1Department of Analytical Chemistry, Faculty of Chemistry, University of Kashan, Kashan,
I. R. IRAN
2Department of Fisheries and Environmental Science, Tehran University, Karaj, IRAN 3Laboratory of Food and Drug, Sanitary Ministry of Iran, Tehran, IRAN
(Received May 1, 2011)
A
BSTRACT1 In the present work we study the use of Fourier transform near infrared spectroscopy
(FT-NIRS) technique to analysis the calcium (Ca), phosphorus (P) and copper (Cu) contents of fish meal. The regression methods employed were partial least squares (PLS) and kernel partial least squares (KPLS). The results showed that the efficiency of KPLS was better than PLS. As a whole, the application of FT-NIRS with PLS and KPLS was as a suitable option for replacing the routine chemical analysis to assess the mineral content in fish meal, allowing immediate control of the fish meal without prior sample treatment or destruction.
Keywords:Calcium, Phosphorus, Copper, Fish meal, FT-NIRS, KPLS
1 I
NTRODUCTIONFish meal industry plays an important role directly or indirectly in the nutrition and food quality for human nutrition. Fish meal is abundantly used in formulating the diets for animal which mostly is due to high level content of protein. The protein content of fish meal have several privileges in respect to the other portentous sources including high digestibility, palatability, amino acid balance, low level of anti nutritional compounds and unknown growth factor [1]. As a whole, fish meal is one of the most important ingredients in formulated aqua feeds, and particularly in shrimp feeds because shrimp and crustaceans need high content of protein with suitable digestibility and balanced amino acids that fish meal from this view is excellent [2].
Fish meal is composed from various compositions including protein, fat (particularly polyunsaturated fatty acids), pigments, vitamins and minerals, which are essential for the functioning of living beings, although the amounts supplied to animals must be present in the correct proportions since, on the one hand, deficiencies in these essential components lead to diseases such as anemia, disorder in the functioning of enzymes, disturbance in the absorption of nutrients in intestine, incorrect operation of reproductive apparatus (organs), decrease in the immunity of defense system of the body, delays in growth, etc., while one the other hand their excess consumption brings about intoxication, the accumulation of such compounds in the organism, auto-oxidation of fat, immunosuppression effect and the other malfunctioning. Thus the importance of these essential compounds in the diet is the same as the suitable amounts of the nutrient and generally the best formulation of the diet for the target organism ultimately causing safety and health of reared animals [3]. Many element, which are present in seafood [4] are indispensable for human healthy only at low concentration [5], however, they can be toxic at high concentration [4, 5].
The ash (mineral) content of fish meal can range from 10 to 25%. Fish meal is an excellent source of calcium, phosphorus and copper for animal feeding. The copper content in fish meal is crucial from point of view of pollution index because in the contaminated realms, the accumulation of copper in the tissue increases which this phenomenon is so-called bioaccumulation. Thus it is obvious that copper content in addition of nutritional value, have important role in pollution index. As a whole, mineral (ash) content in fish meal affiliate to the origin of fish or aquatic organism to produce the fish meal. For example, mineral content of the fish meal produced by whole fish in less than it produced by by-catch or fish and crustacean leftover [6]. The higher ash content is usually an indication of a higher calcium, phosphorus and copper level. The calcium, phosphorus and copper are in a highly available form, unlike some of calcium, phosphorus and copper in plants protein that bioavailability of the essential nutrients is more critical than the amounts of the nutrients in diet [7].
utilizing the kernel function corresponding to the inner product in the feature space, F [8]. The aim of the present work was to explore the potential and accuracy of FT-NIR for predictions of Ca, P, and Cu in fish meal without prior sample treatment, using direct application of the NIR.
2. E
XPERIMENTAL2.1. FTNIR Spectroscopy
A FT-NIR Systems (Bomem, 450 St-Iean Baptiste, Quebec PQ Canada G2E 5S5, Version 1, 1994) fitted for the spectrum analysis. Samples were collected from the plants in north and south of Iran. Near infrared spectra (1000-2500nm) of whole fish meal were scanned in triplicate with the Bomem M & MB. The sample was filled into standard Petri dishes. The measurement cell used is the beaker, which measures samples in Reflection. Each sample was scanned 64 times and the data obtained was averaged. The software used was Bomem-GRAMS/32 which has been installed on the Pentium III computer.
All computations and chemometric analyses were executed with programs in Matlab v7.2 (The Mathworks, Inc., Natick, MA, USA). All calculations were performed on a 3.40 GHz Pentium IV with 1 GB of RAM.
3. T
HEORY3.1. Partial Least Squares (PLS)
PLS was originally developed to achieve two main objectives: to approximate X and Y accurately, and to model the relationship between X and Y [9]. Details on the PLS algorithms can be found in Ref. [10].
PLS regression is a technique for modeling a linear relation between two data sets (blocks of observed variables). Denote by xRN an N-dimensional vector of variables in the first block of data and similarly yRM denotes a vector of variables from the second set. PLS models the relations between these two blocks by means of latent variables. Observing n data samples from each block of variables, PLS decomposes the (n N) matrix of zero mean variables X and the (nM) matrix of zero mean variables Y into the form
X = TPT + F (1)
where the T, U are (np) matrices of the extracted p score vectors (components, latent vectors), the (Np) matrix P and the (M p) matrix Q represent matrices of loadings and the (n N) matrix F and the (n M) matrix G are the matrices of residuals.
The PLS regression model can be expressed with regression coefficient B and residual matrix R as follows:
Y = XB + R (3)
B = W (PTW)-1CT (4)
where P (Nk) is the matrix consisting of loading vectors pi =XTti / (tiTti) i =1, . . . , k.
Due to the fact that piTwj =0 for i >j and in general piTwj ≠ 0 for i <j, the matrix
PTW is upper triangular and thus invertible [11]. Moreover, using the fact that tiTtj =0 for
i≠j and tiTuj =0 for j >i, Rännar et al. [12] derived the following equalities:
W = XTU (5)
P = XTT (TTT )-1 (6)
C = YTT T(TTT )-1 (7)
Substituting Eqs. (5)–(7) into Eq. (4) using the orthogonality of the matrix T columns, we can write the matrix B in the following form:
B = XTU (TTXXTU)-1TTY (8)
which will be used to make predictions in PLS regression.
3.2. Kernel Partial Least Squares (KPLS)
In kernel PLS regression a linear PLS regression model in a feature space F is considered. KPLS is formulated in this feature space to extend linear PLS to its nonlinear kernel form.
First, consider a nonlinear transformation of the input variables xi, i =1,. . ., n into feature space F: XiRN→Φ (xi) F where it is assumed that
kN1
xk 0, and Φ(.) is anonlinear mapping function that projects the input vectors from the input space to F. Note that the dimensionality of the feature space is arbitrarily large, and can even be infinite. Denote Φ as the (nS) matrix whose i-th row is the vector Φ(xi) in an S dimensional feature space F. As shown in Table 1, the KPLS algorithm is directly derived from the PLS algorithm by modifying steps 2 and 3 of the PLS procedure so as to use the matrix Φ of mapped input data instead. Through the introduction of the kernel trick, Φ(xi)TΦ(xj)=K(xi, xj), one can avoid both performing explicit nonlinear mappings and computing dot products in the feature space. Note that ΦΦT represents the (nn) kernel Gram matrix K of the cross dot products between all mapped input data points Φ(xi), i =1,. . ., n.
The deflation of the ΦΦT = K matrix after extraction of the t component is now given by:
As in Eq. (8), the matrix of the regression coefficient B in the KPLS algorithm will have the form:
B = ΦTU (TTKU)-1TTY (10)
As a result, when the number of test data is nt(1,. . .,nt), the predictions on training data and test data can be made as follows, respectively:
Ŷ= ΦB = KU (TTKU) -1TTY (11)
Ŷ= Φt B = KtU (TTKU) -1TTY (12)
Here, Φt is the matrix of the mapped test points and is Kt the (ntn) test matrix whose elements are Kij =K(xi, xj), where xi is the i-th test vector and xj is the j-th training vector. Before applying KPLS, mean centering in the high dimensional space should be performed. This can be done by substituting the kernel matrices K and Kt with Ќ and Ќt,
where
Ќ = (I - 1n1nT/n) K (I -1n1nT /n) (13) Ќt = (Kt - 1/n 1nt1nT K) (I -1/n 1n1nT) (14) Here, I is an n-dimensional identity matrix and 1n, 1nt represent vectors whose elements are ones, with length n and nt respectively. There exist a number of kernel
functions. Representative kernel functions are given below:
Polynomial kernel: k (x, y) = <x, y>d (15) Sigmoid kernel: k (x, y) =tanh (β0 <x, y> + β1) (16)
Radial basis kernel: k (x, y) = exp (-║x- y║/c) (17) where d, β0, β1,and c are specified a priori by the user.
Table 1. Comparison of the PLS and KPLS algorithms
PLS Kernel PLS
1 Randomly initialize u Randomly initialize u
2 w = XT u t =ΦΦT u = Ku t←t /║t║ 3 t = Xw
t←t /║t║
4 c = YTt c= YTt
5 u = Yc u = Yc
u←u /║u║ u←u /║u║
6 Repeat steps 2, 3, 4, Repeat steps 2, 3, 4, and 5,until convergence and 5, until convergence 7 Deflate X, Y matrices: Deflate K, Y matrices:
4. R
ESULTS ANDD
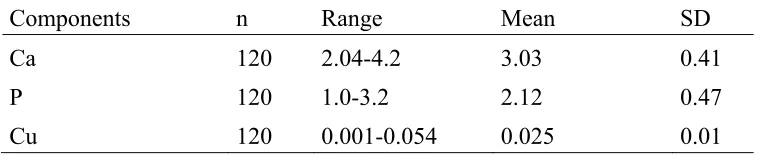
ISCUSSIONChemical analysis was implemented according to the Martin et al. [3]. The characteristics of reference data were displayed in the Table 2. Of interest in this table are the elevated standard deviations for Ca and P, owing to the variability in the composition of the samples, probably as a consequence of using several fish species during the fish meal processing.
Table 2. Statistical results of chemical analyses (all units in gr/100gr samples)
Components n Range Mean SD
Ca 120 2.04-4.2 3.03 0.41
P 120 1.0-3.2 2.12 0.47
Cu 120 0.001-0.054 0.025 0.01
To resolve the difficulties of relevance with noises; pre-treatment of the original spectra takes place using from standard normal variates (SNV). The utilization of the SNV method brings about which obviates multiplicative interferences, particle size, the change of light distance and curvilinearity. Also it rectifies multiplicative and additive impacts [13]. The original spectra and their mean cantered spectra and also standard normal variates transform (SNV).
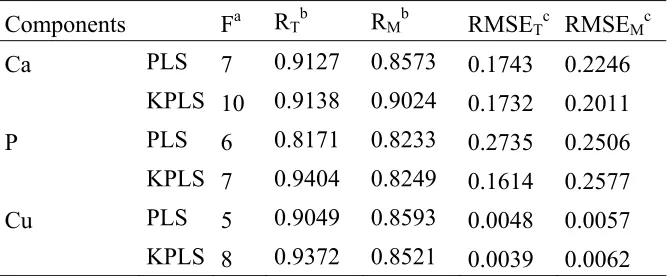
After the pre-treatment of the spectra and increasing their resolution, the next step meaning to build calibration models was implemented to predict the interested components in fish meal. In this research to make the calibration models was used from Kernel Partial Least Square (KPLS). KPLS have more efficient in building the calibration models than PLS because of its non-linearity nature. To obtain suitable calibration models, the samples divided into two groups consisting of training set, monitoring set and validation set. The numbers of samples in the training and monitoring sets were 60 and 35 respectively. The results of multivariate analysis of partial least square (PLS) and kernel partial least square (KPLS) are summarized in Table 3.
in the low wavelength gives more precise information about the components [15].
Table 3. The results of PLS and KPLS analysis
Components Fa RTb RMb RMSETc RMSEMc
Ca PLS 7 0.9127 0.8573 0.1743 0.2246
KPLS 10 0.9138 0.9024 0.1732 0.2011
P PLS 6 0.8171 0.8233 0.2735 0.2506
KPLS 7 0.9404 0.8249 0.1614 0.2577
Cu PLS 5 0.9049 0.8593 0.0048 0.0057
KPLS 8 0.9372 0.8521 0.0039 0.0062
a Number of latent variable
b Correlation coefficient of training (T) and monitoring (M) sets c Root mean of square error of training (T) and monitoring (M) sets
5. C
ONCLUSIONSThe results of this investigation demonstrate that the application of FT-NIR using multivariate analyses is very beneficial and efficient to assess quantity of Ca, P and Cu in fish meals. The method is easier than routine chemical analyses. This procedure is time consuming and from the cost facets is lucrative.
ACKNOWLEDGMENT
.
The authors are grateful from Dr. Pirali, the head of the food anddrug center in the sanitation ministry of Iran. Also the authors appreciate from the chairman of the environmental and fisheries department and M. Abasi and S. Fekri.
R
EFERENCES1. A. Zugarramurdi, M.A. Parin, G.A. Carrizo, L. Gadaleta and H.M. Lupin, Investment and production costs for fishmeal plants in developing and developed countries, Int. J. Prod. Econ. 76 (2002), 53-59.
3. A.M. Martın, A.V. Alvarez-Garcia, C.G. Perez and V. Garcıa, Determination of inorganic elements in animal feeds by NIRS technology and a fibre-optic probe, Talanta 69 (2006), 711-715.
4. J. Oehlenschlager, Marine fish – a source for essential elements? In: J.B. Luten, T. Börresen, J. Oehlenschläger (Eds.), Seafood from producer to consumer, Integrated approach to quality. Elsevier Science BV, Amsterdam, 1997.
5. S. Frauostro and R.J.P. Willam The biological chemistry of the elements the inorganic chemistry of life. Clarendon Press, Oxford, 1993.
6. Z.E. Sikorski, A. Gildberg and A. Ruiter, Fish products: fish and fishery products. CAB International,Wallingford, United Kingdom, 1995.
7. D.M. Richard and J.P. Jacqueline, Methods of the assessment of mineral in feeds. 2003, Web site at http://edis.ifas.ufl.edu.
8. R. Rosipal, L.J. Trejo, Kernel partial least squares regression in reproducing Kernel Hilbert space, J. Mach. Learn. Res. 2 (2001), 97– 123.
9. K. Kim, J. M. Lee and I. B. Lee, A novel multivariate regression approach based on kernel partial least squares with orthogonal signal correction, Chemom. Intell. Lab. Syst.79 (2005), 22 – 30
10. P. Geladi and B.R. Kowalski, Partial least squares regression: a tutorial, Anal. Chim. Acta 185 (1986), 1 –17.
11. A. Höskuldsson, PLS regression methods, J. Chemom. 2 (1988), 211– 228.
12. S. Rännar, F. Lindgren, P. Geladi and S.Wold, A PLS kernel algorithm for data sets with many variables and fewer objects. Part 1: theory and algorithm, J. Chemom. 8 (1994), 111 – 125.
13. M. Uddin, E. Okazaki, M. Ahmad, Y. Fukuda and M. Tanaka, “NIR spectroscopy: A non-destructive fast technique to verify heat treatment of fish-meat gel”, Food Control 17 (2006), 660–664.
14. W. Small, “Chemometrics and near-infrared spectroscopy: Avoiding the pitfalls”, Trends Anal. Chem. 11 (2006), 1057-1066.