Determination, Modeling and Optimization of Distillation
Equilibrium of Fermented Palm Wine
BY 1
AGHALU K.,
2KAMALU C.I.O., *
3OBIJIAKU J.C.,
4KAMEN F.L.,
5
OBIBUENYI J.I.,
6ADEYEMO O.E.
Department of Chemical Engineering, Federal University of Technology, Owerri, Nigeria.
ABSTRACT : This research work was done using palm wine as a source of fermentable sugar. Equal sample of the palm wine was fermented aerobically by baker’s yeast under standard atmospheric condition for consecutive series of 1 to 15 days. Testing and Distillation of liquor was done on each day to determine the amount of fatty acid, PH, sugar, specific gravity and vitamin C, with time during fermentation on one hand and the equilibrium mole fraction relationship for ethanol and water on the other hand. Models were developed to predict the reproduction of the experimental values into future, and, on validationgave R2 which ranges from 0.9901 to 0.9980. On optimization it was revealed that in 1.49 days, 0.1067 percentage fatty acid was produced. With 1.44 percentage mole fraction of ethanol, 3.398 refractive index of palm wine was obtained. It also showed that a minimum of 0.07305 refractive index of distillate per mole fraction of more volatile component was made in just 0.499 percentage mole fraction and a minimum of 0.1956 mole fraction of gaseous ethanol per mole fraction of more volatile component was obtained. The results and models can be applied in the distillation work of this kind for prediction and reproduction of experimental values.
Key Words: Palm wine, fermentation, modeling, optimization.
I. INTRODUCTION
Palm wine has been used locally in Nigeria for ethanol production by rural farmers. Palm wine is an alcoholic beverage obtained from the sap of various species of palm tree and is common, in various part of Africa. In Nigeria, it is abundant in the Niger delta regions and collected by wine tappers. Typically the sap is collected from the cut flowers of the palm tree by a container which is fastened to the flower stump to collect the sap. The wine liquid that initially collects tends to be very sweet and non-alcoholic before it is fermented.
Palm wine (saccharamyces species) has been used for bio-ethanol production at industrial level, and in this work, it is used as the source of fermentable sugar.
This research work covered three stages or processes namely:
(I) Collection and fermentation of palm wine (II) Testing and Distillation of the fermented palm wine and (III) finally modeling and optimization of the results obtained from second stage of the process.
The primary aim of fermentation in this work is to convert the sugar contained in the palm wine to an alcohol (Ethanol) or an acid (Acetic acid) by using yeast, bacteria or a combination there of. Other products that can be gotten from fermentation include lactate and carbon dioxide. The products of fermentation are the basic raw industrial products such as antibiotics, Vitamins, feed supplements and blood plasma expanders etc. Ethanol which is one of the products of fermentation plays a vital role in the economic development of a nation. It can be used as a solvent in extraction process, as an intermediate in the production of liquid detergents, polishes, plasticizers and cosmetics, also as anti-freezers and as fuel.
mixture into two or more fractions, based on difference in compositions in liquid phase mixtures of different components into a number of fractions of differing compositions. The objective is usually to separate the solution (mixture) into its components which have negligible contamination or absolutely pure. This separation can be achieved only when there is a difference in composition between a liquid mixture and the vapour in equilibrium above it.
The difference in composition may be analyzed in terms of volatility, vapour pressure or even distribution coefficient. Distillation is thus based on the difference in equilibrium composition between the vapour and liquid phases of a mixture at essentially the same temperature and pressure for the co-existing zones.
Finally, modeling and optimization aspect of the work was carried out. The models were produced as a means or an alternative that should be used in the reproduction of the experimental values.
Fermentation is the metabolic conversion of a carbohydrate such as sugar into an alcohol or an acid using yeast, bacteria or a combination there of. It is also the slow decomposition of organic substances induced by micro-organism or by complex nitrogenous substances (enzymes) of plant and animal origin. Fermentation could occur under anaerobic or aerobic conditions and yields lactate, acetic acid, ethanol, carbon dioxide or some simple products.
The major concern of this research was to establish a true and reasonable equilibrium mole fraction relationship for ethanol and water in one hand and their models and optimizations on the other hand. The research work will also show the behaviors or variation of fatty acid, pH, sugar, and Vitamin C (ascorbic acid) with time during the fermentation of palm wine, and also produced a true and reasonable model for these relationships.
The purpose of this research work was to establish a standard vapour liquid equilibrium curve for water and also for ethanol. The curves represent, toa great deal of accuracy, the general trends in the behavior of liquid ethanol in equilibrium with its vapour, and also the behavoiur of liquid water in equilibrium with its vapour.
Finally, the produced models were aimed at making people get their results easily when working on this topic than passing through the rigorous process of experimental procedures each time.
More so, areas mapped out for treatment will be comprehensively examined. Palm wine will only be obtain from palm trees and no other sources of palm wine, such as, raffia palm trees in this work.
The distillation and fermentation process cut cross many sections of our economy in the following ways:
The methods are also employed in the manufacturing of alcoholic drinks.
The methods are also employed in
production of antibiotics, vitamins, blood plasma expanders etc.
The methods are used in the production of food supplements.
Ethanol which is one of the products of fermentation could be used directly as a solvent for extraction purposes, as an intermediate in the manufacturing of liquid detergents, plastic polishes, plasticizers and cosmetic, as antifreeze and as fuel.
The models produced can also be used for the purposes listed below:
It can be used in making predictions when fermenting palm wine.
Used to explain some phenomena that are concerned with the fermentation and distillation of palm wine.
Be used as bases for decision making whenever there is a need of this types of work.
Communication between a researcher and the hidden secrets of the work itself. Will alleviate the problem of time wastage
that is involved in the experimental procedures of this work.
II. EXPERIMENTATION, MODEL DEVELOPMENT AND OPTIMIZATION 2.1 Materials
2.1.1 Collection of palm wine
The palm wine used for this experiment was obtained from Ohukabia village in Awo-Idemili, Orsu Local Government Area of Imo State.
the palm wine, hence ensuring greater accuracy of result.
2.1.2 Apparatus/Reagents used
Refractometer,thermometer,pH meter,measuring cylinder,conical flasks(4),beakers(7),burettes(2) 50𝑚𝑙 ,calibrated buckets(3), glass and rubber funnels, pipettes (2) 25𝑚𝑙, electric boiler, manual stove, retort stand, petri-dish, distillation apparatus, cold water(distilled water), palm wine, Baker’s yeast, Fehling solution(type A), ascorbic acid, dye solution, methylene blue-indicator, glacial acetic acid, methyl orange-indicator, anhydrous sodium carbonate, chloroform indicator.
2.2 Experimental Procedure 2.2.1 The Fermentation Procedure
Twelve (12) sample of the fresh palm wine each of 250ml in conical flasks were kept open, in a cupboard and allowed to ferment aerobically under standard atmosphere temperature and pressure.
Equal amount (2g) of barkers yeast
(sacchromycescerevisiae) was added to each sample. The fermentation lasted for a period of 1, 2, 3, 4………..12 consecutive days.
All the analysis to determine the variation in the physical and chemical compositions were carried out at a regular interval of 24hrs for each sample before distillation, but before the introduction of 2g of yeast in the samples of palm wine on the first day, the fresh palm wine was lasted and analyzed to determine its physical and chemical variation.
2.2.2 Distillation procedure
The component of the distillation apparatus were assembled by mounting the distillation flask onto an electric heater connected to a power source with a thermometer inserted into the flask to determine the distillation temperature as clamped onto a retort stand with a flow of a coolant connected counter currently to the flow of the vapour coming into the condenser. A conical flask was also fixed at the mouth of the condenser in order to collect the condensed vapour during boiling. And before any commencement of healthy operation the counter current flow of water in the condenser was tested. Different samples of the fermented palm wine solution (mixtures of ethanol and water) whose physical and chemical compositions had been determined were then heated, and, passing water counter-currently in the condenser. The vapour emanating from the flask were condensed and collected in a conical flask. The temperature at which the first drop of the distillate came out was noted as the required distillation temperature and this temperature was held constant through the distillation in each case. The volume of the condensate (distillates as well as residues were taken while their respective refractive indices were also noted and recorded. This procedure was performed for 12 (twelve) consecutive days using different proportions of sample fermented.
2.2.3 Test for sugar (sucrose)
2.5ml of Fehling solution (type A) was placed in a conical flask, followed by the addition of 15ml of fresh palm wine. Few drops of methylene blue were added to serve as indicator, and then the mixture was boiled with the help of a manual stove.
At an interval of 20 seconds, little of the fresh palm wine was added to the boiling mixture until the blue colour disappeared to give a pale yellow colour. This process was carried out before and after fermentation in each case before distillation.
By analysis using the non-stoichiometric method (Lare and Eynon 1923). Sucrose content in sugar = 95%
:. % 𝑠𝑢𝑐𝑟𝑜𝑠𝑒 = 1000
𝑃𝑎𝑙𝑚 𝑤𝑖𝑛𝑒 𝑢𝑠𝑒𝑑 х 95 100 =
1000
𝑃𝑎𝑙𝑚 𝑤𝑖𝑛𝑒 𝑢𝑠𝑒𝑑 𝑥 0.95
2.2.4Test for fatty acid
A small quantity of anhydrous sodium carbonate (powder) was placed in a Petri-dish and a drop of palm wine was added. As the sodium carbonate is dissolving, effervescence occurred to indicate the presence of a carboxylic group (fatty acid).
measured with the help of a pipette and poured into a conical flask having filled the burette with palm wine up to the 50cm mark and clamped it to a resort stand. This was followed by titrating the sodium carbonate solution against the palm wine in the burette after some few drops of methyl orange was added as indicator, until a pale yellow colour was obtained as end point.
This procedure was carried out before and after fermentation in each case.
Using the non-stoichiometric volumetric method of analysis, it is seen that: % total fatty acid = 0.015 (𝑃 + 1.50)
Where p = Average titer of palm wine.1.50 And 0.015 are constants.
2.2.5Test for vitamin C (Ascorbic acid)
5ml of palm wine was measured and poured into a beaker with the help of pipette, and 1ml of glacial acetic acid added into the sample. 1ml of chloroform was added to serve as an indicator. A dye sodium, was pourred into the burette clamped to a resort stand and was then titrated against the mixture until a colour change was observed. This procedure was repeated but this time by titrating a 0.05M solution of ascorbic acid against the mixture of glacial acetic acid, chloroform and palm wine until a change in colour was also observed.
By analysis, the actual amount of Vitamin C is obtained as follows:
𝑉𝑖𝑡𝑎𝑚𝑖𝑛 𝐶 =𝐴𝑣𝑒𝑟𝑎𝑔𝑒 𝑡𝑖𝑡𝑒𝑟 𝑜𝑓 𝑑𝑦𝑒 × 2 × 𝑑𝑖𝑙𝑢𝑡𝑖𝑜𝑛 𝐴𝑣𝑒𝑟𝑎𝑔𝑒 𝑡𝑖𝑡𝑒𝑟 𝑜𝑓 𝑎𝑐𝑖𝑑 Where Dilution = the amount of water used for diluting the dye solution. This procedure was repeated each day before distillation.
2.2.6Determination of pH Value
100ml of palm wine solution was pourred into a 250ml capacity beaker and the tip of the electronic PH meter made to dip directly into the solution having switched the power on. A steady value appeared on the screen and was recorded as the PH value of the fresh palm wine. This procedure was repeated in each case before distillation (that is after fermentation). Result is also tabulated in the experimental result section.
2.2.7Measurement of Temperature
This was done with the help of a thermometer (Mercury-in-glass thermometer). The thermometer was dipped into the solution of palm wine and any rise recorded. This process was carried out at a regular interval of 24 hours throughout the period of fermentation.
2.2.8Test for Refractive Index
A small quantity of palm wine was placed on the screen of the refractometer. Readings were taken by viewing through the eyepiece of the instrument until a sharp demarcation was observed between the two images formed. Any reading displayed on the scale at this point was recorded as the refractive index of the sample in question by this method, the refractive index of the fermented palm wine samples and that of the fresh palm wine was taken. Also this method was used to find the refractive index of the distillates and residues after distillation in each case.
2.2.9 Measurement of Specific Gravity
This was obtained by firstly weighing a 200ml flask, followed by weighing it when it was filled with water and also when it is filled with palm wine. Then the specific gravity was calculated by dividing the weight of palm wine by the weight of equal volume of water. This procedure was carried out on the fresh palm wine and on each sample of fermented palm wine that was subjected to distillation.
2.3Development of Models
2.3.1 Variation of Sugar Content versus Time (Days)
The change in time is proportional to the natural log of change of the reciprocal of sugar content.
𝑡 − 𝑡𝑜= 𝑏 𝐼𝑛 1 𝑠 − 1 𝑠𝑜
𝐼𝑛 1 𝑠 − 1 𝑠 = 𝑜 𝑡 − 𝑡𝑜
𝑏 1
𝑠
− 1 𝑠𝑜 = 𝑒 (𝑡−𝑡𝑜)/𝑏
𝑠 =𝑠𝑜
1 + 𝑠𝑜𝑒𝑥𝑝(𝑡−𝑡𝑜)/𝑏
2.1
2.3.2 Fatty Acid versus Time of Fermentation
i) The fatty acid is partially a constanti.e.𝑦 = 𝑎0.
ii) It is also partially proportional to the decline of negative exponential of time raise to a constant poweri.e 𝑦 = −𝐴𝑒𝑥𝑝 −𝑎2𝑥𝑛
Combining the variations after simplification yields:
𝑦 = 𝑎𝑜 1 − 𝑎1𝑒𝑥𝑝 −𝑎2𝑥𝑛 2.2a
Where 𝐴 = 𝑎𝑜𝑎1
2.3.3 Refractive Index of Fermented palm wine versus Mole Fraction of Ethanol in Gaseous Phase
The variation of refractive index of fermented palm wine with mole fraction of ethanol in gaseous phase obeys the same model as equation (3.2a) above, only that it is also partially proportional to a yet an additional constant
K.
𝑅𝑖 = 𝑎𝑜 1 − 𝑎1𝑒𝑥𝑝 −𝑎2𝑥𝑛 + 𝐾 2.3
2.3.4Refractive Index of Distillate (𝑹𝒊) versus Mole Fraction of Ethanol in Liquid Phase (𝑿𝑨), Mole Fraction of Ethanol in Gaseous Phase (𝒀𝑨) versus Mole Fraction of Ethanol in Liquid Phase (𝑿𝑨), and
Mole Fraction of Water in Gaseous Phase (𝒀𝑩) versus Mole Fraction of Water in Liquid Phase (𝑿𝑩).
In these relations above, the independent variable is partially proportional to the cube of the dependent variable, partially proportional to the square of the dependent variable and partially proportional to the dependent variable and partially a constant.
Combining all these yields a cubic polynomial, 𝑦 = 𝑎𝑥3+ 𝑏𝑥2+ 𝑐𝑥 + 𝑑. ∴ 𝑦 = 𝑎𝑥3+ 𝑏𝑥2+ 𝑐𝑥 + 𝑑
𝑜𝑟 𝑦 = 𝑝1𝑥3+ 𝑝2𝑥2+ 𝑝3𝑥 + 𝑝4 3.4a
2.3.5 Variation of pH with Time of Fermentation
The PH of fermented palm wine is directly proportional to a quadratic function of time (𝑃1𝑥2+ 𝑃2𝑥 + 𝑃3), and inversely proportional to a linear function of time (𝑥 + 𝑞1).
Combining the variations yields:
PH =𝑃1𝑥2+𝑃2𝑥+𝑃3
𝑥+𝑞1 3.5
2.4 Optimization of Models
2.4.1When model equation 3.2a above
i.e. 𝑦 = 𝑎𝑜 1 − 𝑎1𝑒𝑥𝑝−𝑎2𝑥𝑛 is optimize, the first derivative becomes
∆𝑦 = 𝑛𝑎𝑜𝑎1𝑎2𝑥𝑛−1𝑒𝑥𝑝−𝑎2𝑥
𝑛
3.2b
When we equates the second derivative to zero, 𝑖. 𝑒. ∆2𝑦 =𝑑2𝑦
𝑑𝑥2= 0 , we obtain
The pick point 𝑥𝑜𝑝𝑡 = 𝑛−1
𝑛𝑎2
1 𝑛
3.2c
3.4.2When model three (i.e. equation 3.3) is optimized, it behaves like model (3.2a) and yields same result.
3.4.3 When equation (3.4a) above (𝑖. 𝑒. 𝑦 = 𝑎𝑥3+ 𝑏𝑥2+ 𝑐
𝑥+ 𝑑) is optimized, the first derivative becomes
∆𝑦 = 3𝑎𝑥2+ 2𝑏𝑥 + 𝑐 3.4b
∆2𝑦 = 𝑑2𝑦
𝑑𝑥2 = 0, We obtained:
𝑥𝑜𝑝𝑡 = − 𝑏 3𝑎 3.4c
2.5 Curve Fitting
The models were superimposed on the scatter diagram of the experimental data to ascertain their fitness and statistical goodness of fit using MatLab package 7.9 version.
III. RESULT PRESENTATION AND DISCUSSION 3.1 Result presentation
The result of the experiments and curve-fittings done in the previous section are presented here below in tables 3.1 - 3.10 and figures3.1- 3.8, and their consequent tables 3.11 - 3.17.
Table 3.1: Variation of Sucrose (Sugar) Content with Time of Fermentation
Time (days) Amount of palm wine used (ml) Sucrose content (%)
0 72.96 13.03
1 74.22 12.80
2 77.87 12.20
3 84.29 11.27
4 98.96 9.60
5 119.52 7.96
6 152.00 6.27
7 209.30 4.54
8 375.50 2.53
9 593.75 1.60
10 - 0.00
11 - 0.00
12 - 0.00
Table 3.2: Variation of Fatty acid (Carboxylic acid) with Time of Fermentation
Time (days) Average palm wine titer (ml) Fatty acid content (%)
0 7.83 0.140
1 15.17 0.250
2 24.83 0.395
3 26.50 0.420
4 35.17 0.550
5 44.50 0.690
6 48.70 0.753
7 51.57 0.796
8 53.50 0.825
9 54.57 0.841
10 55.17 0.850
11 55.17 0.850
Table 3.3: Variation of Ascorbic acid (Vitamin C) with Time of Fermentation
Time (days) Ascorbic acid
titer (ml)
Dye titer (ml) Vitamin C (mg/100ml)
1 9.60 14.52 10.20
2 10.21 17.63 10.20
3 10.52 19.49 10.40
4 10.80 21.36 10.80
5 11.10 23.45 11.15
6 11.22 24.76 11.60
7 11.26 25.85 12.20
8 11.30 27.25 13.00
9 11.44 31.05 14.90
10 11.52 33.05 15.80
11 11.64 36.30 17.22
12 11.84 40.39 18.60
13 11.84 40.39 18.60
Table 3.4: Determination of calibration curve
Mixed Solution Total
(ml)
Mole Fractions Refractive
Index
Water Ethanol XA XB
19 1 20 0.95 0.05 1.3484
18 2 20 0.90 0.10 1.3670
17 3 20 0.85 0.15 1.3855
16 4 20 0.80 0.20 1.4040
15 5 20 0.75 0.25 1.4225
14 6 20 0.70 0.30 1.4410
13 7 20 0.65 0.35 1.4595
12 8 20 0.60 0.40 1.4780
11 9 20 0.55 0.45 1.4965
10 10 20 0.50 0.50 1.5150
9 11 20 0.45 0.55 1.5350
8 20 20 0.40 0.60 1.5520
7 13 20 0.35 0.65 1.5705
6 14 20 0.30 0.70 1.5890
5 45 20 0.25 0.75 1.6075
4 16 20 0.20 0.80 1.6260
3 17 20 0.15 0.85 1.6445
2 18 20 0.10 0.90 1.6630
Table 3.5: Mode Fraction Composition in Gaseous phase
Time (days) Refractive index of
Fermented wine
Refractive Index MoleFraction
Residues Distillate YA YB =1-YA
1 1.3500 1.3301 1.3837 0.145 0.855
2 1.3666 1.3301 1.4447 0.310 0.690
3 1.3850 1.3300 1.4965 0.450 0.550
4 1.4001 1.3301 1.5317 0.500 0.500
5 1.4220 1.3302 1.5500 0.600 0.400
6 1.4410 1.3301 1.5670 0.640 0.360
7 1.4600 1.3300 1.5750 0.660 0.340
8 1.4800 1.3300 1.5890 0.700 0.300
9 1.5050 1.3300 1.6001 0.730 0.270
10 1.5600 1.3300 1.6223 0.790 0.210
11 1.5890 1.3301 1.6334 0.820 0.180
12 1.6350 1.3300 1.6559 0.880 0.120
Table 3.6: Mole Fraction composition in Liquid Phase Time
(days)
Refractive Index Mole fraction Composition
Residues Distillate XA XB = 1- XA
1 1.3301 1.3837 0.050 0.950
2 1.3301 1.4447 0.099 0.901
3 1.3300 1.4965 0.150 0.850
4 1.3301 1.5317 0.200 0.800
5 1.3302 1.5500 0.250 0.750
6 1.3301 1.5670 0.300 0.700
7 1.3300 1.5750 0.350 0.650
8 1.3300 1.5890 0.400 0.600
9 1.3300 1.6001 0.550 0.450
10 1.3300 1.6223 0.640 0.360
11 1.3301 1.6334 0.700 0.300
12 1.3300 1.6559 0.770 0.270
13 1.3300 1.6667 0.790 0.210
Table 3.7: Vapour-Liquid Equilibrium Curve-Ethanol
Mole Fraction of Ethanol in liquid phases
(𝒙𝑨) 0.050 0.099 0.150 0.200 0.250 0.300 0.355 0.400 0.550 0.640 0.700 0.770 0.790
Mole fraction of Ethanol
in gaseous phase (𝒚𝑨(𝟏)) 0.145 0.310 0.450 0.545 0.600 0.640 0.660 0.700 0.730 0.790 0.820 0.880 0.910
Table 3.8: Vapour-Liquid Equilibrium Curve-Water Mole Fraction of Ethanol in
liquid phases (𝒙𝑩) 0.950 0.901 0.850 0.800 0.750 0.700 0.650 0.600 0.450 0.360 0.300 0.270
Mole fraction of Ethanol in
Table 3.9: Variation of pH with Time of Fermentation
Time (days) 0 1 2 3 4 5 6 7 8 9 10 11 13
pH 6.56 6.21 5.93 5.67 5.37 5.20 4.94 4.78 4.66 4.53 4.50 4.50 4.50
Table 3.10:Variation of Specific Gravity with Time ofFermentation
Specific gr. 0.985 0.930 0.880 0.825 0.775 0.720 0.670 0.620 0.565 0.513 0.460 0.390 0.305 0.305
Time (days) 0 1 2 3 4 5 6 7 8 9 10 11 12 13
Curve Fittings
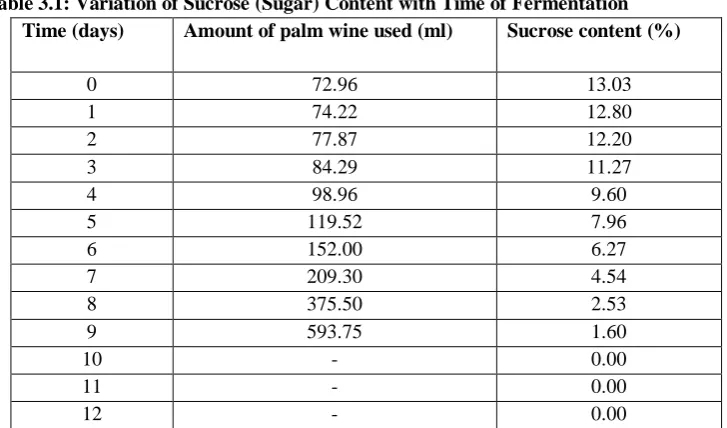
Figure 3.1: Percentage sugar content versus time duration of fermentation
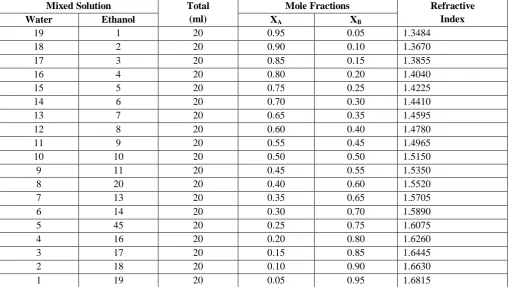
Figure 3.2a: Percentage fatty acid versus time of fermentation
Figure 3.2b: Percentage fatty acid versus time of fermentation
0 2 4 6 8 10 12
0 2 4 6 8 10 12
time(days)
p
e
rc
e
n
ta
g
e
s
u
g
a
r
c
o
n
te
n
t
Su vs. t fit 1
1 2 3 4 5 6 7 8 9 10 0
0.02 0.04 0.06 0.08 0.1 0.12
time(days)
D
a
ily
p
e
rc
e
n
ta
g
e
f
a
tt
y
a
c
id Dfa vs. x
fit 1
Table 3.11: Coefficients and goodness of fit, for fig 3.1
95% Coefficient Bound
Goodness of Fit
S0= 13.3
b= 1.57 t0= 9.778
SSE = 1.39 R2 = 0.9956 R2 Adj.= 0.9948 RMSE = 0.3728
Table 3.12: Coefficients and goodness of fit, for fig 3.2b
95% Coefficient Bound
Goodness of Fit
a0= 0.8662
a1= 0.8135
a2= 0.1034
n= 1.564 topt: F(1.49)=
0.106662
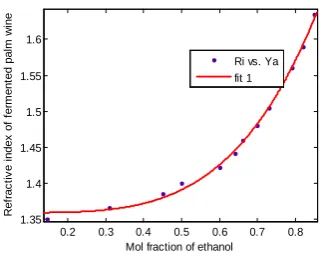
Figure 3.3a: Refractive index of fermented palm wine versus mole fraction of ethanol
Figure 3.3b: Refractive index of fermented palm wine versus mole fraction of ethanol in gaseous phase
Figure 3.4a: Refractive index of distillate versus mole fraction of ethanol (liquid phase)
Figure 3.4b: Refractive index per mole fraction of more volatile component versus mole fraction of more volatile component in liquid phase (Xa)
0.2 0.3 0.4 0.5 0.6 0.7 0.8 1.35 1.4 1.45 1.5 1.55 1.6
Mol fraction of ethanol
R e fr a c ti v e i n d e x o f fe rm e n te d p a lm w in e
Ri vs. Ya fit 1
0.5 1 1.5 2 2.5 3
0 0.5 1 1.5 2 2.5 3 3.5 4
percentage mole fraction of ethanol(Ya)
R e fr a c ti v e i n d e x o f fe rm e n te d p a lm w in
e Ri vs. Ya
fit 1
0.1 0.2 0.3 0.4 0.5 0.6 0.7 1.4 1.45 1.5 1.55 1.6 1.65
Mol fraction of ethanol(liquid phase)
R i( d is ti lla te )
Ri vs. Xa fit 2
0.1 0.2 0.3 0.4 0.5 0.6 0.7 0.8 0.9 0.2 0.4 0.6 0.8 1 1.2
mole fraction of more volatile component,Xa
R e fr a c ti v e i n d e x
DRi vs. x fit 1
Table 3.13: Coefficients and goodness of fit, for fig 3.3b
95% Coefficient Bound
Goodness of Fit
a0= 6.868
a1= 1.036
a2= 0.07497
K = 1.607 n= 4.067 Yopt: F(1.44)=
3.39777
SSE = 0.0003058 R2 = 0.9966 R2 Adj.= 0.9947 RMSE = 0.006609
Table 3.14: Coefficients and goodness of fit, for fig 3.4b
95% Coefficient Bound
Goodness of Fit
P1 = 2.011
P2 = -2.988
P3 = 1.552
n= 1.318 Xopt: F(0.499)=
0.0730508
Figure 3.5a: Vapour-Liquid equilibrium for ethanol during fermentation of palmwine
Figure 3.5b: Mole fraction of gaseous ethanol per mole fraction of more volatile component versus mole fraction of more volatile component in liquid phase
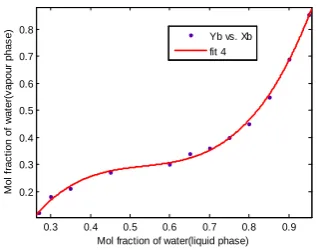
Figure 3.6a: Vapour-Liquid equilibrium for water during fermentation of palmwine
Figure 3.6b: Mole fraction of less volatile component in gaseous phase per mole fraction of less volatile component in liquid phase versus mole of less volatile component(Xb)
0.1 0.2 0.3 0.4 0.5 0.6 0.7 0.2 0.3 0.4 0.5 0.6 0.7 0.8 0.9
Mol fraction of ethanol(liquid phase)
M o l fr a c ti o n o f e th a n o l (g a s p h a s e )
ya vs. Xa fit 3
0.3 0.4 0.5 0.6 0.7 0.8 0.9 0.2 0.3 0.4 0.5 0.6 0.7 0.8
Mol fraction of water(liquid phase)
M o l fr a c ti o n o f w a te r( v a p o u r p h a s e )
Yb vs. Xb fit 4
0.1 0.2 0.3 0.4 0.5 0.6 0.7 0.8 0.9 1 0.2 0.4 0.6 0.8 1 1.2
mole fraction of less volatile component,Xb
M o le f ra c ti o n o f le s s v o la ti le c o m p o n e n t g a s e o u s p h a s e p e r m o le f ra c ti o n o f le s s v o la ti le c o m p o n e n t, X b
DYb vs. x fit 1
0.1 0.2 0.3 0.4 0.5 0.6 0.7 0.8 0.9 0.2 0.4 0.6 0.8 1 1.2
mole fraction of more volatile component,Xa
m o le f ra c ti o n o f g a s e o u s e th a n o l p e r m o le f ra c ti o n o f m o re v o la ti le c o m p o n e n t
DYa vs. x fit 1
Table 3.15: Coefficients and goodness of fit, for fig 3.5b
95% Coefficient Bound
Goodness of Fit
P1 = 5.319
P2 = -7.961
P3 = 4.167
P4 = -0.03022
Xopt: F(0.499)=
0.195602
SSE = 0.001921 R2 = 0.9968 R2 Adj.= 0.9957 RMSE = 0.01461
Table 3.16: Coefficients and goodness of fit, for fig 3.6b
95% Coefficient Bound
Goodness of Fit
P1 = 6.802
P2 = -10.91
P3 = 6.004
P4 = -0.8353
Xopt: F(0.535)=
0.165855
Figure 3.7: Variation of pH of palm wine with time during fermentation
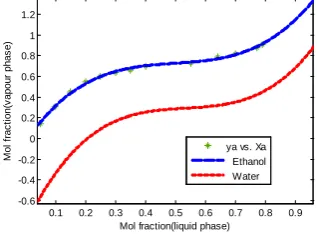
Figure 3.8:Vapour-Liquid equilibrium for ethanol and water during palmwine fermentation
IV. Discussion of Result
From figure 4.1 and its consequent table 4.11, it is clear that the percentage sugar content decreases exponentially with time. The model (eqn. 3.1) used on it gave a correlation of 0.9956 to show that it is a good model.
In figure 4.2, the percentage fatty acid increases with time in days as a natural growth model. The model used on it (equation 3.2a) gave a very good correlation, of 0.9901.On optimization; figure 4.2b shows a daily percentage fatty acid against time in days. It reveals a daily percentage fatty acid of 0.107 in 1.5 days.
Figure 4.3a shows a refractive index of fermented palm wine against mole fraction of ethanol in gaseous phase. Again, it behaves like a natural growth profile. On optimization, figure 4.3b result gives a peak at 1.44% mole fraction of ethanol to yield 3.398 refractive index of fermented palm wine. The model was pretty good as it reflect as much as 99.66% of the experimented value as shown by the R -2
in figure 4.4a. On optimization, however, the model gave a trough in figure 4.4b. This trough gave a minimum point of 0.499 mole fraction of more volatile component to 0.0731 refractive index of distillate per more fraction of more volatile component.
In figure 4.5a, a plot of mole fraction of ethanol in gaseous phase against mole fraction of ethanol in liquid phase, like figure 4.4a, was made. When model is plotted against the data it (equation 3.4a) gave an
accuracy of 99.68% of the experimental
characteristics. On optimization, it gave a trough of 0.499 mole fraction of more volatile component as against 0.1956 mole fraction of gaseous ethanol per- fraction of more volatile component in 4.5b.
Also, in figure 4.6a, a plot of mole fraction of water (vapour phase) against mole fraction of water (liquid phase) was made. The model gave an accuracy of R2 = 0.9960 of the experimental characteristics. On optimization, a trough yielded to give a minimum of 0.535 mole fraction of less volatile component against 0.1659 mole fraction of less volatile component (gaseous phase) per mole fraction of less volatile component. Again, figure 4.7 is a plot of PH against time (day) of palm wine during fermentation. The model (equation 3.5) captured as much as an
accuracy of 0.9989 of the experimental
characteristics.
Finally, figure. 4.8 is a plot of mole fraction of ethanol and water (vapour phase) against mole fraction of the same ethanol and water (liquid phase).
0 2 4 6 8 10 12
4.5 5 5.5 6 6.5
time(days)
pH
pH vs. x fit 1
0.1 0.2 0.3 0.4 0.5 0.6 0.7 0.8 0.9 -0.6
-0.4 -0.2 0 0.2 0.4 0.6 0.8 1 1.2
Mol fraction(liquid phase)
M
o
l
fr
a
c
ti
o
n
(v
a
p
o
u
r
p
h
a
s
e
)
ya vs. Xa Ethanol Water
Table 3.17: Coefficients and goodness of fit, for fig 3.7
95% Coefficient Bound
Goodness of Fit
P1 = 21.08
P2 = -475.1
P3 = 8529
Q1 = 1295
The plot shows the relationship between ethanol and water variation during fermentation of palm wine.
V. CONCLUSSION
In this project, experiment was done to determine the variation of (i) sugar content, (ii) Fatty acid, (iii) Ascorbic acid, (iv) pH,etc. with time during the fermentation of palm wine.The vapour-liquid equilibrium was also determined using the distillation process.
Models were developed to predict and enhance the reproduction of the experimental values. On curve fittings, the models fitted very well into the parameter variation of the palm wine fermentation as given by the R2 which ranges from 0.9901 to 0.9980.
An optimization carried out shows that in 1.49 days, 0.1067 daily percentage fatty acid is produce. In 1.44% mole fraction of ethanol, 3.398 refractive index of palm wine is obtained.More so, a minimum value of 0.07305 refractive index of distillate per mole fraction of more volatile component was obtain in just 0.499% mole fraction of the more volatile component in liquid phase .
Finally, in the same 0.499% mole fraction of ethanol (liquid phase), a minimum value of 0.1956 mole fraction of more volatile component was obtained. With these optimal values, application of the result in the reproduction of the experiment is imperative.
REFERENCES
[1.] Ababio O.Y. (2007). New School Chemistry, for Senior Secondary Schools, Revised Edition, African first publishers limited; Onitsha, Nigeria. Chapter 32,pp. 537-540. [2.] Adams O. and Moss K. (1995). Handbook of
indigenous fermented foods, marcel Decker inc. New York. pp. 59-60.
[3.] Akpa J.G. (2012). Modeling of a bioreactor for
the fermentation of palm-wine by
Saccaharomyce Cerevisial (yeast) and
lactobacillus (bacteria). American Journal of Scientific and Industrial Research. Department
of Chemical/Petrochemical Engineering,
Rivers State University of Science and Technology, Port-Harcourt, Rivers State, Nigeria. pp. 231& 233.
[4.] Coulson J.M. and Richardson J.F. (1991). Chemical Engineering, Particle Technology and Separation Processes, vol.2, fourth Edition, Oxford: Butter worth Heinman; chapter 11, pp. 428-476.
[5.] Matthews P. (2002). Advanced Chemistry;
Press Syndicate of the University of
Cambridge, United Kingdom.
[6.] Odunfa S.A. (1999). Microbiology of
fermented food. Elsevier Applied Science publishers UK pp. 45-47.
[7.] Okafor N. (1990). Preliminary microbiology cal studies on the preservation of palm wine Journal Application act 81.
[8.] Okafor N. (1990). Traditional Alcoholic Beverages of Tropical Africa; Strategies for scale up, Process Biochemistry journal, pp. 205-217.
[9.] Perry R.H. and Green D.W. (1984). Perry’s Chemical Engineer’s Hand book; 6th edition, New york. McGraw-Hill book company, Chapter13, pp. 27-35, 82-91.
[10.]Tregbal R.E. (1981). Mass Transfer