ISSN
: 2455-104X
Impact Factor
: 4.950
Volume 4,Issue 1 (Jan-June
)
2018, 52-59
Received: 15 June. 2018 ; Accepted: 28 June. 2018 ; Published: 06 July. 2018 ; Paper ID: IJRLS-1281
2018, IJRLS All Rights Reserved www.ijrls.in
Page 52
Bibliometric Analysis of the International
Journal of Web Information Systems
for the Year 2005-2015
V.Santhanakrishnan
1; P. Gomathi
2Doctoral Research Scholar, Department of Library & Information Science,
Periyar University, Salem-636011
1;
Assistant Professor, Department of Library & Information Science
Periyar University, Salem-636011
2vsanthanakrishnanacl@gmail.com
1; gomathi148@periyaruniversity.ac.in
2ABSTRACT
This paper deals with the analysis of the 212 original Contributions of the journal entitled “International Journal of Web Information Systems” published at the time of 2005-2015. The paper covers the bibliometric analyses of year-wise distribution of articles, category-wise classification of papers, geographical distributions and authorship patterns of the International Journal of Web Information Systems brought out during 2005-2015. The study finds that topmost number of citations was more than three authored (31.60 %), and Category-wise classification of papers 84.90 % citations were from Research Paper and come after by only 10.38 % citations were from Technical Paper. The country-wise scattering of citations reveals that 32 (15.09 %) citations were from Japan and it was followed by Austria and USA.
Keywords: Bibliometric Study, Citation counts, International Journal of Web Information Systems.
1.
INTRODUCTION
of international activities (Cole and Eales,1971). Alan Pritchard first introduced the term Bibliometrices’ in 1969 to mean ‘the applications of mathematics and statistical methods to books and other media of communications (Pritchard,1969).
International Journal of Web Information Systems:
International Journal of Web Information Systems (ISSN: 1744-0084) is a well-known quarterly journal started publishing Online from 2005 published by Emerald Group Publishing, Ltd. The journal is intended for people interested in Web information systems and related areas at all levels. The primary audience of this journal includes academics, students, developers, engineers, innovators, research strategists and IT-managers who are looking visionary concepts and stimulating ideas in Web information systems at both the theory and application levels.
Related Studies :
Paramasivam and Venkatachalam review the journal titled “The Indian concrete” Journal from January 2012 to December 2012. The study revealed that utmost number of papers have been written by 23(39%) of two authors in the articles contribution, which shows collaborative research practice in The Indian Concrete Journal articles are especially cited from Journals, Books, Conferences, Proceedings and Technical Reports, ASTM standards.
Raina (1984) analysed citations of Annual Review of Biochemistry to check the stability of ranks of some significant journals of the subject.
Just Now surveyed on single journal bibliometric studies was conducted by Santhanakarthikeyan, Grace and Jeyshankar (2014) were studied the Indian journal of cancer and they were analysed 611 papers, 98.77 % of the papers were multi-authored. Out of 22 countries contributed 244 research papers during the study period of the 244 articles, 168 (68.85 per cent) were published from India. In another study conducted by Gudodagi (2014) analysed highest number of research papers (14.27%) was published in the year 2009. The study revealed collaborative research is high (45.36%) most of the research papers give by Indians.
Shokeen and Kaushik (2004) studied the Indian Journal of Plant Physiology, volume 7. There are 61 articles with a total of 1,149 citations. Of the 61 articles, 19 (31%) were contributed by three or more authors.
Sujatha and Padmini analyzed 3442 papers published in the journal IEEE Transactions on Antennas and Propagation during the period 2010-2014. They found that on an average 688 papers are published annually between the above said period. Number of publications in the journal from Indian authors was found to be very less as compared to European and Western countries.
Objectives and methodology:
➢ To make an analysis of articles published in International Journal of Web Information Systems.
➢ To ascertain the number of papers published in the International Journal of Web Information Systems from 2005 to 2015
➢ To investigate year-wise distribution of papers
➢ To review the authorship pattern of papers
➢ To examine geographical distribution of the articles state wise and country wise
Scope :
The present study analyses the contribution of Volume 1-11 (Year 2005-2015) of International Journal of Web Information Systems.
Methodology:
Page 54
Data analysis and interpretation:
The International Journal of Web Information Systems have extracted all the details such as author(s), year of publication, Geographical distribution, pagination etc of all articles published from 2005 to 2015 were recorded for the following analysis
During the period January 1, 2005 to December 31, 2015, 212 articles were published. Table 1 show that the numbers differs from year to year .Out of total 212 articles, the best numbers of articles are in the year 2015 contributing 24 articles, which are 11.32 % to the total publications. The lowest numbers of articles are in the year 2010 with 16 articles, which are 7.55% to the total publications.
Table 1. Year wise Distribution of Articles
2004 2006 2008 2010 2012 2014 2016
0 5 10 15 20 25 30
Year wise Distribution
No.of Article
Year
Art
icl
es
Year No. of Article Percentage Cumulative
Cumulative %
2005
19
8.96
19
8.96
2006
20
9.43
39
18.40
2007
21
9.91
60
28.30
2008
20
9.43
80
37.74
2009
19
8.96
99
46.70
2010
16
7.55
115
54.25
2011
18
8.49
133
62.74
2012
17
8.02
150
70.75
2013
17
8.02
167
78.77
2014
21
9.91
188
88.68
2015
24
11.32
212
100.00
Authorship patterns
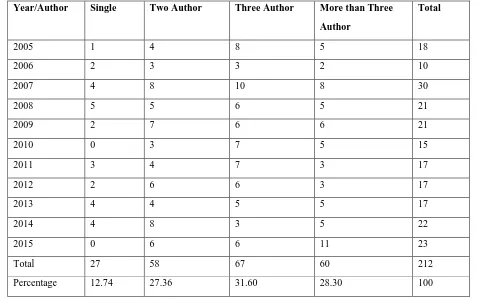
Table 2 reveals the authorship pattern of the articles published during the period of study. The huge number of articles had Three authors 67 (31.60%). This is followed by more than three authors 60 (28.30%), Two authors 58 (27.36%) and single author with 27 (12.74%) of the total articles.
Table 2. Authorship patterns
Year/Author Single Two Author Three Author More than Three
Author
Total
2005 1 4 8 5 18
2006 2 3 3 2 10
2007 4 8 10 8 30
2008 5 5 6 5 21
2009 2 7 6 6 21
2010 0 3 7 5 15
2011 3 4 7 3 17
2012 2 6 6 3 17
2013 4 4 5 5 17
2014 4 8 3 5 22
2015 0 6 6 11 23
Total 27 58 67 60 212
Percentage 12.74 27.36 31.60 28.30 100
Type of Documents
Table 3 indicates that the majority of the contributors preferred Research Paper as the source of information which occupied the top position with the greatest number of citations 180(84.90%) of the total 212 citations. The second highest position is occupied by online Technical paper with 22 (10.38%) citations. It is followed by General Review with 4(1.89%), Literature Review with 3(1.42%), case study 2 ( 0.94%)and conceptual Paper 1(0.47%).
Page 56
Table 3.Category-wise classification of papersGeographical Distribution of Research:
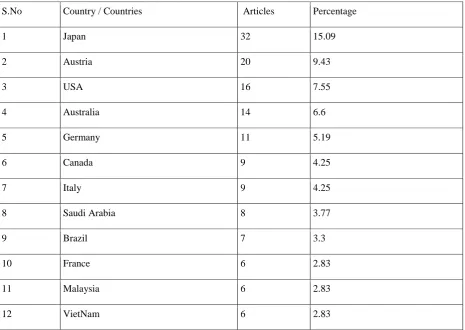
Table 4 gives that there are 212 publications during the study period. It has been identified that the greatest contributions is from Japan with 32 (15.09%) publications, followed by Austria with 20 (9.43%) contributions and occupies Second Position, USA contributed 16 (7.55%) publications and occupied third position. Australia had 14 (6.6%) publications and occupies fourth position and lowest number i.e., 1 (0.47%) has been contributed from different Country i.e.,Algeria,Chile,Hong Kong,Iran,Ireland, Kuwait,Netherlands,Romania,Portugal ,India and Tunisia.
Table 4.Geographical Distribution
S.No Country / Countries Articles Percentage
1 Japan 32 15.09
2 Austria 20 9.43
3 USA 16 7.55
4 Australia 14 6.6
5 Germany 11 5.19
6 Canada 9 4.25
7 Italy 9 4.25
8 Saudi Arabia 8 3.77
9 Brazil 7 3.3
10 France 6 2.83
11 Malaysia 6 2.83
12 VietNam 6 2.83
Document Type
No. of Documents
Percentage
Cumulative
Cumulative %
Research Paper
180
84.91
180
84.91
22
10.38
202
95.28
2
0.94
204
96.23
1
0.47
205
96.7
4
1.89
209
98.58
3
1.42
212
100
Total
212
100
Technical
Paper
Case
Study
Conceptual
Paper
General
Review
13 UK 6 2.83
14 Taiwan 5 2.36
15 Czech Republic 4 1.87
16 Greece 4 1.87
17 Spain 4 1.87
18 China 3 1.42
19 Colombia 3 1.42
20 Finland 3 1.42
21 New Zealand, 3 1.42
22 Singapore 3 1.42
23 Switzerland 3 1.42
24 Argentina 2 0.94
25 Egypt 2 0.94
26 Norway 2 0.94
27 Oman 2 0.94
28 South Koria 2 0.94
29 Sweedan 2 0.94
30 Thailand 2 0.94
31 UAE 2 0.94
32 Algeria 1 5.19
33 Chile 1 0.47%
34 Hong Kong 1 0.47%
35 Iran 1 0.47%
36 Ireland 1 0.47%
37 Kuwait, 1 0.47%
38 Netherlands 1 0.47%
39 Romania 1 0.47%
Page 58
41 India 1 0.47%
42 Tunisia 1 0.47%
Total 212 100
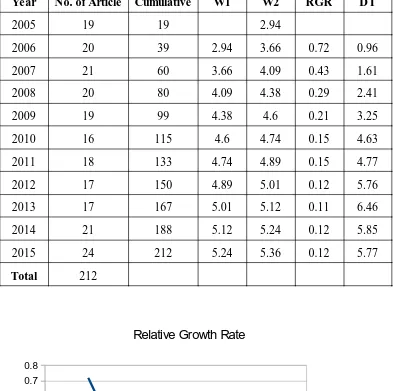
Relative Growth Rate and Doubling Time
Table 5. RGR and DT
Fig1
Year
No. of Article
Cumulative
W1
W2
RGR
DT
2005
19
19
2.94
2006
20
39
2.94
3.66
0.72
0.96
2007
21
60
3.66
4.09
0.43
1.61
2008
20
80
4.09
4.38
0.29
2.41
2009
19
99
4.38
4.6
0.21
3.25
2010
16
115
4.6
4.74
0.15
4.63
2011
18
133
4.74
4.89
0.15
4.77
2012
17
150
4.89
5.01
0.12
5.76
2013
17
167
5.01
5.12
0.11
6.46
2014
21
188
5.12
5.24
0.12
5.85
2015
24
212
5.24
5.36
0.12
5.77
Total
212
2004 2006 2008 2010 2012 2014 2016
0 0.1 0.2 0.3 0.4 0.5 0.6 0.7 0.8
Relative Growth Rate
RGR
Year
R
G
Fig2
Relative growth rate(RGR)and Doubling time (Dt)
It is seen from Table 4and Figure 1 that RGR has been decreasing from 2006 (0.72 to 2015(0.12).On the other hand, the Doubling Time (DT) has shown an increasing trend. The date in Table 5 reveals that Doubling time has increased from 0.96 in the year 2006 to 5.77 in the year 2015 (Figure 2)
Findings and Conclusion
There are total 212 publications published in International Journal of Web Information Systems in the year 2005- 2015. The year 2015 has the topmost number of 24(12.04%) publications, where as the year 2010 has lowest number of 16 (7.55%) publications. It has been pinpont that the maximum contributions is from Japan with 32 (15.09%) publications, come after by Austria with 20 (9.43%) contributions and occupies second position, USA contributed 16 (7.55%) publications and occupied third position. Australia had 14 (6.6%) publications and occupies fourth position and lowest number i.e., 1 (0.47%) has been contributed from several Country i.e.,Algeria,Chile,Hong Kong,Iran,Ireland, Kuwait,Netherlands,Romania,Portugal ,India and Tunisia.
On the other hand, journal refers to a record of events, experiences, thoughts, and observations kept on a regular basis by an individual for personal use. Writers often keep a regular journal to record ideas and material that may later be incorporated into their works.
REFERENCES
[1]. Borgman, C.L., and Furner, J, (2002), Scholarly communication and bibliometrics, Annual Review of Information Science and Technology, 36: 3–72.
[2]. Paramasivam. S. & Venkatachalam, A, M.(2015). The Indian Concrete Journal- A Scientometric Study. Indian Journal of Science, 21(74), 571-579.
[3]. Raina, R. 1984. Study towards achieving stability in the ranks of some important journals in biochemistry. Annals of Library Science and Documentation, Vol.31, no.3-4: 162-7
[4]. Santhanakarthikeyan et al, (2014), Research publications to Indian Journal of Cancer: a
scientometric analysis, Library Hi Tech News, 3, 21-25.
[5]. Shokeen, A.; & Kaushik, S. K. (2004). ‘Indian Journal of Plant Physiology’: A citation analysis.
Annals of Library and Information Studies, 51, 108-115.
[6]. Sujatha, D. & Padmini, K. (2015). IEEE Transactions on Antennas and Propogation: A bibliometric study. DESIDOC Bulletin of Library & Information Technology, 35(6), 443-449.
2004 2006 2008 2010 2012 2014 2016
0 1 2 3 4 5 6 7
Doubling Time
DT
Year