Placement of UPFC for Improvement of Voltage
Stability by Current based Model
V. Subbarayudu C. Ashok Kumar
M. Tech Scholar Assistant Professor
Department of Electrical & Electronics Engineering Department of Electrical & Electronics Engineering
BITS, Proddatur, A.P, India BITS, Proddatur, A.P, India
B. Bhargava Reddy Assistant Professor & H.O.D
Department of Electrical & Electronics Engineering BITS, Proddatur, A.P, India
Abstract
The objective of this paper is to reduce the power loss and to improve the voltage profile in radial distribution system. Fuzzy and particle swarm optimization algorithm is a two-stage methodology used for placement and sizing of UPFC in this paper. To show the effectiveness of the same a complete result analysis is carried out on 33 and 69 bus systems. Power loss and voltages are calculated for the optimal locations based on fuzzy system. 50%, 80% 150%, overloading cases are also considered in this paper. The result analysis shows that the two-stage methodology effectively improves the voltages and reduces the power loss of the system.
Keywords: FACTS Device, Optimal Power Flow (OPF), Quasi-Newton Method, Unified Power Flow Controller (UPFC), Particle Swarm Optimization (PSO)
_______________________________________________________________________________________________________
I.
I
NTRODUCTIONPower Generation and Transmission is a complex process, wherever power is to be transferred, the two main components are active and reactive power. In a three phase ac power system active and reactive power flows from the generating station to the load through different transmission lines and networks buses. The active and reactive power flow in transmission line is called power flow or load flow.
Power flow studies provide a systematic mathematical approach for determination of various bus voltages, there phase angle, active and reactive power flows through different lines, generators and loads at steady state condition. Power flow analysis is also used to determine the steady state operating condition of a power system. For the planning and operation of power distribution system, Power flow analysis is used. It is very important to control the power flow along the transmission line. Thus to control and improve the performance of ac power systems, we need the various different types compensators.
Power system networks are complex systems that are nonlinear, non-stationary, and prone to disturbances and faults. Reinforcement of a power system can be accomplished by improving the voltage profile, increasing the transmission capacity and others. Power.
The UPFC is one of the most versatile devices. It cannot only perform the functions of the static synchronous compensator, thyristor switched capacitor, thyristor controlled reactor and the phase angle regulator but also provides additional flexibility by combining some of the functions of the above controllers [1]. The main function of the UPFC is to control the flow of real and reactive power by injection of a voltage in series with the transmission line. Both the magnitude as well as the phase angle of the voltage can be varied independently. Real and reactive power flow control can allow for power flow in prescribed routes, transmission lines loading is closer to their thermal limits and can be utilized for improving transient and small signal stability of the power system.
Flexible AC Transmission System (FACTS) devices are an alternate solution to address some of those problems [1][5]. The FACTS equipment appeared in the 1980s and, in the early 1990s, voltage source inverters (VSI) were developed. The UPFC is one of the most complete equipment of this new technological family, allowing the regulation of active and reactive powers, substantially enlarging the operative flexibility of the system [1]–[7].
The model described in [16], known as power injection model (PIM), is quite spread in the literature, representing the effect of active elements by equivalent injected power. The controllable reactive power is useful to control the voltage magnitude on a particular bus bar. Furthermore, the active and reactive power flow and voltage magnitude can be controlled simultaneously or any combination of them [1].
a dc storage capacitor gives best optimal locations depending on the considered objectives and PSO technique iteratively optimize the sizes of the devices for the particular location. A MATLAB code is developed for the proposed approach and applied bus system and the results are tabulated.
II.
C
URRENT BASED MODELThe developed model represents the UPFC in steady state, introducing the current in the series converter as variable (see Fig. 1). The voltage and current limits of the practical system are as follows;
(2.1)
Let us consider i and k existent in the transmission line where the UPFC will be located, with impedance . The bas bars j and are created in order to include the of UPFC in the system.
The series impedance of UPFC coupling transformer Zs and the transmission line are added, resulting in the equivalent impedance = + connected to the internal node j and node is eliminated. The equivalent network is represented by π circuits in Fig.2, with the series voltage inserted between bus bars i and j.
Injected Power Due to Current A.
The power consumption of the system load at bus bar i is called .
Additional power and , due to current ̅, are easily calculated according to Fig. 3. Current ̅ introduces two variables i.e., , , related to module and phase of the current.
The power equations due to current:
̅ ̅ ̅ ̅
And
The new variables and at n and 2n position, respectively, the new vector of variables written: [ ] [ ] (2.2)
Series Voltage Equations B.
The following treatment of the series voltages of the UPFC is general for FACTS devices that can employ this feature. The main example is the SSSC and, as a consequence, other equipment such as IPFC and GIPFC that use series voltage can be modeled as well.
Writing the voltage equation between nodes i and j,
̅ ̅ ̅ (2.3) The series voltage will be treated similarly to the PIM model of
̅ (2.3)
Where r is the factor for series voltage and is the series voltage angle. That equation substituted in (2.2)
̅ ( ) ̅ (2.4)
If r and are constants, in a regular power flow case ,the complex variable
(2.5) The equation (2.4) we can write
̅̅̅ ̅ (2.6) Relative to the real and imaginary parts and , respectively:
(2.7) (2.8) If r and are variables in an optimization case, we have
[ ] [ ] (2.9)
[ ] (2.10) [ ] (2.11)
Power Balance C.
Let us calculate the power in the series converter:
̅
Splitting active and reactive powers:
Active power is included in node i
Complex Jacobian D.
The Jacobian matrix, without UPFC power addition
[ ]
Let us add the injected power due to current I bus bar i and j and also the voltage equation and . The additional correction of the Jacobian matrix, due to the power balance equation, is also included, complementing the formulation.
[ ] [ ] [ ] [ ] The Jacobian matrix due to injection current. Where r and are constants:
H terms: 1) N terms: 2) J terms: 3) L terms: 4)
Correction in Jacobian terms due to power balance: H terms: 5) N terms: 6) [H] Sub-matrix terms:
7)
[N] Sub-matrix terms: 8)
[J] Sub-matrix terms: 9)
[L] Sub-matrix terms: 10)
Where r and are variables we have the following changes in the Jacobian, which is no longer a square matrix:
The total power loss in a distribution system having ‗n‘ number of branches is given by,
∑
III.
O
PTIMIZATION APPROACHThe behavior of the proposed model was studied with an optimization power flow based on the optimization method was used in order to compare time answers of PIM and CBM, adopting the same initial condition and trying to obtain similar results as possible, although some differences in the equation of both case can lead to small discrepancies in some variables of the system.
The approximation formula is written by
[ ] [ ] (2.16)
Where
= inverse of approximation of Taylor series expansion of the gradients of in ;
= Taylor series expansion ;
secant relationship;
= identity matrix;
Current restriction is introduced in the formulation. In the CBM, current module and angle are the variable of the problem, while for PIM current equation is introduced according to
̅ (2.17)
The (2.17) equation would be a little more complex if the series admittance was not simplified to disregarding series impedance losses.
IV.
P
ROPOSED METHODThe performance of the PSO is greatly affected by its parameter values. Therefore, a way to find a suitable set of parameters has to be chosen. In this case, the selection of the PSO parameters follows the strategy of considering different values for each particular parameter and evaluating its effect on the PSO performance.
There is a trade-off between the number of particles and the number of iterations of the swarm and each particle fitness value has to be evaluated using a power flow solution a teach iteration, thus the number of particles should not be large because computational effort could increase dramatically. Swarms of 5 and 20 particles are chosen as an appropriate population sizes.
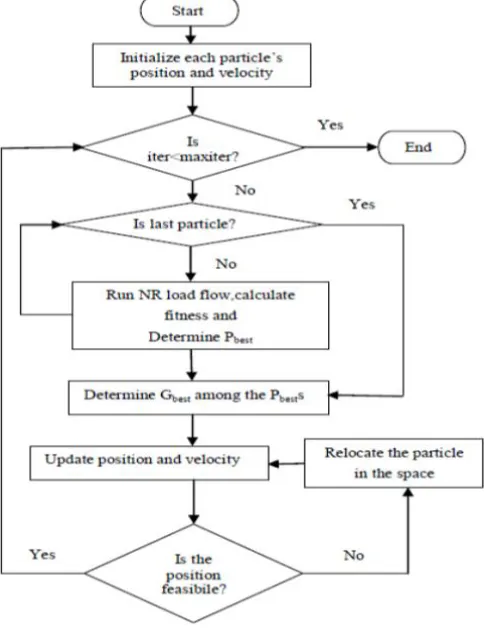
Fig 5: Flow chart of PSO
PSO Algoritham: A.
Step 1: Initialize the population - locations and velocities
Step 2: Evaluate the fitness of the individual particle (pbest)
Step 3: Keep track of the individual‘s highest fitness (gbest)
Step 4: Modify velocities based on pbest and gbest position
Step 5: Update the particles position
Step 6: Terminate if the condition is met
Step 7: Go to Step 2
V.
R
ESULTSSeveral comparative tests performed with CBM & PIM models presented identical results in power flow analysis using a Mat lab code. An additional comparison with the model of [8] was made, using the Power World program.
Some modifications in the New England System of 39 bus-bars were introduced with the purpose of highlighting the optimization results.. Generator 2 is the swing bus bar, and the other generators are considered power variable generators and generation costs are also presented.
In the modified network, the base case does not converge and convergence can only be attained if the power generation cost is optimized. If current restrictions are used in some lines, convergence is only attained with UPFCs in the network.
Network with 3 UPFCs: A.
The lines with UPFC and their respective minimum and maximum current limits are presented in Table I. The generation cost and computation time comparison are presented in Table II showing the critical operative condition, with the currents through the selected lines within range values, which is only possible with the inclusion of UPFCs in the network.
With 3 UPFCs, despite the higher Jacobian dimension of CBM, its convergence time is lower since limitations on current treated as a variable enable fast convergence. Most variables such as voltage, current and angle obtained in the convergence of three UPFCs are identical in both models, but this is not true if current limits are increased. Reducing the current band limits, PIM does not usually converge.
Additionally, we also performed some tests with the IEEE 39 bus bars with 3 UPFCs. The same trend of lower times for CBM was observed, although more analysis should be performed with this system in order to compare numerical values.
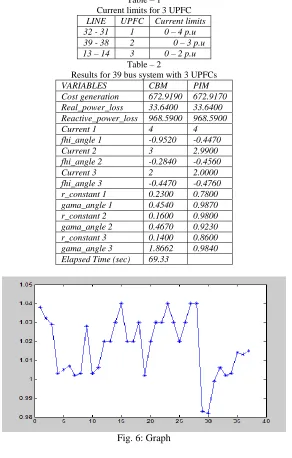
Table – 1 Current limits for 3 UPFC
LINE UPFC Current limits
32 - 31 1 0 – 4 p.u
39 - 38 2 0 – 3 p.u
13 – 14 3 0 – 2 p.u
Table – 2
Results for 39 bus system with 3 UPFCs
VARIABLES CBM PIM
Cost generation 672.9190 672.9170
Real_power_loss 33.6400 33.6400
Reactive_power_loss 968.5900 968.5900
Current 1 4 4
fhi_angle 1 -0.9520 -0.4470
Current 2 3 2.9900
fhi_angle 2 -0.2840 -0.4560
Current 3 2 2.0000
fhi_angle 3 -0.4470 -0.4760
r_constant 1 0.2300 0.7800
gama_angle 1 0.4540 0.9870
r_constant 2 0.1600 0.9800
gama_angle 2 0.4670 0.9230
r_constant 3 0.1400 0.8600
gama_angle 3 1.8662 0.9840
Elapsed Time (sec) 69.33
Fig. 6: Graph
VI.
C
ONCLUSIONFrom Table3, shows the result analysis in terms of voltages of at 50%, 100%, and 160% of normal loading is tested and the voltage profile is maintained within the limits. The voltages of all the loading conditions are also compared in this paper. Finally, the voltage is improved with UPFC at various conditions like light load (50%), normal load (100%) and heavy loads (160%). By this leads to the system stability is improved.
R
EFERENCES[1] N. G. Hingorani and L. Gyugyi, Understanding FACTS: Concepts and Technology of Flexible AC Transmission Systems. New York: IEEE Press, 2000. [2] Y. H. Song and A. T. Johns, Flexible AC Transmission Sys- tems—FACTS. London, U.K.: IEE Press, 1999.
[3] J. Bian, D. G. Ramey, R. J. Nelson, and A. Edris, ―A study of equipment sizes and constraints for a unified power flow controller (UPFC),‖ IEEE Trans. Power Del., vol. 12, no. 3, pp. 1385–1391, Jul. 1997.
[4] C. Schauder et al., ―Installation, commissioning and operation of the MVA STATCOM (Phase I); AEP UPFC Project,‖ IEEE Trans. Power Del., vol. 13, no. 4, pp. 1530–1535, Oct. 1998.
[5] K. K. Sen and E. J. Stacey, ―UPFC-unified power flow controller: Theory, modeling and applications,‖ IEEE Trans. Power Del., vol. 13, no. 4, pp. 1953– 1960, Oct. 1998.
[6] A. F. Keri et al., ―Unified power flow controller (UPFC): Modeling and analysis,‖ IEEE Trans. Power Del., vol. 14, no. 2, pp. 648–654, Apr.1999. [7] L. Gyugyi, C. Schauder, and K. K. Sen, ―Static synchronous series compensator: A solid state approach to the series compensation of transmission lines,‖
in Proc. IEEE Transmission & Distribution Conf.,96-Winter Meeting, Baltimore, MD, 1996.
[8] M. R. Iravani and A. Nabavi-Niaki, ―Steady-state and dynamic models of unified power flow controller (UPFC) for power system studies,‖ IEEE Trans. Power Syst., vol. 11, no. 4, pp. 1937–1943, Nov. 1996.
[9] L.Lábbate,M. Trovato, C.Becker, and H. Andschin, ―Advanced steady- state models of UPFC for power systems studies,‖ in Proc. IEEE PES Summer Meeting, Chicago, IL, Jul. 2002, vol. 1, pp. 449–454.
[10] B. Fardanesh, ―Optimal utilization, sizing, steady-state performance comparison of multiconverter VSC-based FACTS controllers,‖ IEEE Trans. Power Del., vol. 19, no. 3, pp. 1321–1327, Jul. 2004.
[11] A. Seungwon, J. Condren, and T. W. Gedra, ―An ideal transformer UPFC model, OFP first-order sensitivities, and application to screening for optimal UPFC locations,‖ IEEE Trans. Power Syst., vol. 22, no. 1, pp. 68–75, Feb. 2007.