I
I
n
n
t
t
e
e
r
r
n
n
a
a
t
t
i
i
o
o
n
n
a
a
l
l
J
J
o
o
u
u
r
r
n
n
a
a
l
l
o
o
f
f
P
P
h
h
a
a
r
r
m
m
a
a
S
S
c
c
i
i
e
e
n
n
c
c
e
e
s
s
Vol. 5, No. 4 (2015): 1155-1159Research Article Open Access
I
ISSSSNN::22332200--6688110 0
RP-HPLC Method development and validation for the
Simultaneous Estimation of Metformin and
Canagliflozin in Tablet Dosage Form
Nareddy Preethi Reddy
1,* and Naga Thirumalesh Chevela
21
Department of Pharmaceutical Analysis and Quality Assurance, G. Pulla Reddy College of Pharmacy, Mehdipatnam, Hyderabad, India.
2
Department of Industrial Pharmacy, Chalapathi Institute of pharmaceutical Sciences, Guntur, India.
* Corresponding author: Nareddy Preethi Reddy, e-mail: [email protected]
ABSTRACT
The purpose of the investigation was to develop a new HPLC method for simultaneous estimation of Metformin and Canagliflozin in pharmaceutical dosage forms. Chromatography was carried out on an ODS 250mm x 4.6 mm, 5 particle size with a isocratic mobile phase composed of Buffer, Acetonitrile and methanol at a flow rate of 1mL/min. The column temperature was maintained at 30°C and the detection was carried out using a PDA detector at 212 nm. Validation parameters such as system suitability, linearity, precision, accuracy, specificity, limit of detection (LOD), limit of quantification (LOQ), Stability of sample and standard stock solutions and robustness were studied as reported in the International Conference on Harmonization guidelines. The retention times for Metformin and Canagliflozin and were 2.783 min and 3.781 min respectively. The percentage recoveries of Metformin and Canagliflozin were 100.1% and 100.2% respectively. The relative standard deviation for assay of tablets found to be less than 2%. The method is fast, accurate, precise and sensitive hence it can be employed for routine quality control of tablets containing both drugs in quality control laboratories and pharmaceutical industries.
Keywords:
Metformin, Canagliflozin, Simultaneous estimation, ICH guidelines.1. INTRODUCTION
Metformin (MET) is chemically named as N,N-dimethylimidodicarbonimidic diamide (Fig.1). Metformin is a first line oral pharmacotherapy for type 2 diabetes. Activation of the energy-regulating enzyme AMPactivated protein kinase (AMPK), principally in muscle and the liver, is considered a major mode of metformin action [1,2].
Canagliflozin (CANA) is chemically named as (2S,3R,4R,5S,6R)-2-[3-[[5-(4-fluorophenyl)thiophen-2- yl]methyl]-4-methylphenyl]-6-(hydroxymethyl)oxane-3,4,5-triol (Fig.2). Canagliflozin is used for type 2 diabetes. Canagliflozin inhibits Na+- dependent 14C-AMG uptake in a concentration-dependent way. It is a novel C-glucoside with thiophene ring.
Various UV & HPLC assay methods are also reported in the literature for the estimation of Metformin and Canagliflozin individually and in-combination with
other drugs [3-6]. According to literature survey there is no official method for the simultaneous estimation of Metformin and Canagliflozin by RP-HPLC in combined tablet dosage forms. Hence, an attempt has been made to develop new method for simultaneous estimation and validation of Metformin and Canagliflozin in tablet formulation in accordance with the ICH guidelines.
Metformin
Canagliflozin
Figure 1. Chemical structures of drugs investigated in this study.
2. MATERIALS AND METHODS
2.1 InstrumentationChromatography was performed with Alliance waters 2695 HPLC with high speed auto sampler, column oven, degasser and 2996 PDA detector to provide a compact and convenient for LC with class Empower-2 software.
2.2 Reagents and chemicals
The reference samples of MET and CANA were provided as gift samples from Spectrum pharma research solutions, Hyderabad.HPLC grade Acetonitrile, HPLC grade Methanol and all other chemicals were obtained from Merck chemical division, Mumbai. HPLC grade water obtained from Milli-Q water purification system was used throughout the study. Commercial tablets (INVOKAMET; Dosage: MET-500 mg & CANA- 50 mg) were purchased from the local pharmacy.
2.3 Chromatographic condition
The mobile phase consisted of Buffer, Acetonitrile and methanol taken in the ratio of 40:40:20 at a flow rate of 1 mL/min. ODS 250mm x 4.6 mm, 5 particle size was used as the stationary phase. Although the MET and CANA have different λ max, but considering the chromatographic parameter, sensitivity and selectivity of method for both drugs, 212 nm was selected as the detection wavelength for PDA detector.
2.4 Preparation of standard stock solution
Standard stock solutions were prepared by dissolving 50 mg of Metformin and 10 mg of Canagliflozin into a clean and dry 25mL, 50 mL volumetric flasks respectively, to that 15mL of diluent was added, sonicated for 5 minutes and volume was made up to mark with diluents to get stock solution.
2.5 Preparation of Working Standard Solutions Aliquot of 0.25, 0.5, 0.75, 1, 1.25 & 1.5 mL were pipette out from stock solution into 10 mL volumetric flask separately for both MET and CANA and volume was made up to 10 mL with diluent. This gives the solutions of 50, 100, 150, 500, 250and 300µg/mL for Metformin and 5, 10, 15, 20, 25and 30µg/mL for Canagliflozin respectively.
2.6 Sample preparation
Twenty tablets were weighed and crushed into fine powder. The powder equivalent to weight of five tablets was weighed and dissolved in 250 mL diluent, sonicated for 20 min and filtered through PVDF 0.45µ filter. From the filtrate, 1 mL was pipette and transferred into a 10 mL volumetric flask and the solution was made up to the volume with diluent.
Figure 2: A typical Chromatogram of Metformin and Canagliflozin.
3. RESULTS AND DISCUSSION
3.1 Method developmentInitially reverse phase liquid chromatography separation was tried to develop using various ratios of Methanol and Water, Acetonitrile and Water as mobile phases, in which both the drugs did not responded properly, and the resolution was also poor. The organic content of mobile phase was also investigated to optimize the separation of both drugs. To improve the tailing factor, the pH of mobile phase becomes important factor. At pH: 4.5 both drugs eluted with better separation. Thereafter, buffer: Acetonitrile: methanol were taken in isocratic ratio: %buffer /
Table 1: System suitability of MET and CANA
Table 2: Results of accuracy of MET and CANA
Pre analysed sample solution conc. (ug/ml)
Standard drug conc.
(ug/ml) Amount recovered(ug/ml) Recovery (%)
MET CANA MET CANA MET CANA MET CANA
200 20 100 10 98.813 10.07 98.813 100.714
200 20 100 10 101.15 9.97 101.153 99.761
200 20 100 10 100.26 10.07 100.262 100.71
200 20 200 20 200.62 20.14 100.314 100.72
200 20 200 20 199.94 20.22 99.977 101.10
200 20 200 20 199.58 20.38 99.792 101.91
200 20 300 30 297.03 30.14 99.010 100.47
200 20 300 30 298.79 30.01 99.597 100.05
200 20 300 30 301.05 30.453 100.359 101.51
MEAN 99.9 100.74
SD 0.230384 0.451193
%RSD 0.23 0.44
3.2 Method Validation:
3.2.1 System suitability and Specificity
System suitability parameters such as number of theoretical plates, peak tailing, and retention time and resolution factor were determined. The total run time required for the method is only 7 minutes for eluting both MET and CANA. The results obtained were shown in Table 1.
3.2.2 Linearity
MET showed a linearity of response between 50-300 μg/mL and CANA showed a linearity of response between 5-30μg/mL. These were represented by a linear regression equation as follows: y (MET) = 26632x + 519.3 (r2=0.999), y (CANA) = 43142x + 222.8
(r2=0.999) and regression line was established by least squares method and correlation coefficient (r2 ) for MET and CANA is found to be greater than 0.98. Hence the curves established were linear.
3.2.3 Accuracy
To pre analyzed sample solution, a definite concentration of standard drug (50%, 100% & 150 % level) was added and recovery was studied. The % Mean recovery for MET and CANA are 99.9 and 100.74 respectively and these results are within acceptable limit of 98-102. The % RSD for MET and CANA are 0.23 and 0.44 respectively and %RSD for ACB and MET is within limit of ≤2. Hence the proposed method is accurate and the results were summarized in Table 2.
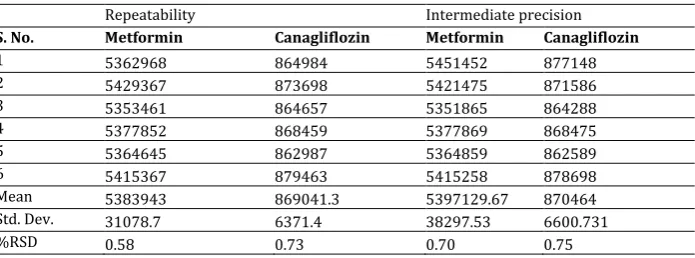
Table 3: Results of Precision for MET and CANA
Repeatability Intermediate precision
S. No. Metformin Canagliflozin Metformin Canagliflozin
1 5362968 864984 5451452 877148
2 5429367 873698 5421475 871586
3 5353461 864657 5351865 864288
4 5377852 868459 5377869 868475
5 5364645 862987 5364859 862589
6 5415367 879463 5415258 878698
Mean 5383943 869041.3 5397129.67 870464
Std. Dev. 31078.7 6371.4 38297.53 6600.731
%RSD 0.58 0.73 0.70 0.75
SD= Standard deviation RSD= Relative standard deviation
SYSTEM SUITABILITY PARAMETERS MET CANA
No of theoretical plates 3088 9339
Tailing Factor 1.62 1.19
Resolution - 5.5
RT 2.783 min 3.781 min
Mean Area 5374289 866114
Table 4: Results of Robustness for MET
Analytical conditions Evaluation parameters
Flow rate (1ml/min)
Column temperature (oc) Mobile phase composition
1.1 0.9 35 25 +5% -5%
Mean RT 2.54 2.92 2.39 2.84 2.66 2.80
Mean area 5392954 5403684 5318465 5489657 5245689 5785459
SD 26458.33 24359.24 30245.86 31654.10 29845.49 28465.71
RSD 0.5 0.5 0.6 0.57 0.56 0.49
Tailing factor 1.42 1.72 0.99 1.05 1.27 1.12
No. of theoretical plates 5647 5846 6485 5896 5706 7861
Table 5: Results of Robustness for CANA
Analytical conditions Evaluation parameters
Flow rate
(1ml/min) Column temperature (
oc) Mobile phase composition
1.1 0.9 35 25 +5% -5%
Mean RT 3.84 3.70 3.76 3.64 3.96 3.45
Mean area 842657 849365 836549 865478 786578 865479
SD 5414.5 5936.8 5684.3 6247.3 6384.54 6485.84
RSD 0.64 0.69 0.67 0.74 0.81 0.74
Tailing factor 1.61 1.32 1.10 1.24 1.32 0.94
No. of theoretical plates 8465 9846 8364 8954 9364 8024
3.2.4 Precision: Repeatability
Six replicates injections in same concentration were analyzed in the same day for repeatability and the % RSD for MET and CANA found to be 0.58 and 0.73 respectively and % RSD for MET and CANA found to be within acceptable limit of ≤2 and hence method is reproducible and the results are shownin Table 3.
Intermediate Precision
Six replicates injections in same concentration were analyzed on two different days with different analyst and column for verifying the variation in the precision and the % RSD for MET and CANA is found to be 0.70 and 0.75 and it is within acceptable limit of ≤2. Hence the method is reproducible on different days with
different analyst and column. This indicates that the method is precise and the results are as shown in Table 3.
3.2.5 Robustness
The robustness was established by changing the flow rate, column temperature and composition of the mobile phase within allowable limits from actual chromatographic conditions. It was observed that there were no marked change in mean Rt and RSD is within limit of ≤2 .The tailing factor, resolution factor and no. of theoretical plates are found to be acceptable limits for both MET and CANA. Hence the method is reliable with variations in the analytical conditions and the results of MET are shown in Table 4 and results of CANA shown in Table 5.
Table 6: Results of stock solution stability for MET and CANA
Drug %Assay at 0 hr %Assay at 24 hr %Deviation
MET 100.1 99.24 0.86
CANA 100.2 100.86 0.69
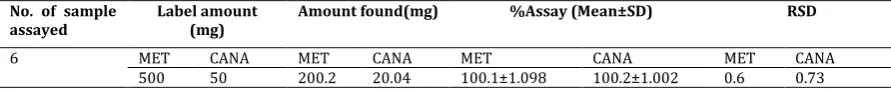
Table 7: Results of HPLC Analysis of Tablet for MET and CANA
No. of sample
assayed Label amount (mg) Amount found(mg) %Assay (Mean±SD) RSD
6 MET CANA MET CANA MET CANA MET CANA
500 50 200.2 20.04 100.1±1.098 100.2±1.002 0.6 0.73
3.2.6 Stability of sample solution
The sample and standard solutions injected at 0 hr (comparison sample) and after 24 hr (stability sample) by keeping at ambient room temperature 30Oc. The RSD for 0 hr. and 24 hr. for sample and standard solutions of MET are 0.58, 0.74 and 0.51, 0.96, respectively. The RSD for 0 hr. and 24 hr. for sample and standard solutions of CANA are 0.73, 0.7 and 0.7, 1.21, respectively. RSD results for both MET and CANA
are within limit of ≤2 and hence the sample and standard stock are stable for 24 hr in ambient room temperature and the results are shown in Table 7.
3.2.7 LOD and LOQ
as obtained by the proposed method indicate that the method is sensitive.
3.3 Tablet Analysis
TheContent of MET and CANA in the tablets was found by the proposed method. RSD results for both MET and CANA is within limit of ≤2 and the results were shown in Table 8.
4. CONCLUSION
A new precise accurate and simple HPLC method was developed and validated for simultaneous estimation of Metformin and Canagliflozin tablet dosage form. This method is fast, accurate, precise and sensitive hence it can be employed for routine quality control of tablets containing both drugs in QC laboratories and industries.
5. REFERENCES
1. Madhukar A, PrinceA, Vijay K.(2011) Simple and sensitive analytical method development and validation of metformine Hcl by RP-HPLC , Int J Pharm Pharm Sci. 3(3):117-120. 2. Rajesh T, Lakshmi KS, Srinivas S. (2009) Simultaneous
determination of metformin and pioglitazone by Reversed
phase hplc in pharmaceutical dosage forms. Int J Pharm Pharm Sci., 1(2): 112-116.
3. Caglar S, Alp AR(2014) A Validated High Performance Liquid
Chromatography Method for the Determination of Saxagliptin and Metformin in Bulk, a Stability Indicating Study, Analytical & Bioanalytical Techniques Caglar and Alp, J Anal Bioanal Tech, S12. 010. doi:10.4172/2155-9872.S12-010
4. Guo D, Nashunchaoketu, Wang J, Liu X et al. (2009) Simultaneous determination of four highly polar anti-diabetic drugs in Chinese traditional patent medicines using high performance liquid chromatography. Chinese J Chromatogra.;27(2):211-215.
5. Dai XM, An N, Wu JM, Li HY, Zhang QM..(2010) Development
and validation of HPLC-UV-MS method for the control of four anti-diabetic drugs in suspected counterfeit products. Acta Pharm. Sinica. 45 (3): 347-352.
6. Validation of Analytical Procedures, ICH Harmonised
Tripartite Guidelines, Q2B, 1997.
7. Synder LC., Kirkland JJ and Glajch JL,Practical HPLC Method Development, 2nd ed., John Wiley & Sons, 1997;210-556. 8. Sethi P, HPLC Quantitative Analysis of Pharmaceutical
Formulations, 1st ed.,CBS Publication and Distributor, 2001; 14-15.
*****