INTRODUCTION
Effective and efficient management of working capital is essential for survival of business entity. Management of working capital gives importance to maintaining liquidity in day-to-day operation to ensure smooth running and meet the obligations as and when it arise. The elements of working capital are cash, marketable securities, debtors, inventories, creditors etc. As far as current liabilities are concerned, the firms are liable to pay these obligations on a timely basis but within a year.
The requirement of the working capital depends on the length of the operating cycle. The operating cycle starts with acquisition of raw martial and ends with the realization of cash from the sale of goods and services. If number of day of cycle is long, then more working capital will be required and vice versa.
Estimation of exact need of working capital is not possible. The certainty in estimating working capital need reduces the amount of investment in current assets. Large investment in current assets restricts investment in fixed assets and leads to low rate of return on investment whereas a smaller investment in current assets interrupts the operating activity of a firm. Investment in
*Corresponding author
ABSTRACT
The purpose of this paper is to compare short term fund management of Tata Steel and SAIL. The current study is analytical in nature. The researchers collect, compile and analyze publically available data. The data for the study is current assets (CA), current liabilities (CL), working capital, EBIT, capital employed (CE), fixed assets (FA) of the sample company. Besides, the ratios like current ratio (CR), return on capital employed (ROCE). These ratios of selected companies collected from the Annual Reports over the period 2006 to 2015. Descriptive as well as inferential statistical tools are used to draw conclusions. The study depends more on empirical procedures rather than a theoretical justification. The research is totally based on publically available information and limited with regard to the time span and sample size. No holdout sample has been used and the entire data set is subjected to simple statistical analysis. This to some extent limits the findings and implications. The results first suggest that, short term fund and profitability position of TATA Steel is different SAIL and second, positive relationship between risk & profitability, liquidity of both the sample company.
ARTICLE INFO
Article History
Received 24th May 2016 Received in revised form 5th June 2016
Accepted 12th June 2016
KEY WORDS:
Current Assets, Current Liabilities, Working Capital, Capital employed, Fixed Assets
current assets is guided by working capital policy. Conservative policy gives importance on huge investment in current assets which means lower return and risk, whereas aggressive policy aims at higher return and risk. This tradeoff is not only between risk and return but also liquidity and profitability.
Liquidity is used in technical sense. The ability to repay the obligations as and when matures, the firm has to hold larger current assets. It will result into less risk and less return situation for the firm because the liquid firm has less risk of insolvency. Need for higher profitability compels a relatively low level of current assets. It leads to a profitable situation for the firm because fewer funds are tied up in idle current assets. This situation is a risky situation; as solvency is threaten by profitability.
REVIEW OF LITERATURE
Many previous research studies have indicated the relations between working capital management, liquidity, profitability, risk and many more factors of a company in different environments. Refuse (1996) in his article “Working Capital Management: An urgent need to refocus" concluded that suppliers were not interested SHORT TERM FUND MANAGEMENT IN COMPARATIVE FRAMEWORK:
THE TATA STEEL AND SAIL EXPERIENCE.
Satyapriya Sen
in interest on their money, rather they wanted their money. Further, he pointed out that that adopting the strategy of delaying payment to creditors for improvement of working capital was an inefficient and damaging strategy, both to its practitioners and to the economy as a whole. He has suggested that working capital reduction was possible through stock reduction.
Eljelly (2004) make study on ‘Liquidity-profitability Tradeoff: An empirical Investigation in an Emerging Market’ by using regression analysis and correlation. He pointed out that liquidity management involves planning and controlling of current assets and current liabilities to eliminate the risk of inability to meet short-term obligations and minimize investment in current assets. Further, he concluded that cash conversion cycle have greater importance than current ratio as a measure of liquidity. Concentrating on relationship between profitability and liquidity ‘a negative relationship was found’.
Padachi (2006) in his study ‘"Trends in Working Capital Management and its impact on firms' performance: An analysis of Mauritian small manufacturing firms"’ analyzed practices that are expected to assist managers in identifying areas to improve the financial performance of their operation. He indentified that the working capital needs and internal cash generation rate of an organization change over time. Raheman and Naser (2007) examined the working capital management and profitability position of Pakistani firms on 94 Pakistani firms listed on Karachi Stock Exchange over a period of 6 1999 – 2004 and observed a negative relationship between variables of working capital management and profitability. Solano et. al (2007) reviewed the effect of working capital management on SME profitability. The sample size 8872 small to medium sized companies and the period of study was 1996-2002 and pointed out that smaller cash conversion cycle will help in improve the profitability. So, he suggested that to improve liquidity and profitability the managers should try to reduce their inventories and the number of days for which their accounts are outstanding.
Ddnulepiu(2010) in the article ‘working capital Management and profitability: A case of AIba country companies’ analyze the financial statements of 20 companies over a period of 5 year i.e. from 2004-2008 by using Pearson correlation analyses. The relation between efficiency of the working capital management and profitability was studied and observed a negative linear
correlation between working capital management indicators and profitability rates.
Dong and Su (2010) examined the relationship between profitability, cash conversion cycle and its components for listed firms in Vietnam Stock market and indentified a strong negative relationship between profitability and the cash conversion cycle. The limitation of this study was its time period. The study was carried out over a short time period in comparison with some of the earlier (Deloof 2003, Shin and Sonen 1998) studies about the relationship between Working Capital Management and profitability.
Bhunia and Khan (2011) analyzed the liquidity management efficiency of Indian steel company in their research ‘Liquidity Management Efficiency of Indian Steel Companies (a Case Study)’. Financial details of 230 steel companies collected over the period of 2002 -2010from CMIE database. They have indentified the liquidity and profitable position of Indian Steel Companies is good and satisfactory.
Patel and Parjapati (20l2) analyzed financial statement of five steel companies to know the comparative position and uses of working capital. Various analyses such as ratio analysis and operating cycle analysis have been used. The study reveals that Tata steel Ltd has highest changes over of net working capital during holding period followed by Jindal steel ltd & it is negative with JSW steel. Net operating cycle of Jindal steel and Tata steel is negative in each year that shows there is a very good working capital management in these companies.
OBJECTIVE OF THE STUDY
The objectives of this study are to examine the working capital management efficiency of two Sample Company in particular to:
1. To measure the liquidity and profitability position of the company
2. To measure the relationship between liquidity, profitability and risk factor of the company.
METHODOLOGY
• The company should be a listed company in any one of the stock exchanges.
• Chronological availability of the data for the period of ten years i.e., 2006 to 2015.
Based on the above conditions 2 companies from Iron & Steel Industry were selected. Each selected company was treated as a sample unit of research.
The companies selected from Iron & Steel Industry were TATA Steel from the private sector and SAIL from the Govt. Sector. Period of the study for the above research work covered ten financial years. The cross sectional indicators related to liquidity, solvency and profitability have been collected over a period from 2006 to 2015 that constitute the panel data matrix for the study.
The data for the study were collected from secondary sources like Annual reports and web site of selected companies, web site of BSE and NSE, and money control.com. The data consists of current assets (CA), current liabilities (CL), working capital, EBIT, capital employed (CE), fixed assets (FA) of the sample company. Besides, the ratios like current ratio (CR), return on capital employed (ROCE) have been computed.
Descriptive as well as inferential statistical tools were used to arrive at any conclusion. The hypotheses for the study were tested with 95% of significance level.
HYPOTHESES
Both the company belongs to steel industry having leading position in private sector (TATA) and public sector (SAIL). It is presumed that there shall not be significant difference in financial parameters of both the companies. The specific null hypothesis shall be framed to test the objectives of the current study.
H01: There is no significant difference between the liquidity positions of both the company
H02: There is no significant difference between Profitability and Solvency positions of both the company H03: The association between liquidity and profitability in TATA and SAIL are same.
LIMITATIONS OF THE STUDY
The study depends more on empirical procedures rather than theoretical proof. The researcher has drawn conclusion by way of analyzing the secondary data and not used any theoretical modeling. The period of study was restricted to ten financial years covering 2006 -2015. The sample size for the study was only two companies therefore any generalization of the findings of the study may be subjected to certain cautions. Several other qualitative factors, which might have influenced the working capital management, were not taken into consideration in this study.
ANALYSIS
Current asset, current liabilities and working capital of TATA Steel were presented in table 1. Minimum value of current asset and liabilities was Rs. 4997 and 6913.83 crore whereas the maximum value was 38196.34 and 23765.64 crore. The average amount of current asset and liabilities was Rs 17262.723 and 15251.143 crore respectively whereas the deviation in current asset and liabilities was 9041.357 and 6260.689. It was clear from the values of standard deviation that the spread of current liabilities was less than current assets. Concentrating on working capital it was observed that out of 10 years, positive working capital was only in four years. In year over year change, highest average change was recorded for current assets whereas lowest for working capital.
Table 2: Liquidity Position of SAIL
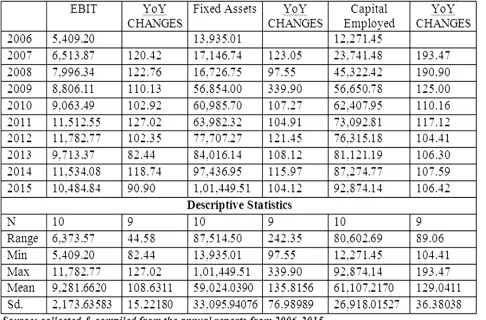
EBIT, Fixed asset and Capital employed of Tata Steel is summarized in Table 3. The average amount of EBIT, Fixed asset and Capital employed over last 10 year was Rs. 9281.662, Rs. 59024.039 and Rs 61107.217. EBIT of TATA Steel was Rs. 5409.4 in the year 2006 which increased to 10484.84 by the end of 2015. In case of capital employed, it was Rs. 13,935.01 but by the end of 2015 it was increased to 101449.51. The Average YOY growth in EBIT, Fixed asset and Capital employed were 108.631, 135.816 and 129.041.
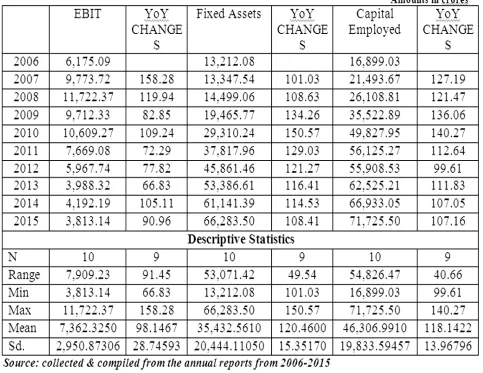
Table 4: EBIT, Fixed Asset and Capital Employed details of SAIL
Table 5: Different Ratios of Tata Steel and SAIL
Legends: CR – Current Ratio, ROCE- Return on Capital Employed & RK-Risk Factor
Table 1 presents the some important ratios of both the company. Current ratio of Tata steel was 0.72 in 2006 and by the end of 2008 it was at the top by reaching 3.92 but by the end of 2015 it decreased to 0.62. Range of the current ration of TATA steel was 3.35. In case of SAIL, current ratio was 1.23 in 2006 and by the end of 2010 it was at the top(2.05) but by the end of 2015 it decreased to 1.2. The average current ratio over last ten years was 1.303 for TATA Steel and 1.568 for SAIL. ROCE of both the steel company have shown a decline trend over the period of study. ROCE of TATA steel was .39 in 2006 which came down to .10 by the end of 2015 whereas in case of SAIL it was .47 in 2006 and by 2015 it was .06. The RK ratio of TATA steel has shown a great degree of fluctuation over period of study. It was -0.33 in 2006 but in 2007 and 2008 it was positive again in 2009 it was -0.02 and finally by the end of 2015 it was 0.6. The average value of RK was -0.027. Whereas in SAIL it was positive for all the ten years and the average value RK was 0.343.
HYPOTHESIS TESTING
The 1st objective of the study is to analyze the liquidity and profitability position of both the sample organization and make a comparison between them. Hypothesis 1 and 2 formulated to prove the above objective.
H01: There is no significant difference between the liquidity positions of both the company
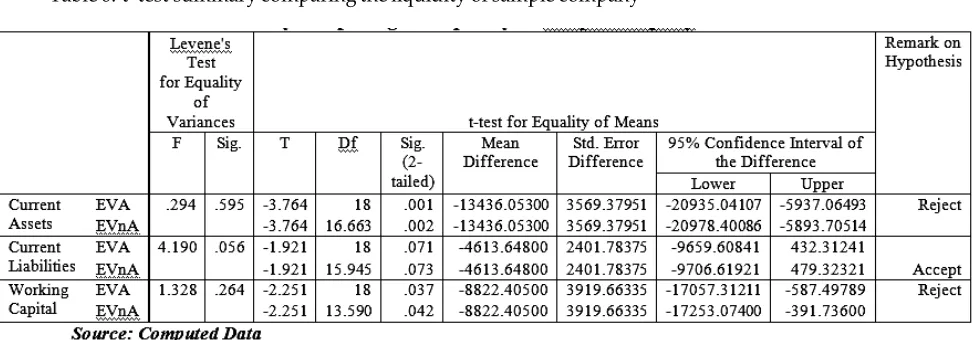
Table 6:‘t’ test summary comparing the liquidity of sample company
The ‘t’ Value of 3 variables of liquidity namely; current asset, current liabilities and working capital is -3.764, -1.921, -27.19 and -2.251 respectively at 18 df. At 95% confidence level the ‘P value’ of current asset, current liabilities and working capital is 0.001, 0.071 and 0. 037. The ‘P value’ is less than the 0.05 for current asset and working capital rejects the null hypothesis. Further, ‘P value’ for current liabilities is greater than 0.05 leads to accept the null hypothesis.
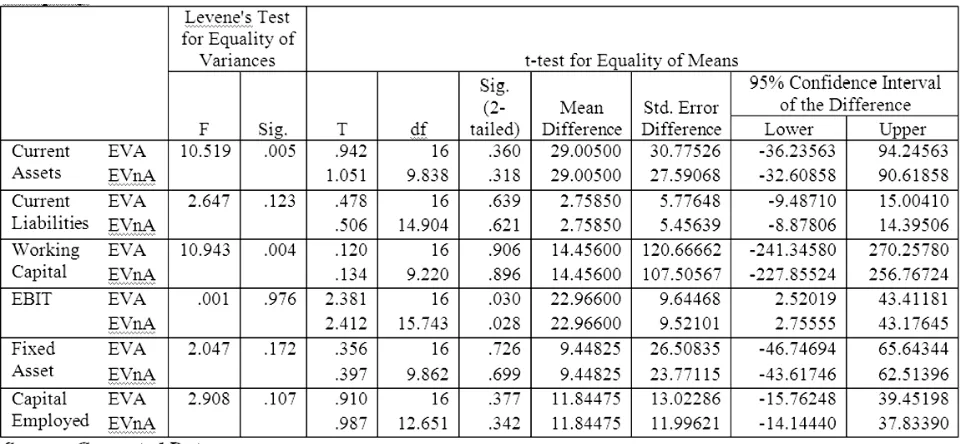
Table 7: ‘t’ test summary comparing EBIT, Fixed Asset and Capital Employed of sample company
The ‘t’ Value of 3 ratios namely; CR, ROCE and RK is -0.779, -1.202, -27.19 and -2.416 respectively at 18 df. At 95% confidence level the ‘P value’ of CR, ROCE is greater than 0.05, accepts the null hypothesis. Further, ‘P value’ for RK is less than 0.05 leads to reject the null hypothesis.
for Equality of Variances t-test for Equality of The ‘t’ test summary on YoY growth of 6 variables namely; current asset, current liabilities, working capital EBIT, fixed asset and capital employed presented in above table. ‘P value’ of YoY growth of EBIT is 0.03 at 95% confidence level. The ‘P value’ is less than the 0.05 for rejects the null hypothesis. But, for rest 5 variables ‘P value’ is greater than 0.05 leads to accept the null hypothesis.
Second objective of the study was to measure the relationship between liquidity, profitability and risk factor of the company. To justify the objective the researcher put the following hypothesis
H03: The association between liquidity and profitability in TATA and SAIL are same
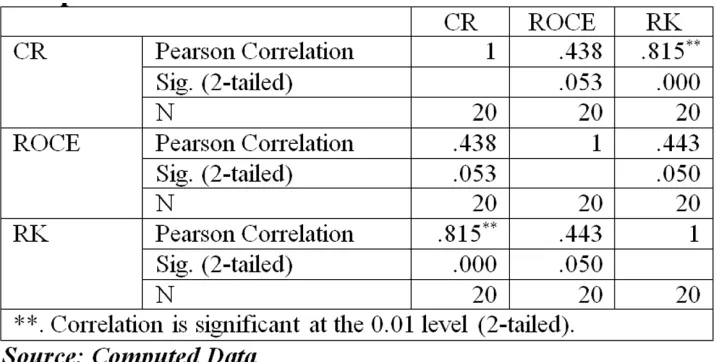
Table 10: Correlation Summary among liquidity, profitability and risk factor Sample Companies as a whole
It is observed from the data that the correlation between all the pairs CR-ROCE, CR-RK and ROCE-RK) are positive. While testing the nature of relationship, the correlation is significant at the 1% level between liquidity (CR) and risk (RK) whereas for rest two pairs are not significant. The correlation between CR-ROCE, CR-RK and ROCE-RK is 0.438, 0.815 and 0.443respectvily.
Correlation between CR-ROCE, CR-RK and ROCE-RK for TATA steel was presented in above table. It is observed that the correlation between CR-ROCE, CR-RK is positive and significant at 5% and 1% level respectively whereas correlation between micro credit and savings of SSG members is negative. Further, the correlation between ROCE-RK is positive. While testing the nature of relationship, the correlation value is 0.730, 0.836 and 0.618 respectively for CR-ROCE, CR-RK and ROCE-RK. These high values reveal a high degree impact of each variable on other.
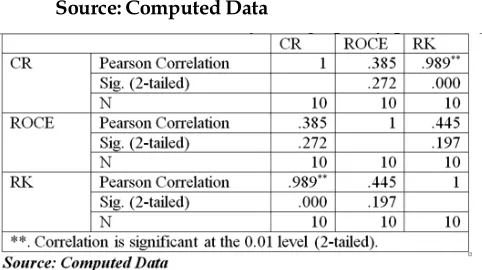
Table 12: Correlation Summary among liquidity, profitability and risk factor for SAIL
**. Correlation is significant at the 0.01 level (2-tailed).
Source: Computed Data
difference is observed statistically.
The study shows that there is a positive relationship between risk & profitability, liquidity of both the sample company.
REFERENCES
• Bhunial' A. and Khan, I.u. (20il),'Liquidity Management Efficiency of Indian Steel Companies (a Case Study),, Vol 3 No 3.
• Dong, H.P. and Su, J. (2010), "The Relationship between working capital Management and Profrtability: A vietnam case", international Research journal of Finance and Economics, ISSN 1450-2887, Issue 49.
• Danulepiul' E.A. (2010), "working capital Management and profitability: A case of AIba country companies", Annales Uniitatis Apulensis Series of economical, vol 12, pp364-374.
• Eljelly, A. (2004). "Liquidity-profitability Tradeoff: An empirical Investigation in an Emerging Market", International Journal of commerce & Management, vol. 14 No 2 pp.48 - 61.
• Garcia-Teruel, P. J. and Martinez-Solano, P. (2007)"Effects of working capital management on SME profitability", International Journal of Managerial Finance, Vol. 3 Iss: 2, pp.l64 - 117.
• MonChangesut, S., Fuenzalida, D., Cubillas, C. and Cubillas, J. (2008), "Determinants of Working Capital in Latin American Companies", www.ub.eduy'iafi/ Recerca./Seminars/ Papersamuel pdf., Retrieved on September 3, 2010.
• Padachi, K. (2006), "Trends in Working Capital Management and its impact on firms' performance: An analysis of Mauritian small manufacturing firms", Oxford Business and Economics conference Pro Changesam, Volume 2, No. 2 pp. 45-58.
• Patel, J.A. and Parjapati, K. (2012), "A Comparative Study on Working Capital Management of selected steels companies in India", Asian Journal of Research in Business Economics and management, Volume 2, No. 7.
• Refuse M. (1996), "Working Capital Management: An urgent need to refocus", Journal of Management Decision, Volume 34, No. 2, pp. 59-63.
• Ramudu, P.J. and Rao, S.D. (2008), "Working Capital Management - A review of Research", Journal of Finance India, Volume 22, No.3, pp. 988-996.
• Raheman, A. and Nasr, M. (2007)," Working Capital Management and Profitability - Case of Pakistani Firms", International Review of Business Research Papers, Vol 3, No.l, pp.219 - 300.
The result of Pearson Correlation of SAIL shows the significance relationship between CR-RK at 1% level of significant. Further, concentrating on relationship between CR-ROCE and RK-ROCE, it is observed that the correlation value is low i.e., 0.385 and 0.445 and not significant at 5% level
Findings and Conclusion
The primary objective of this study is to analyze the liquidity and profitability of the sample company and compare their financial position. The results disclose that; The average value of current assets and working capital of SAIL is much higher than TATA steel but there is no significant difference is observed in case of current liabilities.
The average value of EBIT, Fixed Assets and Capital employed of TATA steel is similar to SAIL. Further, average current value ratio and return on capital employed of both the sample firms are same whereas the risk (RK) is in Tata Steel higher as compare to SAIL.