SHIV SHAKTI
International Journal in Multidisciplinary and
Academic Research (SSIJMAR)
Vol. 5, No. 4, August 2016 (ISSN 2278 – 5973)
A COMPARATIVE STUDY OF PUBLIC SECTOR BANKS AND
PRIVATE C SECTOR BANKS WITH REFERENCE TO
NON-PERFORMING ASSETS
Sanjai Vani
Impact Factor = 3.133 (Scientific Journal Impact Factor Value for 2012 by Inno
Space Scientific Journal Impact Factor) Global Impact Factor (2013)= 0.326 (By GIF)
Indexing:
Introduction
Banking companies doing great things for the world economy and remains as a backbone of economy of any country. Their business is accepting money deposits from savers and then lending the same money to borrowers, banking activity push the flow of money to productive use and investments. Banks are not only depend deposits for their resources needs, but also, create credit by recycling the funds received back from the borrowers. Liquidity of finances and flow of money is essential for any healthy and growth oriented economy. But bankers not able to collect their loans and advances with interest on due date, this loans and advances become the non performing assets. A non performing asset (NPA) is a loan or advance for which the principal or interest payment remained overdue for a period of 90 days It affects the banking industry as the cancer.
Meaning of NPA
An account is declared as NPA based on the recovery of installments and interest on loans and advanced and other aspects as per RBI norms. The updated norms to declare the account as NPA are as follows as per RBI guidelines:1
1. An asset, including a leased asset, becomes non-performing when it ceases to generate income for the bank
2. A non performing asset is a loan or an advance where;
(i) Interest and or installment of principal remain overdue for a period of more than 90 days in respect of a term loan
(ii) The account remains ‘out of order’ in respect of an overdraft/cash credit (OD/CC), if the outstanding balance remains continuously in excess of the sanctioned limit/drawing power. In cases where the outstanding balance in the principal operating account is less than the sanctioned limit / drawing power, but there are no credits continuously for 90 days as on the date of Balance sheet or credits are not enough to cover the interest debited during the same period, these accounts should be treated as ‘out of order’
(iii) The bill remains overdue for a period of more than 90 days in the case of bills purchased and discounted.
(iv) The installment of principal or interest thereon remains overdue for two crop seasons for short duration crops.
(v) The Installment of principal or interest thereon remains overdue for one crop season for long duration crops.
(vi) The amount of liquidity facility remains outstanding for more than 90 days, in respect of securitization transaction undertaken in terms of guidelines on securitization dated February, 1, 2006.
(vii) In respect of derivate transactions, the overdue receivables representing positive mark-to-market value of derivative contract, if these remain unpaid for a period of 90 days from the specified due date for payment.
1
Review of Literature
The non-performing assets (NPAs) is discussed in many research works across the world. The various comparative studies available on NPA helped the researcher to analyse the NPA of Private and public sectors banks in India.
Faizanuddin, Md and Mishra R.K. (2011) has explained a conceptual framework of the NPA and examined the dimensional approach of NPA in the banking system in India with special focus on State Bank of India, Patna Circle, Bihar. K.K.Siraj and P.Sudarsanan Pillai provided a survey of the efficiency of NPA management by Indian commercial banks. They highlighted that Nationalized Banks rank better than Foreign Banks and Private Sector Banks. Problem of the Study
In the earlier 90s, the Indian banking sector is dominated by public sector banks. After liberalization, the India saw many private sector banks and foreign banks. One of the major objectives of banking sector reforms was to encourage operational self-sufficiency, flexibility and competition in the system and to improve banking standards in India to the international best practices. Based on the recommendations of various committees’ especially the Committee on Financial Sector Reforms under the chairmanship of Mr. M. Narasimham. But the every year, the rate of NPA of public sector banks has been increased. The Crisil said that the asset quality woes of banks will continue in the current fiscal with gross non-performing assets (NPA) ratio for the system growing at 0.20 per cent to 4.5 per cent by March 2016. Many peoples mentioning on their research publication on NPA that public sector banks don’t have ability to decrease and eradicate the problems of NPA, even there are some acts to prevent this disease and also they argue that private sector banks do their best than public sector banks. So, in this juncture it is necessary to make the comparison between the level of NPA of Private sector banks and Public sector banks in India.
OBJECTIVE OF STUDY
To understand Gross Advances and Gross NPAs of Public sector Banks and Private Sector Banks.
To understand Net Advances and Net NPAs of Public sector Banks and Private Sector Banks.
To know the relationship between NPA of Public and Private Sector Banks Research Methodology
In order to satisfy the framed objectives, the researcher used descriptive designs. The methodology for this research is designed considering the above aspects; to evaluate asset quality of public sector banks explained using the trend in movement non-performing assets.
Sector Banks
Hypothesis 2: There is no variacne between Net NPA of Public and Private Sector Banks
Data used for the study
In order to achieve the stated objectives, this research utilized secondary data. The required data has been taken from the website of Reserve Bank of India and other required information derived from the various websites.
Tools of Analysis
In order to satisfy the objectives of the study, the data collected were entered, arranged and presented using Microsoft Excel and SPSS and the percentage analysis and ANOVA test.
NPA Analysis
Table 1
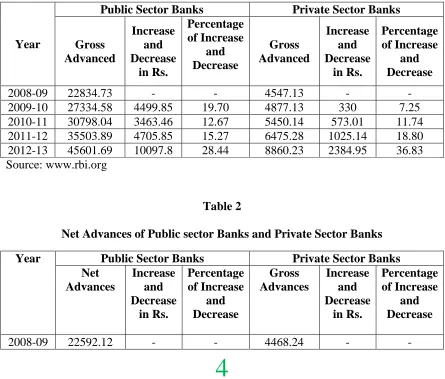
Gross Advances of Public sector Banks and Private Sector Banks
Year
Public Sector Banks Private Sector Banks
Gross Advanced Increase and Decrease in Rs. Percentage of Increase and Decrease Gross Advanced Increase and Decrease in Rs. Percentage of Increase and Decrease
2008-09 22834.73 - - 4547.13 - - 2009-10 27334.58 4499.85 19.70 4877.13 330 7.25 2010-11 30798.04 3463.46 12.67 5450.14 573.01 11.74 2011-12 35503.89 4705.85 15.27 6475.28 1025.14 18.80 2012-13 45601.69 10097.8 28.44 8860.23 2384.95 36.83 Source: www.rbi.org
Table 2
Net Advances of Public sector Banks and Private Sector Banks
Year Public Sector Banks Private Sector Banks Net Advances Increase and Decrease in Rs. Percentage of Increase and Decrease Gross Advances Increase and Decrease in Rs. Percentage of Increase and Decrease
2009-10 27013.00 4420.88 19.56 4783.58 315.34 7.057 2010-11 33056.32 6043.32 22.37 6128.86 1345.28 28.12 2011-12 38773.07 5716.75 17.29 7363.23 1234.37 20.14 2012-13 44727.74 5954.67 15.35 8733.11 1369.88 18.60 Source: www.rbi.org
Table 3
Gross Non Performing Assets of Public Sector Banks and Private Sector Banks
Year Public Sector Banks Private Sector Banks
Gross NPA As percentage of Gross Advances Increase and Decrease in Rs. Percentage of Increase and Decrease Gross NPA As percentage of Gross Advances Increase and Decrease in Rs. Percentage of Increase and Decrease
2008-09 449.57 2.0 - - 138.54
2009-10 599.26 2.2 149.69 33.30 140.17 3.1 1.63 1.17 2010-11 746.00 2.4 146.74 24.49 145 2.9 4.83 3.44 2011-12 1124.89 3.2 378.89 50.79 141.15 2.7 -3.85 -2.65 2012-13 1644.62 3.6 519.73 46.2 155.53 2.2 14.38 10.18
Source: www.rbi.org
Table 4
Net Non Performing Assets of Public Sector Banks and Private Sector Banks
Year Public Sector Banks Private Sector Banks
Net NPA As percentage of Net Advances Increase and Decrease in Rs. Percentage of Increase and Decrease Net NPA As percentage of Net Advances Increase and Decrease in Rs. Percentage of Increase and Decrease
2008-09 211.55 0.9 62.52 1.4
2009-10 293.75 1.1 82.2 38.85 52.34 1.1 -10.18 -16.28 2010-11 360 1.2 66.25 22.55 34 0.6 -18.34 -35.04 2011-12 593 1.5 233 64.72 30 0.4 -4 -11.76 2012-13 900 2.0 307 51.77 39 0.4 9 30.00
Source: www.rbi.org
Interpretation and findings:
trends of Gross advances of public sector banks are in flexible but the private sector banks shows increasing trends.
The Table 2 exhibits that both public and private sectors shows flexible trends in their net advances during the period of 2008-09 to 2012-13. The Net Advanced of Public Sector Banks Increased from the level of Rs.22,592.12 crore to the level of 44,727.74 crores during the period of 2008-09 to 2012-13. The Percentage of increase is 97.97, where as, in private sector banks it is increased by 95.44 per cent.
The Table 3 explains that, the Gross NPA of Public Sector Banks increased from Rs. 449.57 crores in 2008-09 to 1,644.62 crores in 2012-13. During 2011-12, the Gross NPA of Public Sector Banks increased by 50.79 per cent than that of previous year but during the same period, in private sector banks, it has been decreased by 2.65 per cent. In 2012-13, the NPA of Public Sector Banks increased by 46.2 per cent than the previous year, where as, in private sector banks it has been increased only by 10.18. According the Table 2, the net advances of both the Public sector banks and private sector banks has same trends but the level of increasing of Gross NPA Private sector banks is less than the Public sector banks.
The Table 4 clearly explains that the net NPA of Private sector banks in decreasing trend, but in public sector banks it shows the increasing trends. During the period of 2009-10, 2010-11, 2011-12, the net NPA of private sectors banks is in decreasing trends. But the public sector banks shows increasing trends in the same period. During 2012-13, the net NPA of Public sector banks increased by 51.77 per cent than that of previous year, but it is 30 per cent for private sector banks. During 2012-13, percentage of NPA in Advances is less than zero for the private sector banks, but it is 2 per cent for public sector banks. Hence, it can be understood that the private sector banks control its level of NPA than the Public Sector banks.
Testing Hypothesis
To know the variances between Gross NPA of Public and Private Sector Banks and variances between Net NPA of Public and Private Sector Banks. The following Null hypothesis has been framed. To test the hypothesis the chi square has been calculated with the help of Excel.
Hypothesis 1: There is no Variance between Gross NPA of Public and Private Sector Banks
F-Test Two-Sample for Variances
Public Sector Banks Private Sector Banks
Mean 912.868 144.078
Observations 5 5
df 4 4
F 4939.344126
P(F<=f) one-tail 1.22899E-07
F Critical one-tail 6.388233942
Since the p value (1.22899) greater than , the null hypothesis has been accepted at 5 per cent significant level, that is there is no variances between Gross NPA of Public and Private Sector Banks.
Hypothesis 2: There is no variance between Net NPA of Public and Private Sector Banks
F-Test Two-Sample for Variances
Public Sector Banks Private Sector Banks
Mean 471.66 43.572
Variance 77493.92175 183.15752
Observations 5 5
df 4 4
F 423.0998637
P(F<=f) one-tail 1.66534E-05
F Critical one-tail 6.388233942
Since p value (1.66534) is greater than 0.05, the null hypothesis has been accepted at 5 per cent significant level, that is there is no variances between Net NPA of Public and Private Sector Banks.
Why public sector banks have more NPA than private sector banks?
Political interference of day-today activities of banking business
Defaulters always be a politician and big businessman
Global recession
Government plays a vote bank politics
Some of the financial inclusion schemes introduced by the Government
Inefficiency of Employees of banks
Suggestions
The followings are the general suggestions to over come the NPA in public sector banks
The government should not introduce unnecessary financial inclusion schemes
The bank should not concentrate on only one sector, they should follow diversification plan on rendering plan
A proper follow up after lending is also required to check any change in the risk category initially fixed. This will enable timely decision making.
Conclusion:
In Economic times, Crisil's chief analytical officer Pawan Agarwal said that Private sector banks with better loan books will be able to raise capital, which will be difficult for the state-run lenders. Even though there is an enabling provision to reduce government stake in Public Sector Banks to 52 per cent, raising capital will be a tough task for them.2 Mr. Reghuram Rajan, the Governor of Reserve Bank of India wrote in a column on the Project Syndicate website. Regarding NPA recovery he said, “We have to improve the efficiency of the recovery system, especially at a time of economic uncertainty like the present. Recovery should be focused on efficiency and fairness – presenting the value of underlying assets and jobs where possible, even while redeploying unviable assets to new uses and compensating fairly.3 A healthy banking system is important for a strengthen the economy. The failure of the banking system may have an adverse impact on other sectors. It may be concluded that the public sector banks should give more attention on controlling and preventing of NPA than Private sector Banks.
References:
1. Adhikari, R and Oh Soo Nam (1999), Banking sector reforms: recovery prospects and policy issues, Fifth International Forum on Asian Perspectives Towards a Sustainable Financail Sysetm- Analysis and Prospects, ADB-OECD Conference, 1999
2. Aravanan, S and Vijayakumar, N (2007), Impact of NPAs on Performance of Banks, Indian Economic Panorama, Vol.17, No.3A, pp 18-21
3. Biswas, PK and Deb, AT (2005), Determinants of NPAs in the Indian Public Sector Banks: A Critique of Policy Reforms, [Online], URL: oii.igidr.ac.in:8080/dspace/bitstream/2275/131/1/biswasdeb.doc.
4. K.K. Siraj & P. Sudarsanan Pillai, Effeciency of NPA Management in Indian SCBs – A Bank
Group Wise exploratory Study, Journal of Applied Finance and Banking, Vol.3, No.2, 2013, 123-137.
5. Jayanth R. Varma, V. Raghunathan, A.Korwar and M.C. Bhatt, Narasimham Committee
Report – Some further Ramifications and Suggestions, Working Paper No. 1009, February 1992
6. Non-performing Assets – An Indian perspective, Infosys Finacle.
7. RBI report on Operations and Performance of Commercial Banks.
8. RBI report on Evolution of Banking in India
2 http://economictimes.indiatimes.com/ 3