Formulation and optimization of immediate release tablet of an anti hypertensive drug by dry granulation method
8
0
0
Full text
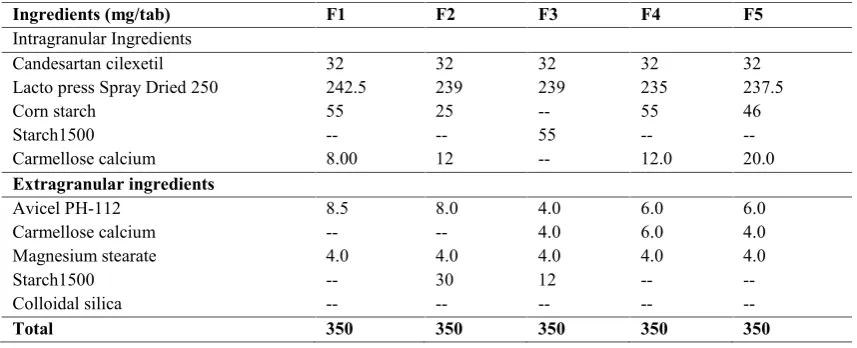
(2) 268. Sowmya C. et al., Int. Journal of Pharmacy & Industrial Research Vol – 02 Issue – 03 Jul – Sep 2012. (SDEs) from medicinal plants are very fine,. tablet characteristics. Immediate release oral. light, and poorly compressible powders. Few. dosage forms are most widely used drug. studies have examined the use of dry. delivery systems available. These products are. granulation to enhance particle size and. designed to disintegrate in the stomach. consequently to improve flowability and. followed by their dissolution in the fluids of. compressibility. the gastrointestinal tract. In limited number of. of. such. materials.. Dry. an in-vitro. in-vivo correlation. granulation can be achieved either by slugging. cases,. using a tablet press or by roller compacter.. established between the drug release and drug. Both of these processes are used for materials. product absorption necessary for therapeutic. that ordinarily will not compresssing the more. effects. Disintegration test is a standardized. conventional wet granulation techniques and. test and is primarily used as a quality. require precompression to increase density or. assurance. exclude entrapped air due to porosity.. 5. tool. to. confirm. is. complete. disintegration of solid oral dosage forms within the prescribed time when placed in a. The granulation parameters can affect the. liquid. mechanical (compressional) properties of the. conditions described in their respective official. granules, which subsequently can influence the. monographs8. The methods for the comparison. tableting behavior and tablet characteristics 6.. of in vitro dissolution profiles can be classified. The desired particle size distribution can be. into three groups: methods based on analysis. adjusted granulation. by. milling parameters. and can. sieving7.The affect. medium. under. of variance (ANOVA). the. 9, 10. experimental. model-dependent. 11. methods , and model-independent method12,. the. mechanical (compressional) properties of the. 13. granules, which subsequently can influence the. release profiles was compared with a marketed. tabletting behavior and tablet characteristics.. formulation. Therefore, the evaluation of granule properties. model-independent methods.. . In this context, The discrimination of using. model-dependent. plays an important role in the prediction of Table 1: Formula used in the different formulations Ingredients (mg/tab) Intragranular Ingredients Candesartan cilexetil Lacto press Spray Dried 250 Corn starch Starch1500 Carmellose calcium Extragranular ingredients Avicel PH-112 Carmellose calcium Magnesium stearate Starch1500 Colloidal silica Total. F1. F2. F3. F4. F5. 32 242.5 55 -8.00. 32 239 25 -12. 32 239 -55 --. 32 235 55 -12.0. 32 237.5 46 -20.0. 8.5 -4.0 --350. 8.0 -4.0 30 -350. 4.0 4.0 4.0 12 -350. 6.0 6.0 4.0 --350. 6.0 4.0 4.0 --350. www.ijpir.com. and.
(3) Sowmya C. et al., Int. Journal of Pharmacy & Industrial Research Vol – 02 Issue – 03 Jul – Sep 2012. Materials and methods. 269. tablets were prepared for each formulation. Cadilla),. Composition of prepared Candesartan cilexetil. Lactopress Spray Dried 250 (DMV-Fonterra),. immediate release tablets are presented in table. Corn starch (Roquette Freres), Carmellose. 1 Physical properties of granules of different. calcium (Maple Biotech), Magnesium stearate. formulations were determined in table 2.. Candesartan. Cilexetil. (Zydus. (Ferro corporarion), Colloidal silica (Evonik Evaluation of tablet properties. Industries GMBH).. The formulated tablets were evaluated for Solubility studies of Candesartan cilexetil. uniformity of weight, thickness, hardness,. Maximal solubility of Candesartan cilexetil in. friability and disintegration time.. different media (0.7% polysorbate in pH6.5 Phosphate Buffer, 0.7% polysorbate in pH4.5. Weight variation test. Acetate Buffer, 0.7% polysorbate in 0.001N. The variation of the weight of individual tablet. HCl, 0.7% polysorbate in 0.1N HCl) was. is a valid indication of the drug content.. studied.. Candesartan. Weight variation studies of 20 tablets were. cilexetil was taken in 50 mL of above medium. done and resulting deviations were determined. and dissolved by triplicate sonication. The. and the results were shown in the table 3.. Excess. amount. of. maximal solubility of Candesartan cilexetil in each medium was determined at different time. Thickness measurement. intervals (0, 15, 60, 120min) after filtering the. It is carried out on 20 tablets by measuring. content using HPLC method.. thickness using vernier calipers. Mean and standard deviation were determined and the. Preparation of Candesartan cilexetil tablets Immediate release. results were shown in table 3.. tablet of Candesartan. cilexetil were prepared by adopting dry. Hardness determination. granulation technique. Accurately weighed. 20 tablets were taken randomly and hardness. quantities of pre-sieved drug and intragranular. was. materials (Candesartan cilexetil, Lactopress. ®. measured. using. Hardness. tester. (Electrolab India Ltd). The mean and standard. Spray Dried 250, Corn starch, Carmellose. deviation of 20 tablets of each formulation is. calcium) were mixed & slugs were prepared,. shown in table 3.. and then passed through multimill screen (1.5”). The granules were sieved using #20. Friability test. sieves.. Friability was determined on 20 tablets. Tablet samples were weighed accurately and placed with. in fribilator (Electrolab India Ltd). After 100. extragranular materials (Magnesium stearate,. rotations (4 min at 25 rpm) loose dust was. Colloidal silica) and compressed using 9.5 mm. removed from the tablets. Finally tablets were. round flat standard concave Punches on Tablet. weighed. The loss in weight indicates the. Compression. D. ability of the tablets to withstand the wear. The. Tooling), Cadmach, INDIA.. Three batches of. percentage friability was determined by using. The. final. granules. Machine. were. (16. blended. Stations,. www.ijpir.com.
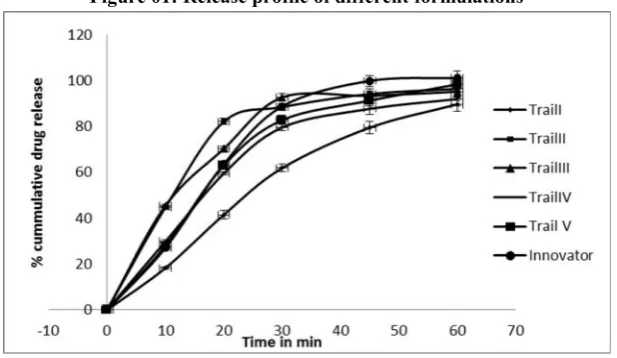
(4) 270. Sowmya C. et al., Int. Journal of Pharmacy & Industrial Research Vol – 02 Issue – 03 Jul – Sep 2012. following formula and the result was shown in. with intermittent shaking. Further dilute 5 mL. table 3.. of the above solution to 100mL. The solution was mixed well and filtered through 0.45 µm nylon filter. After injecting the blank, standard then the sample was injected and the drug content was calculated using HPLC at 227 nm.. Disintegration test Disintegration time was determined to ensure that the drug substance is fully available for dissolution. and. gastrointestinal. absorption tract.. The. from tablets. the were. examined using the USP- XXIV disintegration apparatus (Electrolab India). Six tablets were tested for each batch. The disintegration time of tablets was compared to 15 minutes which is accepted as the general tablet disintegration time for the uncoated immediate release tablets. The results of the disintegration time of. The drug content of the various formulations was shown in table 3. Model-independent methodsDetermination of dissolution data equivalence For the determination of dissolution data equivalence,. FDA. guidance. documents. recommend approaches such as the modelindependent approach based on the calculation of difference factor (f1) and similarity (f2). the various formulations were shown in table 3.. factors, which is currently applied. From a. In-vitro release studies. be less discriminating than other methods,. In-vitro release study of Candesartan Cilexetil was carried out using USP Type II dissolution apparatus (Paddle type, model TDT-08L, Electrolab, India) at 37±1°C and 50 rpm using 900 mL with 0.7% polysorbate in pH 6.5 Phosphate Buffer. Aliquots were withdrawn at predetermined. time. intervals. and. were. replenished immediately with the same volume of. fresh. dissolution. medium.. Aliquots,. following suitable dilutions, were assayed by. statistical point of view, this method seems to such. as. ANOVA. and. model-dependent. methods. According to the FDA guidance, f1 values of 0–15 and f2 values of 50–100 ensure sameness or equivalence of the two dissolution profiles. In both equations, R and T represent the dissolution measurements at P time points of. the. reference. and. test,. respectively.. Difference factor (f1) and similarity (f2) factors were calculated for every formulation and they were shown in table 4. HPLC (Shimadzu, Japan) at 227 nm. The drug. f1 =. release profiles of the various formulations. f2 = 50 log. 2 -1/2. ]. 100}. were shown in table 4. Model-dependent methods. Drug content study 5 tablets or blend equivalent to 5 tablets were weighed. and. transferred. into. 100. ml. volumetric flask. To this 70 ml of diluent (Phosphate buffer and Acetonitrile in the ratio of 30:70) was added and sonicated to dissolve. Drug release kinetics was analyzed by firstorder kinetic model, which was applied considering the amounts of drug released from 0 to 60 min. The following plot was made: log cumulative % drug remaining versus time (first-order kinetic model) and it was shown in. www.ijpir.com.
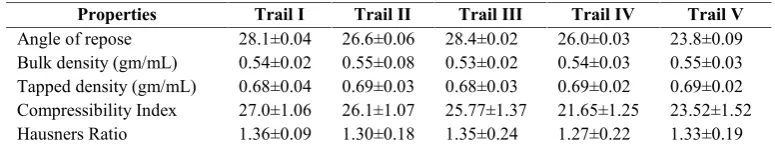
(5) 271. Sowmya C. et al., Int. Journal of Pharmacy & Industrial Research Vol – 02 Issue – 03 Jul – Sep 2012. the figure 02. K1 (First order release constant). reference product. In the third formulation. calculated for all the formulations as shown in. disntegrant(Starch 1500) was used only intra. the table 5.. granularly and only 1.2% Carmellose calcium was used extra granularly.The DT was found. Results and discussion. to increase by only 1 minute.There were no. Flow properties of the drug are important in. changes in DT with Starch1500.In the next. optimizing the method of granulation for the. formulations only corn starch and carmellose. drug product. Therefore, the flow of drug was. calcium were used. analyzed before the selection of granulation (≤1.35),. In the fourth formulation 15% of the corn. compressibility index (≤30) and angle of. starch, 3.5% of Carmellose calcium was used. repose (≤45) indicates poor flowability of drug. intra granularly as disintegrant and 1.8%. candidate, the dry granulation technique, was. (Carmellose. selected to improve the flow ability of powder. granularly.In this formulation the DT was. mixture.. found to slighly match with that of the. technique.. Hausner’s. ratio. calcium). was. used. extra. innovators DT (10-11 min).In the fifth Experiments with solubility of Candesartan. formulation the extra granular disintegrants. Cilexetil in various medium revealed that. were slightly reduced and the DT was found to. Candesartan Cilexetil is more soluble in 0.7%. be matching with that of the innovator’s. polysorabte in 0.05M phosphate buffer pH 6.5.. product.By comparing the dissolution profiles. Hence, it was selected as ideal dissolution. fourth. medium, to study in-vitro release profile of. comparable to that of the innovators product.. Candesartan Cilexetil.This medium is the FDA. The fifth formulation was found to be. recommended for the dissolution of the. matching more in terms of the similarity. Candesarten Cilexetil tablets.. factor.. The optimization of the formula was done by. First order dissolution model was constructed. varying. and t50 and t90 were calculated.. the. the. concentrations. of. the. and. the. fifth. formulations. were. disintegrants like corn starch, Starch 1500, Carmellose calcium both intra granularly and. Conclusion. extra granularly. MCC PH-112 was changed. Candesartan. only extra granularly.. tablets were prepared by dry granulation. Cilexetil. immediate. release. technique. In order to obtain the best, In the first formulaion all the physical. Optimized product five different formulations. parameters were comparable to that of the. were developed. Different disintegrants and. innovator except the disintegration time. In the. their concentration were taken as the major. second formulation corn starch was used 7%. variables. An optimized product has been. intra granularly and 8.5% (starch 1500) was. formulated by varying the above variables and. used extra granularly. The disintegration time. determining. found to reduce substantially compared to the. mechanical properties of the final product.. www.ijpir.com. their. effect. on. physical/.
(6) 272. Sowmya C. et al., Int. Journal of Pharmacy & Industrial Research Vol – 02 Issue – 03 Jul – Sep 2012. Lower compressibility and poor flow of drug. product. t50, t90 values (time taken to reach. candidate was overcome by dry granulation. 50% and 90% release simultaneously) were. (slugging). Release of the drug from the tablet. calculated and these values of the optimized. was found to follow the first order kinetics,. formulation were found to match with the. Similarity factor was calculated and the Trail. innovators product.. V was found to match with the innovator Table 01: Flow properties (Pre compression parameters) of the different formulationsMean and standard deviations were included Properties Angle of repose Bulk density (gm/mL) Tapped density (gm/mL) Compressibility Index Hausners Ratio. Trail I 28.1±0.04 0.54±0.02 0.68±0.04 27.0±1.06 1.36±0.09. Trail II 26.6±0.06 0.55±0.08 0.69±0.03 26.1±1.07 1.30±0.18. Trail III 28.4±0.02 0.53±0.02 0.68±0.03 25.77±1.37 1.35±0.24. Trail IV 26.0±0.03 0.54±0.03 0.69±0.02 21.65±1.25 1.27±0.22. Trail V 23.8±0.09 0.55±0.03 0.69±0.02 23.52±1.52 1.33±0.19. Table 02: Physical Chemical parameters of the tablets of the various formulationsMean and standard deviations were included Physical parameter Hardness (N) Thickness (mm) DT (min) Friability (%w/w) Weight (mg) Drug content(%w/w). Trail I 59±3.40 4.25±0.13 5-6 0.48 351.23±3.1 98.17±3.55. Trail II 62±2.56 4.2±0.76 7-8 0.02 348.01±1.3 97.1±1.29. Trail III 64±4.5 4.26±0.35 8-9 0.12 355±2.11 101.7±1.4. Trail IV 65±1.77 4.22±0.36 10-11 0.10 352.12±1.5 98.7±1.09. Trail V 67±2.33 4.2- 0.15 10-12 0.22 352±1.55 98.9±0.34. Table 03: In vitro release studies of the various formulations Time 10 20 30 45 60. Reference 27.1± 0.65 63.6± 0.77 88.8±1.34 99.9± 2.33 98.4±3.02. % Mean cumulative drug release ± S.D. Trail I Trail II Trail III Trail IV 18.3±0.45 45.5±0.48 44.8±0.37 29.9±0.59 41.5±1.88 70.3±0.97 82.1±1.33 59.5±0.66 61.9±1.67 92.7±1.78 88.5±1.65 79.6±1.29 79.5±2.56 93.4±1.88 94.2±2.21 87.7±2.5 89.7±3.77 95.2±3.89 96.4±3.78 92.0±3.01. Trail V 28±0.76 63.1±0.56 82.8±1.77 91.3±2.47 98.4±3.02. Table 04: f1 and f2 Values for Each Comparison Formulation Trail I Trail II Trail III Trail IV Trail V. f1 22.75 11.41 9.95 8.89 3.92. f2 36.5 46.60 51.36 56.54 68.31. Dissolution profile Dissimilar Dissimilar Similar Similar Similar. Table 05: Release characteristics Trail I II III IV V Reference. First order Equation y = -0.0168x + 2.0606 y = -0.0244x + 1.9012 y = -0.0232x + 1.9011 y = -0.0192x + 1.9862 y = -0.0294x + 2.1086 y = -0.0359x + 2.1203. First order R2 0.9887 0.9549 0.8915 0.9799 0.9731 0.9519. K1(min-1) 0.038 0.056 0.053 0.0442 0.0677 0.0826. t50 (min) 24.5 11.5 12.2 16.5 16.8 17.2. t50 (min): Time taken to reach 50% cumulative drug release t90 (min): Time taken to reach 90% cumulative drug release N.A.: Not applicable. www.ijpir.com. t90 (min) N.A. 28.5 32.5 48 38 34.
(7) Sowmya C. et al., Int. Journal of Pharmacy & Industrial Research Vol – 02 Issue – 03 Jul – Sep 2012. 273. Figure 01: Release profile of different formulations. Figure 02: First-order plots for different formulations.. ARR – Amount remaining to be released. References 1.. 2.. H.P. Rang, M.M. Dale, J.M. Ritter, R.J. Sixth Edition; 305-310.. dosage forms tablets, Vol3, Second. Gilbert S. Banker Christopher T. Rhodes;. edition, Marcel Dekker,Inc, New York. fourth edition, Marcel Dekker,Inc, New. ,pp: 195-245. 6.. B.Schwartz,. Pharmaceutical. Joseph. Bultmann J M; Multiple compaction of. Vijaykumar N, Venkateswarlu V and. microcrystalline cellulose in a roller. Raviraj. compactor. Eur J Pharm Biopharm. 2002;. P. Research. Journal. of. 54:59-64.. Pharmaceutical, Biological and Chemical Sciences October – December 2010. 7.. Description. of. Candesartan. Freitag F, Kleinebude P; How do roll compaction/dry granulation affect the. RJPBCS 1(4) Page No. 952-63. 4.. Herbert.A. Liebermen, Leon Lachman,. Flower; Rang and Dales Pharmacology.. York ; pp:55-57. 3.. 5.. cilexetil;. http://www.drugbank.ca/drugs/DB00796. tablet behavior of inorganic materials? Comparison. of. four. magnesium. carbonates. Eur J Pharm Sci. 200319:281289. www.ijpir.com.
(8) 274. Sowmya C. et al., Int. Journal of Pharmacy & Industrial Research Vol – 02 Issue – 03 Jul – Sep 2012. 8.. United States Pharmacopeia 30/National Formulary. 25.. Pharmacopeial 9.. 2008.. The. Convention,. 11. Sathe, P. M.; Tsong, Y.; Shah, V. P. In. U.S.. vitro. dissolutionprofile. comparison:. Inc.. statistics and analysis, model dependent. Rockville, MD. (www.usp.org). approach. Pharm. Res. 1996, 13,1799–. Mauger, J. W.; Chilko, D.; Howard, S. On. 1803.. the analysis of the dissolution data. Drug. 12. Podczeck, F. Comparison of in vitro. Dev. Ind. Pharm. 1986, 12,969–992.. dissolution profiles by calculating mean. 10. Polli, J. E.; Rekhi, G. S.; Augsburger, L.. dissolution time (MDT) or mean residence. L.; Shah, V. P.Methods to compare. time (MRT). Int. J. Pharm. 1993, 97, 93–. dissolution profiles and arationale for. 100.. wide. dissolution. specifications. for. metoprolol tartrate tablets. J. Pharm. Sci.. 13. Moore,. 1997, 86,690–700.. J.. W.;. Flanner,. H.. H.. Mathematical comparison of dissolution profiles. Pharm. Technol. 1996, 6, 64–74.. www.ijpir.com.
(9)
Figure
Related documents
Figure 1 BI-1 mRNA analysis by quantitative absolute real-time PCR using SYBR Green I: in control specimens (Control), liver sam- ples from patients with chronic hepatitis
We aimed to assess the effects of short-term treatment of irbesartan and hydrochloro- thiazide on plasma NT-proBNP levels and health-related quality of life (HRQOL) in subjects
Eigen value and moving load analyses are carried out to obtain the natural frequencies as well as the displacement of the simulated model, respectively, under
The study includes demand-supply scenario in the Industry, Proposed investments by domestic and foreign players, Factors driving growth, Issues & Challenges, Key
We looked for evidence of the fol- lowing sesamoids: basipterygoid-pterygoid sesamoid, ulnar patella, palmar sesamoid, metacarpal and metatarsal sesa- moids, penultimate
16 In the present study, we sought to investigate whether video education had an effect on patient knowledge of cataract surgery, patient satisfaction with the visit and provider,
Molecular docking studies indicated that the piperine derivative 2a stably interacts with the amino acid residues of the PPAR γ complex active site, which is consistent with the
start collision, i.e., we set the initial values to zeros (the real initial values for a0~a7 are presented in Step 1. The attack is so-called semi-free start
