M.Aarthy et al, International Journal of Computer Science and Mobile Applications,
Vol.2 Issue. 3, March- 2014, pg. 25-34 ISSN: 2321-8363
©2014, IJCSMA All Rights Reserved, www.ijcsma.com 25
A COMPARISON OF HISTOGRAM
EQUALIZATION METHOD AND
HISTOGRAM EXPANSION
M.Aarthy
1, P.Sumathy
21
Research scholar, School of Computer Science and Engineering, Bharathidasan University Tiruchirappalli-620023, India
2
Assistant professor, School of Computer Science and Engineering, Bharathidasan University Tiruchirappalli-620023, India
Abstract
The histogram equalization is an approach to enhance a given image.Histogram equalization methods are Histogram expansion, Local area histogram equalization (LAHE), Cumulative histogram equalization, Par sectioning, odd sectioning. Histogram expansion is a technique of histogram equalization. This research paper described three different techniques of expansion namely dynamic range expansion, linear contrast expansion and symmetric range expansion. Each of these has their specific strength and weakness. For coloured images linear contrast expansion is used. These all methods help in easy study of histograms and helps in image enhancement.
Keywords: Histogram Methods, Histogram Expansion, Dynamic Range Expansion, Linear Contrast Expansion, Symmetrical Histogram Expansion
I.
INTRODUCTION
A. HISTOGRAM
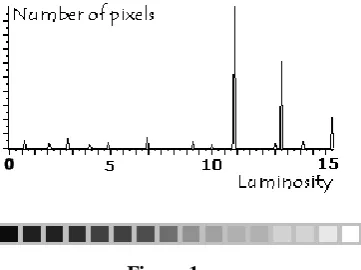
Histogram can be defined as the graphical distribution of pixels over the tonal range or luminous intensity. In statistics, a histogram is a graphical representation of the distribution of data. It is an estimate of the probability distribution of a continuous variable and was first introduced by Karl Pearson.
M.Aarthy et al, International Journal of Computer Science and Mobile Applications,
Vol.2 Issue. 3, March- 2014, pg. 25-34 ISSN: 2321-8363
©2014, IJCSMA All Rights Reserved, www.ijcsma.com 26
We can do modification of histogram in order to correct the contrast of under-exposed and over-exposed images. Histograms are also used to study distribution of various components of the images. Various histogram processing are histogram equalization and histogram matching. In this section comparison of histogram equalization methods and histogram expansion-a technique of histogram equalization have been described [1].
II.
HISTOGRAM EQUALIZATION
The histogram equalization is an approach to enhance a given image. The approach is to design a transformation T (.) such that the gray value in the output is uniformly distributed in [0, 1]. It also called
histogram flattening. Histogram equalization can be described as method in which histogram is modified by spreading the gray level areas. This can be shown as;
Let us consider an input histogram hi and that produces a modified histogram h by histogram expansion that is close to any uniformly distributed histogram u, then histogram equalization can be described as:
u h h
h i
min (1)
a)
Methods for histogram equalization
There are a number of different types of histogram equalization algorithms, such as cumulative histogram equalization, normalized cumulative histogram equalization, and localized equalization. These methods were studied and compared in order to determine which one offers the best equalization and is also best suited to DSP implementation. Here is a list of different histogram equalization methods:
• Histogram expansion
• Local area histogram equalization (LAHE) • Cumulative histogram equalization • Par sectioning
M.Aarthy et al, International Journal of Computer Science and Mobile Applications,
Vol.2 Issue. 3, March- 2014, pg. 25-34 ISSN: 2321-8363
©2014, IJCSMA All Rights Reserved, www.ijcsma.com 27
III.
ADVANTAGES AND DISADVANTAGES OF HISTOGRAM METHODS
METHOD
ADVANTAGE
DISADVANTAGE
Histogram Expansion Simple and enhance contrasts of an
image.
If there are gray values that are physically far apart from each other in the Image, then this method fails.
LAHE Offers an excellent enhancement of
image contrast.
Computationally very slow,
requires a high number of operations per pixel.
Cumulative Histogram Equalization
Has good performance in
histogram equalization.
Requires a few more operations because it is necessary to create the cumulative histogram.
Par Sectioning Easy to implement. Better suited to hardware
implementation.
Odd Sectioning Offers good image contrast. Have problems with histograms
which cover almost the full gray scale.
IV.
HISTOGRAM EXPANSION
a)
ADJUSTABLE HISTOGRAM EXPANSION
For this we have
u h
h
h i u i 1 1 1 . 1
' (2)
M.Aarthy et al, International Journal of Computer Science and Mobile Applications,
Vol.2 Issue. 3, March- 2014, pg. 25-34 ISSN: 2321-8363
©2014, IJCSMA All Rights Reserved, www.ijcsma.com 28
There are various methods present for histogram equalization. Few of these are histogram expansion which is described in this paper. Others are Dualistic sub-image histogram equalization (DSIHE), by modifying cumulation function, gray level grouping (GLG), etc. All these techniques are used for image enhancement purposes. [2][3]
This is denoted by HE. It is explained as remap of a sub-range intensity of an input image to full range in an output image. Input range is x [xmin, xmax] and output range to which it is stretched is y [0,255]. This mapping can be described by using the following linear mapping function:
max min max min y x x x x y
(3)
Histogram expansion can be shown in figure 4.
b)
MODIFIED HISTOGRAM EXPANSION
Provides greater enhancement in the cases where histograms have narrow peak and tails to end of each side of peak. In this we have new lower and upper bounds described as:
) ( min n mi 100 2 ) 100 ( : n
mi h x
x x x P x
(4)
Where ( )
min max x h x x T
) ( max x ma 100 2 100 x
ma h x
x x x T P x
M.Aarthy et al, International Journal of Computer Science and Mobile Applications,
Vol.2 Issue. 3, March- 2014, pg. 25-34 ISSN: 2321-8363
©2014, IJCSMA All Rights Reserved, www.ijcsma.com 29
Where P is user selected cut-off percentage and it ranges from 97% down to 84%. The mid P% of intensities are stretched to full range and tails that comprise of (100-P)/2% each are compressed. [4]
c)
DYNAMIC RANGE EXPANSION
Dynamic range expansion can be explained as expansion of unused range. This can be on both the sides i.e. lower bound and upper bound here pixel values remain same. This is mainly done so that visualizing the image can be relived from stress and fatigue i.e. into range that suits normal eye.
This is also called as normalization. There can be two kinds- linear and nonlinear normalization.
We can explain this by taking initial range as I: {Min, Max} and new range as IN :{ newMin, newMax} then linear normalization is as shown:
newMin MinMax
newMin newMax
Min I
IN
(6)
Nonlinear normalization can be shown as:
newMax newMin
newMinIN
1
1 1
(7)
Where α is width of input intensity range and β is intensity around which range is centered.
M.Aarthy et al, International Journal of Computer Science and Mobile Applications,
Vol.2 Issue. 3, March- 2014, pg. 25-34 ISSN: 2321-8363
©2014, IJCSMA All Rights Reserved, www.ijcsma.com 30
d)
LINEAR CONTRAST EXPANSION
This method is used to solve brightness saturation problem. Visibility is improved by stretching the contrast this is done by assigning the new values to the pixels. The pixels to the darkest side are taken as black and to lightest side are taken as white. The pixels lying between light and dark are changed the pixel values to improve the contrast.
M.Aarthy et al, International Journal of Computer Science and Mobile Applications,
Vol.2 Issue. 3, March- 2014, pg. 25-34 ISSN: 2321-8363
©2014, IJCSMA All Rights Reserved, www.ijcsma.com 31
max min
minmin max
min
y y
y x
x x x
y
(8)
M.Aarthy et al, International Journal of Computer Science and Mobile Applications,
Vol.2 Issue. 3, March- 2014, pg. 25-34 ISSN: 2321-8363
©2014, IJCSMA All Rights Reserved, www.ijcsma.com 32
e)
SYMMETRICAL HISTOGRAM EXPANSION
This is histogram expansion in spatial domain with high embedding. . For embedding bins are evacuated by moving them to both sides. In this a pivotal bin is chosen and bin pixel value is embedded into its left or right of pivotal bin. For this we use n-buddy number-in which lower n bits of any number differ by 1 bit.2 and 3 are1-buddies of each other,4,5,6,7, are 2 buddies of each other. In this expansion is done by moving the pixel value to empty neighbour n-buddy .Embedding process can be mathematically written as:
W C
CW n n
.2
2 (9)
M.Aarthy et al, International Journal of Computer Science and Mobile Applications,
Vol.2 Issue. 3, March- 2014, pg. 25-34 ISSN: 2321-8363
©2014, IJCSMA All Rights Reserved, www.ijcsma.com 33
V.
STRENGTH AND WEAKNESS OF HISTOGRAM EXPANSION
METHOD STRENGTH WEAKNESS
DYNAMIC RANGE EXPANSION
1) It can preserve the losses that occur due to contrast gains or clippings as in case of shadows, or in photographs that have back lit background (e.g. direct sunlight, light snow).
*
LINEAR CONTRAST EXPANSION
1). Simple to implement
2). Increase contrast of image i.e. too dark image will become more visible.
If there are gray values that are physically far apart from each other in the image, then this method fails.
SYMMETRICAL HISTOGRAM EXPANSION
(1)The algorithm is simple one. (2)There is no need to evacuate all the bins for embedding purpose because pivot bins can be shifted on both sides.
(3)Here fewer watermarks bits need histogram shifting.
*
VI.
CONCLUSION AND FUTURE WORK
Histogram expansion leads to enhancement of image .The images with shadows can be clearly observed using dynamic range expansion. Contrast expansion can be used to solve brightness issues. Further many more algorithms can be explained for this technique of histogram expansion. Also we can use various methods of histogram equalization for improving contrast of images. This research paper provides an overview of histogram methods and expansion by presenting their advantages and disadvantages of the dynamic range, linear contrast and symmetrical histogram expansion and then makes their comparative analysis so to analyse their advantages and disadvantages. The objective is to make observations about how the advantages and disadvantages of these expansion and methods can be improved. Each expansion introduced in this chapter has its own advantage and disadvantages in different histogram equalization. Therefore, it is hard to say which one is the best .In future in this paper we are including large number of histogram methods, histogram equalization and histogram expansion.
REFERENCES
[1]“Histogram”‟http://en.kioskea.net/contents/video/traitimg.php.
[2] Tarik Arici, Salih Dikbas, Yucel Altunbasak “A Histogram Modification Framework and Its Application for Image Contrast Enhancement” IEEE, 2009.
[3] Al Bovik, Handbook of image and video processing.
M.Aarthy et al, International Journal of Computer Science and Mobile Applications,
Vol.2 Issue. 3, March- 2014, pg. 25-34 ISSN: 2321-8363
©2014, IJCSMA All Rights Reserved, www.ijcsma.com 34
[5] “Histogram Transformation”, http://pixinsight.com/doc/tools/HistogramTransformation/Histogram Transformation.html
[6]”normalization (image processing)”, Wikipedia.com.