M. Kavitha1, S. Adhikari2, K.K. Anikuttan3 and D. L. Prabu4
1
Molluscan Fisheries Division, Tuticorin Research Center of Central Marine Fisheries Research Institute, Tuticorin, Tamil Nadu
2
Soil and water chemistry section, Aquaculture Production and Environment Division,Central Institute of Freshwater Aquaculture, Bhubaneshwar
3
Mariculture Division, Mandapam Regional Center of Central Marine Fisheries Research Institute, Mandaam, Tamil Nadu
4
Central Marine Fisheries Research Institute, Ernakulam, Kochi
Abstract
A fifteen days experiment was conducted with the application of different agrochemicals such as lime, dolomite and gypsum in two levels to find out the phosphorous reduction potential of these chemicals at laboratory. Among the 3 agrochemicals gypsum showed better phosphorous reduction at the dose of 40 mg/L followed by dolomite had comparatively high phosphorous reduction than lime application. The water quality parameters indicates that application of these chemicals at the rate of 20 and 40 mg/L dose level did not produce any adverse condition on the pH, alkalinity and hardness values. Hence, application of gypsum at the rate of 40 mg/L is recommended for use in aquaculture ponds to reduce the phosphorous load in the water.
Keywords: Phosphorous, Lime, Dolomite, Gypsum, pH
I. INTRODUCTION
Aquaculture industry is growing day by day both in area and volume of production, to satisfy human food needs. Further, there is an enough scope for horizontal as well as vertical expansion of aquaculture sector. But, in the present scenario availability of good quality water is the major constraint for aquaculture operation. Because freshwater aquaculture ponds receive water from natural water bodies such as lakes, rivers and reservoirs which are indiscriminately polluted by untreated effluent discharge from different industries, farming activities, pesticide and fertilizer rich agricultural runoff, sewage and household waste. Since, the natural water source is highly polluted which leads to undesirable effects on the receiving aquaculture pond particularly by increasing the phosphorous, nitrogen and organic load and pave a path for excessive growth of algae including toxic algal blooms known as eutrophication. This may produce a variety of nuisance conditions, including a threat to the aquatic life by decreasing the level of dissolved oxygen in water. Generally, unpolluted water bodies such as tropical rivers contain total phosphorus in the ranges between 0.6 – 1.86 mg/L [1]. Beyond this level the water body is prone to eutrophication. In river Ganges, the phosphorous concentration has been increased to 2-2.5 mg/L in last two decades while in Mansarovar reservoir very high concentration of phosphorous (4-13 mg/L) was recorded due to effect of pollution which very much higher than the normal acceptable limit of nutrients.
of nutrient rich water received from natural source for aquaculture purpose. In this context, control or removal of excessive phosphate could be performed by changing the soluble phosphates into its insoluble or adsorbed forms through biological or chemical methods. Generally, chemicals such as CaCO3, Ca(OH)2, CaO, gypsum, alum and dolomite are serve as precipitants and cationic adsorbents which are more frequently used for removal of nutrients from polluted water because they are inexpensive. The chemical substances mainly produce inactive insoluble complex with nutrients through which it will show their effects on nutrient removal. These insoluble phosphate complexes are relatively less available for absorption by plankton since it is strongly bound up in the bottom sediments. Hence, the present study was conducted to determine the effect of different aquaculture chemicals such as lime, dolomite and gypsum at different dose levels on the phosphorus reduction from phosphorous rich (1 mg/L) water.
II. MATERIAL AND METHODS
An experiment was conducted to do the comparative study on effect of lime, dolomite and gypsum on phosphorus reduction in water. The present study was conducted over a period of 15 days in soil and water chemistry section, Central Institute of Freshwater Aquaculture, Bhubaneshwar, India.
2.1. Experimental setup
The experiment was carried out in glass cylindrical tanks of 10 L capacity. The experimental tanks were washed thoroughly with clean water and filled with 10 L water. The experiment was conducted with 1 control, 6 treatments with each of three replicates following completely randomised design. All the tanks were added with 1 mg phosphorous/L. The experimental tanks were denoted as C (control), L20 (lime 20 mg/L), L40 (lime 40 mg/L), D20 (dolomite 20 mg/L), D40 (dolomite 40 mg/L), G20 (gypsum 20 mg/L) and G40 (gypsum 40 mg/L).
2.2. Physico-chemical parameters of water
The standard acid titration method was used for the estimation of total alkalinity and total hardness [4]. Total phosphorus (TP) determination was carried out with the standard spectrophotometric method using visible U.V spectrophotometer (APHA 1998). The pH was done with digitally calibrated pH meter (HANNA, Model pH211).
2.3. Statistical analysis
The effect of application of different agrochemicals on the level of phosphorous reduction was done with one way ANOVA. Duncan’s multiple range test was used to determine the significant differences between all treatment means. All statistical analysis was done using the software package SPSS (version 16).
III. RESULTS AND DISCUSSION
Aquaculture production is significantly influenced by the condition and quality of the pond input water. In the present scenario, pond input water is rich in nutrients especially phosphorous due to the impact of environmental pollution. Hence, treating the pond water for nutrient reduction before starting the culture activity is mandatory. In the present study, lime, dolomite and gypsum were used for the determination of total phosphorous reduction.
3.1. Phosphorous reduction
phytoplankton through the efficient reduction of dissolved phosphorous level by precipitation of calcium phosphate and reducing carbonate level through calcium carbonate formation.
Figure 1: The percentage of phosphorous reduction in different treatments at different duration
L20 = lime 20 mg/L, L40 = lime 40 mg/L, D20 = dolomite 20 mg/L, D40 = dolomite 40 mg/L, G20 = gypsum 20 mg/L, G40 = gypsum 40 mg/L.
Mean values in the same row with different lower case superscript differ significantly (P<0.001). Data expressed as Mean ± SE, n=3.
Table 1: The level of phosphorous (ppm) in different treatments at different duration
Days C L20 L40 D20 D40 G20 G40 P
value 1 1.03d
±0.03 0.77 c ±0.03 0.50 b ±0.00 0.73 c ±0.07 0.40 b ±0.00 0.47 b ±0.03 0.17 a
±0.03 <0.001
3 1.13 d ±0.03 0.73 c ±0.07 0.43 b ±0.03 0.67 c ±0.07 0.37 b ±0.03 0.40 b ±0.06 0.13 a
±0.03 <0.001
5 1.20 d ±0.00 0.67 c ±0.07 0.37 b ±0.03 0.67 c ±0.07 0.37 b ±0.03 0.37 b ±0.03 0.08 a
±0.00 <0.001
10 1.07d
±0.03 0.63 c ±0.03 0.37 b ±0.03 0.60 c ±0.00 0.33 b ±0.03 0.33 b ±0.03 0.05 a
±0.00 <0.001
15 0.87e
±0.03 0.60d ±0.00 0.37b ±0.03 0.50c ±0.06 0.30b ±0.00 0.30b ±0.00 0.05a
±0.00 <0.001 The dolomite treatment, D40 showed around 60-70% of phosphorous reduction during the duration of experiment. Similarly, bibliography [8] observed that dolomite application showed the efficiency of 67% of phosphorous removal from 5.0 mg/dm3 phosphate solutions at pH 6.2. Bibliography [9] also found that dolamite application reduce the level of phosphorous from septic tank waste around 70% in the first month.
Dolamite reduce the level of phosphorous from effluent water through the formation of less soluble calcium or magnesium phosphate through the exchange of carbonate ions by phosphate present in the water.
soft-water lakes can lower the rates of total phosphorous release. The calcium carbonate can be effectively utilized for decreasing phosphate concentrations from 1.5 ppm to 0.4 ppm which accounts for approximately 70% of reduction of phosphorous [11]. The least or no phosphorous reduction was observed in control and all the treatment groups were highly and significantly different (P<0.001) from control.
3.2. pH
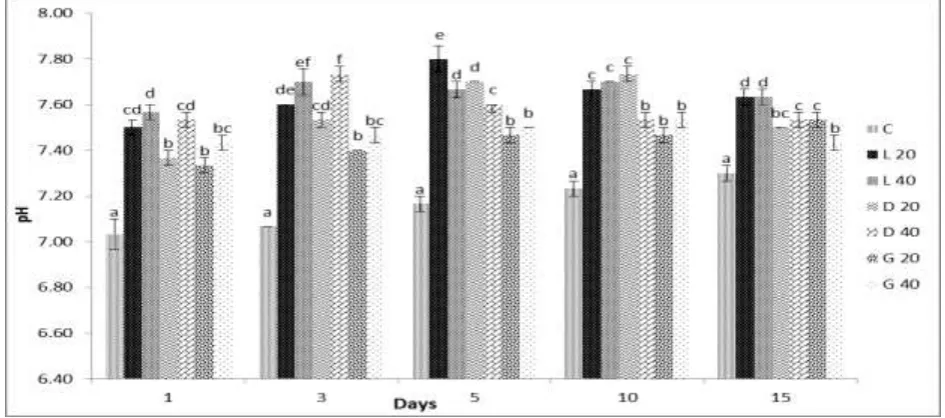
In pond water pH value is generally fluctuates greatly based on the time of the day due to photosynthesis because during photosynthesis phytoplankton utilizes available CO2 and hence increase the pH. The rapid change in pH, even within the normal acceptable range of fish species, can leads to the death of the fish [12]. The pH value of different treatments was recorded and depicted in Fig. 2.
There is significant difference (P<0.001) exists in pH value of different treatments at different periods of experiment. Lime applied treatments L20 and L40 were showed maximum pH on the same day of application and gradually reduced as the duration of experiment proceeds further. This is agreement with Bibliography [13], observed that pH value is greatly increased as the dose of lime increased although it gradually decreases as the duration of application increased. Next to lime, dolomite applied treatments were showed higher increase in pH than gypsum application. Dolomite application initially increased the pH value and the value got slightly reduced 5 days after addition. According to [14], dolomite application in the pond neutralises acidity and increases pH.
Figure 2: The value of pH on different treatments at different duration
The bars for different treatments in particular day with different lower case alphabets differ significantly (P<0.001). Data expressed as logarithmic mean ± SE, n=3.
Among the all treatments G20 and G40 treatments were exhibited comparatively less increment in value of pH. The gypsum application may increase the pH value to certain extent and it can also helps to reduce the pH of water provided the available chloride level in the water is < 50 mg/L but the effectiveness of gypsum treatment on pH reduction is subject to debate. In the control experimental tanks, the pH was almost stable entire period of the experiment where as in all the other experiment groups the pH value was started decreasing after 5 days of agrochemicals application.
3.3. Alkalinity
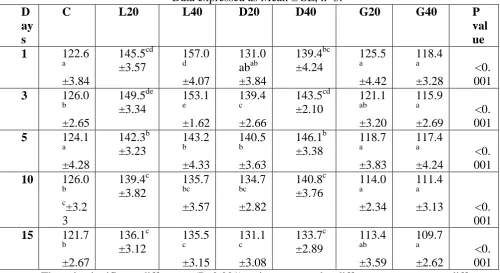
Table 2: The level of alkalinity (ppm) in different treatments at different duration
Mean values in the same row with different lower case superscript differ significantly (P<0.001). Data expressed as Mean ± SE, n=3.
D ay s
C L20 L40 D20 D40 G20 G40 P
val ue
1 122.6
a ±3.84 145.5cd ±3.57 157.0 d ±4.07 131.0 abab ±3.84 139.4bc ±4.24 125.5 a ±4.42 118.4 a ±3.28 <0. 001
3 126.0
b ±2.65 149.5de ±3.34 153.1 e ±1.62 139.4 c ±2.66 143.5cd ±2.10 121.1 ab ±3.20 115.9 a ±2.69 <0. 001
5 124.1
a ±4.28 142.3b ±3.23 143.2 b ±4.33 140.5 b ±3.63 146.1b ±3.38 118.7 a ±3.83 117.4 a ±4.24 <0. 001
10 126.0
b c ±3.2 3 139.4c ±3.82 135.7 bc ±3.57 134.7 bc ±2.82 140.8c ±3.76 114.0 a ±2.34 111.4 a
±3.13 <0. 001
15 121.7
b ±2.67 136.1c ±3.12 135.5 c ±3.15 131.1 c ±3.08 133.7c ±2.89 113.4 ab ±3.59 109.7 a ±2.62 <0. 001 There is significant difference (P<0.001) exists among the different treatments at different periods of the experiment. The alkalinity value showed a declining trend from the day one to fifteen of the experiment. Among the different treatments comparatively lower alkalinity value was observed in gypsum applied G40 treatment and the maximum alkalinity was noticed in treatment where lime applied (L40). The overall maximum alkalinity of 157 ppm was recorded during the first day in L 40 treatment and overall minimum was noticed in G40 treatment on 15th day of experiment. This is agreement with Boyd (1990) [6] who found that input of lime increased the total alkalinity of pond water which will maintain desirable effect on increasing buffering capacity and pH stability of pond water. The present result is correlating with the reports of [15] who explained that application of gypsum reduce the total alkalinity due to the release of increased concentration of calcium which precipitate more calcium carbonate. In the present study the alkalinity of dolomite applied treatments exhibit slightly less value than the lime applied treatment. Similarly, bibliography [16] reported that dolomite application produced lesser alkalinity than CaCO3.
3.4. Hardness
Figure 3: The level of hardness on different treatments at different duration
The bars for different treatments in particular day with different lower case alphabets differ significantly (P<0.001). Data expressed as Mean ± SE, n=3.
According to [17] lime application in fish culture ponds is used to neutralize soil and water acidity and hence, increase total alkalinity and total hardness concentrations in water. In the present study, gypsum application increases the hardness of the water than lime and dilamite treated water. This is in agreement with Boyd (1990) [6] who reported that gypsum application can produce more hardness beyond that lime can produce due to its more solubility in water than lime and dolomite but it does not neutralise acidity of water as like lime do. Bibliography [18] observed that if total alkalinity is above 50 mg/L, addition of only gypsum will increase the total hardness because in such situation application of agricultural lime will not be effective.
IV. CONCLUSION
Application of chemicals such as gypsum, dolomite and lime showed the reduction of phosphorous from the water in the order of Gypsum > Dolomite >Lime. Gypsum is superior in phosphorous removal because it will leads to the formation of more insoluble calcium phosphate precipitates and it also more soluble in water than the remaining two agrochemicals. Among dolomite and lime, dolomite is better than lime due to the presence of both calcium and magnesium carbonate which may exert better phosphorous precipitation capacity than lime. The phosphorous reduction was increased as the time increases and maximum reduction of phosphorous was attained within 10 days. The maximum of 95% phosphorous reduction was achieved by application of 40 mg/L gypsum on 10th day of the experiment. Hence, gypsum at the dose of 40 mg/L could be recommended for the reduction of phosphorous from the inlet water for aquaculture.
V. ACKNOWLEDGEMENT
The authors are grateful to Director, Central Institute of Freshwater Aquaculture, Bhubaneshwar for providing the necessary facilities to carry out this research work. The authors also thankful to Director, Central Marine Fisheries Research Institute for permitting to get professional attachment training in CIFA.
REFERENCE
[1] Furnas, M. J. 1992. The behavior of nutrients in tropical aquatic ecosystems. Pages 29-68 in D. W. Connell and D. W. Hawker, editors. Pollution in Tropical Aquatic Systems. CRC Press Inc., London, U.K.
[3] Boyd, C. E. 1998. Water Quality for Pond Aquaculture. Research and Development Series No. 43. International Center for Aquaculture and Aquatic Environments, Alabama Agricultural Experiment Station, Auburn University, Alabama. APHA (American Public Health Association, American Water Works Association, and Water Pollution Control Federation). 1998. Standard Methods for the Examination of Water and Wastewater, 20th edition. American Public Health Association, Washington, DC.
[4] Hepher, B. 1962. Ten years of research in fish ponds fertilization in Israel, II. Fertilizers dose and frequency of fertilization, Bamidgeh, 15:78-92.
[5] Boyd, C. E. 1990. Water quality in ponds for Aquaculture, Birmingham Publishing Company, Alabama.
[6] Wu, R. and Boyd, C. E. 1990. Evaluation of calcium sulfate for use in aquaculture ponds. The Progressive
Fish-Culturist, 52:26-31.
[7] Perera, S. and Priyantha, N. 1999. Removal of phosphate from aqueous medium by dolomite -potential method for treatment of industrial effluents. Ceylon Journal of Science: Physical Sciences, 6:51-56.
[8] Sikora, L. J.; Bent, M. G.; Corney, R. B. and Keeney, D. R. 1976. Septic nitrogen and phosphorous removal test systems. Ground water, 14:309-314.
[9] Smayda, T. 1990. The influence of lime and biological activity on sediment pH, redox, and phosphorus dynamics.
Hydrobiologia, 192:191-203.
[10] Yanamadala, V. 2005. Calcium carbonate phosphate binding ion exchange filtration and accelerated denitrification improve public health standards and combat eutrophication in aquatic ecosystems. Water Environment Research,
77:3003–3012.
[11] Swingle, H. S. 1957. Relationship of pH of pond waters to their suitability for fish culture. Pages 72-75. Proceedings of the 9th Pacific Science Congress. 18 November-9 December 1957. Bangkok, Thailand.
[12] Boyd, C. E. and Massaut, L. 1999. Risks associated with the use of chemicals in pond aquaculture. Aquaculture
Engineering, 20:113-132.
[13] Arce, R. and Boyd, C. E. 1975. Effects of agricultural limestone on water chemistry, phytoplankton productivity and fish production in soft water ponds. Transactions of the American Fisheries Society, 104:308-349.
[14] Mandal, B. K. and Boyd, C. E. 1980. Reduction of pH in waters with high total alkalinity and low total hardness.
The Progressive Fish-Culturist, 42:183-184.
[15] Watzlaf, G. R. and Hedin, R. S. 1993. A method for predicting the alkalinity generated by anoxic limestone drains. Page 8. Proceedings 14th Annual Meeting West Virginia Surface Mine Drainage Task Force, 27-28 April 1993. West Virginia University, Morgantown, WV.
[16] Boyd, C. E., Wood, C. W. and Thunjai, T. 2002. Aquaculture pond bottom soil quality management, Pond Dynamics/Aquaculture Collaborative Research Support Program, Oregon State University, Oregon.