Open Access
Research
Ethnic differences in BMI among Dutch adolescents: what is the role
of screen-viewing, active commuting to school, and consumption of
soft drinks and high-caloric snacks?
Amika S Singh*
1, Mai JM Chinapaw
1, Johannes Brug
2, Stef PJ Kremers
3,
Tommy LS Visscher
2,4and Willem van Mechelen
1Address: 1VU University Medical Center, EMGO-Institute, Department of Public and Occupational Health, Amsterdam, the Netherlands, 2VU
University Medical Center, EMGO-Institute, Amsterdam, the Netherlands, 3Department of Health Education and Health Promotion, Universiteit
Maastricht, Maastricht, the Netherlands and 4Vrije Universiteit, Institute for Health Sciences, Amsterdam, the Netherlands
Email: Amika S Singh* - [email protected]; Mai JM Chinapaw - [email protected]; Johannes Brug - [email protected]; Stef PJ Kremers - [email protected]; Tommy LS Visscher - [email protected]; Willem van
Mechelen - [email protected] * Corresponding author
Abstract
Background: The threats posed by the rising prevalence of overweight and obesity on public health have been widely acknowledged. Several population groups, which deserve special attention because of their higher prevalence rates, have been identified. These include adolescents and ethnic sub-groups. The aim of the present study was twofold: (1) to assess ethnic differences in body mass index (BMI) and in behaviours that are related to both energy intake and energy expenditure, and (2) to examine whether these behaviours explain the relationship between ethnicity and BMI.
Methods: We conducted a cross-sectional data analysis among 957 Dutch adolescents (mean age = 12.7 years). Body height and weight were measured using a standardized protocol. Adolescents completed a questionnaire on screen-viewing behaviour, physical activity, consumption of sugar-containing beverages, and consumption of high-caloric snacks.
Results: In our study sample 121 adolescents (= 13%) were of Non-Western origin. BMI was significantly higher in Non-Western adolescents (boys: 19.9 kg/m2, SD = 3.0, girls: 20.9 kg/m2, SD
= 3.8) compared to Dutch adolescents (boys: 18.4 kg/m2, SD = 2.8, girls: 19.0 kg/m2, SD = 3.0). Our
results show that time spent on television viewing, active commuting to school, and consumption of fruit juices partially mediated the association between BMI and ethnicity.
Conclusion: Behaviours related to both energy expenditure and energy intake may contribute to the ethnic differences in BMI in adolescents and should be considered when tailoring overweight prevention programs to ethnic subpopulations.
Trial registration: International Standard Randomised Controlled Trial Number ISRCTN87127361
Published: 21 April 2009
International Journal of Behavioral Nutrition and Physical Activity 2009, 6:23 doi:10.1186/1479-5868-6-23
Received: 27 June 2008 Accepted: 21 April 2009
This article is available from: http://www.ijbnpa.org/content/6/1/23
© 2009 Singh et al; licensee BioMed Central Ltd.
Background
The threats that the rising prevalence of overweight and obesity pose on public health have been widely acknowl-edged [1]. Several high-risk groups have been identified with increased prevalence rates of overweight and obesity, among which adolescents [2] and ethnic subgroups [3,4].
Onset of overweight during adolescence is particularly worrisome. Not only is it a strong predictor for increased risk of overweight in adulthood [5], but overweight status during adolescence is also associated with increased mor-bidity and mortality in later life [6]. Moreover, during adolescence health behaviours, among which energy bal-ance-related behaviours (e.g. sedentary behaviour, physi-cal activity, consumption of soft drinks and energy-dense snacks), are subject to important changes [7]. Unfavoura-ble behavioural patterns established during this age period are vital in the development of adult health behav-iours [8], and are therefore important for weight status in adulthood.
The burden of the obesity epidemic is not equally shared by all segments of the population. Several studies show that the prevalence of obesity is disproportionally high among ethnic subgroups and among people with lower socio-economic position, both in the adult population [9] and in youth [4,10-14]. Although socio-economic class and ethnicity are strongly correlated, it is established that the latter is independently associated with health [15]. The factors that govern this independent association may be related to cultural differences in underlying causes of excessive weight gain, overweight and obesity.
Although weight gain is influenced by many factors, it is clear that energy balance-related behaviours are playing a major role in the onset of overweight. Risk behaviours that are associated with excessive weight gain in adoles-cents are sedentary behaviour (especially screen-viewing behaviour), lack of physical activity, and consumption of high-caloric foods and beverages [16]. Population data suggest that ethnic disparities with regard to overweight are established during adolescence [13,17]. It thus seems likely that these disparities reflect behavioural differences between ethnic groups that arise in the transition from childhood to adolescence [7]. Understanding how the dif-ferent energy balance-related behaviours contribute to ethnic disparities in BMI in adolescents may enable us to target preventive intervention programs to specific sub-groups. In the present cross-sectional study, we assessed ethnic differences in body mass index (BMI) and energy balance-related behaviours among a sample of adoles-cents attending prevocational secondary education in the Netherlands. Furthermore, we examined whether and which behaviours mediated the association between eth-nicity and BMI.
Methods
Design and subjects
We conducted a cross-sectional data analysis, using base-line data collected in September 2003 from adolescents participating in a randomized controlled study, i.e. the Dutch Obesity Intervention in Teenagers (DOiT). Details on the aim, design and methods of DOiT have been pub-lished elsewhere [18]. All first year students of the 18 par-ticipating schools were invited for participation in DOiT; no inclusion criteria were set for students to participate. Written informed consent was obtained from all students and their parents. The Medical Ethical Committee of the VU University Medical Center approved the study proto-col.
Measures
Body composition
Trained research assistants performed anthropometric measurements, according to a standardized protocol. Body height was measured with an accuracy of 1 mm with a portable stadiometer (Seca 225). Body weight was meas-ured and recorded within 0.1 kg with a calibrated elec-tronic flat scale (Seca 888). Students were dressed in underwear during all measurements. We calculated body mass index (BMI) and used age and sex specific cut-off points to classify weight status according to the criteria of the International Obesity Task Force [19].
Questionnaire General
Demographic and behavioural data were derived from a questionnaire that adolescents completed in the class-room. A teacher and/or member of the DOiT-team super-vised the completion of the questionnaires.
Ethnicity
'ethnicity' with subdivisions 'Dutch' and 'Non-Western' to refer to the ethnic differences as defined above.
Behaviour
The following energy balance-related behaviours were addressed: (1) consumption of sugar-containing bever-ages (i.e. consumption of soft drinks and fruit juices [mil-lilitres/day]), (2) consumption of high-caloric snacks (i.e. consumption of savoury snacks and sweet snacks [por-tions/day]), (3) screen-viewing behaviour (i.e. time spent on television viewing and computer use [minutes/day]), and (4) physical activity (i.e. active transport to school, participation in organized sports, and participation in unorganized sports [minutes/day]). Since there are no val-idated Dutch questionnaires addressing the behaviours selected for our study, we adapted other validated ques-tionnaires on dietary intake [21,22], screen-viewing behaviour [23], and physical activity [24] in adolescents. The structure of the questionnaire was equal for all behav-iours. For a more detailed description of the questionnaire see appendix 1. The questionnaire was pre-tested for clar-ity and duration, among adolescents not participating in the study by means of cognitive interviewing [25].
Frequency and quantity were multiplied in order calculate daily consumption (separately for weekdays and weekend days). Weekday consumption (multiplied by 5) and weekend day consumption (multiplied by 2) were summed up and divided by 7 to calculate mean daily con-sumption. Since some subjects reported unrealistic values with regard to values above the 95th percentile were recoded as the value of the 95th percentile.
Statistical analyses
We calculated descriptive statistics for anthropometric measures, and assessed differences between Dutch and Non-Western adolescents in these variables (Kolmogorov; Smirnov Z), and in the prevalence of overweight/obesity (Pearson; Chi-Square). As most of the behavioural varia-bles were skewed, we calculated means and medians, and the 25th and 75th percentiles for all behaviours. We exam-ined differences between Dutch and Non-Western adoles-cents in energy balance-related behaviours with non-parametric Mann-Whitney Tests.
To test for mediation by sedentary behaviour, physical activity, consumption of soft drinks and energy-dense snacks we followed the principles outlined by Baron and Kenny [26]. Consistent with Baron and Kenny's condi-tions (see figures 1 and 2), a variable funccondi-tions as a medi-ator when it meets the following four criteria: (1) the independent variable (ethnicity) must be associated with the outcome variable (BMI) (crude model); (2) the inde-pendent variable (ethnicity) must be associated with the mediator variables (energy balance-related behaviours);
(3) the mediator variables (energy balance-related behav-iours) must be associated with the outcome variable (BMI) after controlling for the independent variable (eth-nicity) (adjusted models); and (4) the relationship between the independent variable (ethnicity) and the out-come variable (BMI) is significantly diminished when adjusting for the mediator variables (energy balance-related behaviours).
We calculated three (multiple) regression equations [27], with ethnicity as an independent dichotomous variable (Dutch = 0, Non-Western = 1). Furthermore, a Sobel Test [28] was conducted to assess if the relationship between ethnicity and BMI significantly decreased after energy bal-ance-related behaviours were added to the regression model (criterion 4).
The signs and magnitudes of the regression coefficients indicate whether or not the third variable is a mediator or if it must be interpreted as a suppressor. If both regression coefficients share the same sign, a decreased adjusted association indicates (partial) mediation, while an increased adjusted association or an opposite sign indi-cates suppression/inconsistent mediation [29].
We report the unstandardized Beta statistics from linear regression that can be interpreted as the difference between Dutch and Non-Western adolescents.
Missing data (due to absence at the measurement day due to illness, doctor's visit, et cetera) on demographics, body composition, and energy balance-related behaviours were not imputed. In case data on weekend consumption (or Mediated relationship (according to Baron and Kenny [26])
Figure 1
Mediated relationship (according to Baron and Kenny [26])
mediator variable
independent variable outcome variable
Energy balance-related behaviours (EBRBs) as a mediator variable of the relationship between BMI and ethnicity (Dutch versus Non-Western)
Figure 2
Energy balance-related behaviours (EBRBs) as a mediator variable of the relationship between BMI and ethnicity (Dutch versus Non-Western)
EBRBs
activity) were not complete, weekday data were used to calculate the mean score for the daily score, and vice versa.
Significance levels were set at p ≤ .05. All analyses were conducted using SPSS version 13.0.
Results
Participation and completion rate
A total of 18 schools, located throughout the Netherlands, participated in the study. Of 1323 invited adolescents, 1108 (84%) returned both the parental and student informed consent. Complete data from anthropometric measurements and questionnaires were obtained from 1014 (92%) adolescents. After exclusion of the group of Western immigrants, data of 957 (94%) adolescents were available for the present analyses.
Ethnic differences in body composition
In table 1 anthropometric data of our study sample are presented, stratified for gender and ethnicity. Mean age of the sample was 12.7 (SD = .5) years. Approximately 13% (N = 121) of all adolescents were of Non-Western origin. BMI and prevalence rates of obesity differed significantly between Dutch and Non-Western boys and girls, with sig-nificantly lower BMI and overweight/obesity prevalence rates in Dutch adolescents.
Energy balance-related behaviours
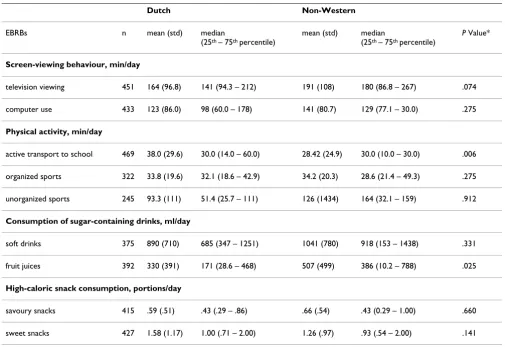
In table 2 and 3 means and medians for all energy bal-ance-related behaviours are shown. In the text below we present medians.
Screen-viewing behaviour
Non-Western adolescents reported on average to watch more television than their Dutch peers. The difference of approximately 39 minutes per day between Dutch boys (141 minutes) and their Non-Western peers (180 min-utes) was not statistically significant (p = .074). Non-Western girls reported on average 161 minutes per day of
television viewing versus 120 minutes per day in Dutch girls (p = .033). Computer use was also higher in Non-Western adolescents. Differences in computer use between Dutch and Non-Western adolescents were not statistically significant.
Physical activity
Dutch adolescents reported on average more active com-muting to school than their Non-Western peers. Differ-ences were statistically significant both in boys (p = .037) and girls (p = .006). Differences between Dutch and Non-Western adolescents with regard to sports participation, both organized and unorganized, were not statistically significant.
Sugar-containing beverage consumption
Soft drink and fruit juice consumption was lower in Dutch than in Non-Western adolescents. Differences were not statistically significant.
High-caloric snack consumption
Both Dutch and Non-Western boys reported to consume on average 0.43 portions of savoury snacks and approxi-mately 1.0 portions of sweet snacks per day. Non-Western girls reported to consume significantly more savoury snacks (.57 portions per day) than Dutch girls (.43 por-tions per day) (p = .005). Consumption of sweet snacks was higher among Dutch girls (1.00 portions per day ver-sus .86 portions per day; p = .094).
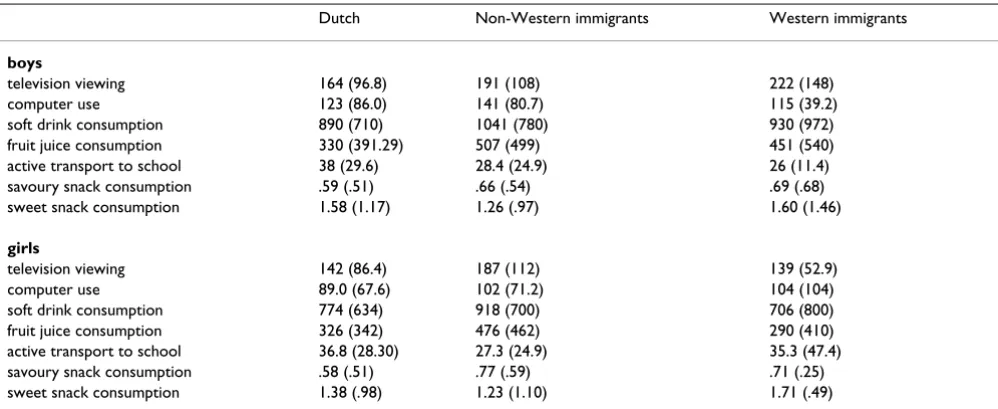
Exclusion of Western immigrants from the analyses
Comparing energy balance-related behaviours of Dutch adolescents with Non-Western and Western immigrants showed no consistent pattern, i.e. Western immigrants resemble Dutch adolescents in some behaviours, in other behaviours they resemble Non-Western adolescents, and in some behaviours none of these two groups (table 4).
Table 1: Demographic and anthropometric variables in Dutch and Non-Western adolescents
boys girls
Characteristics Dutch
(n = 410)
Non-Western (n = 64)
P Valuea Dutch
(n = 426)
Non-Western (n = 57)
P Value*
age, y 12.7 (.4) 13.0 (.7) .039 12.6 (.5) 12.8 (.5) .054
height, cm 159.3 (8.2) 157.9 (8.1) .163 158.3 (7.3) 156.1 (7.7) .182
weight, kg 47.0 (9.9) 49.9 (9.6) .169 47.8 (9.5) 51.2 (12.0) .066
BMI, kg/m2 18.4 (2.8) 19.9 (3.0) .000 19.0 (3.0) 20.9 (3.9) .003
overweight, No. (%)† obese, No. (%)b
56 (13.7) 5 (1.2)
13 (20.3) 4 (6.3)
.007 64 (15.0)
11 (2.6)
14 (24.6) 6 (10.5)
.001
Data are presented as mean (SD) unless stated otherwise
* comparing Dutch and Non-Westerners, using the Kolmogorov Smirnov Test (all variables, except for %overweight/%obese), and the Pearson Chi-square (%overweight/% obese)
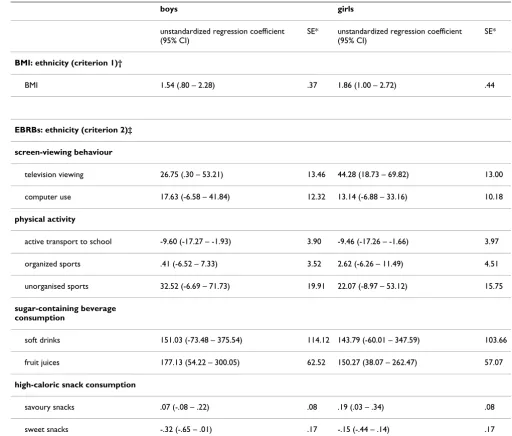
Mediation analysis: relationship between ethnicity and BMI mediated by energy balance-related behaviours (EBRBs)
Ethnicity was significantly associated with BMI, indicating that Non-Western boys and girls were more likely to have a higher BMI than Dutch adolescents (table 5, criterion 1). Non-Western boys and girls reported to watch more tele-vision, consume more fruit juices and savoury snacks (girls only), and spend less minutes on active commuting to school when compared to Dutch adolescents (table 5, criterion 2).
Results of multiple regression models adjusted for EBRBs as well as the Sobel Test (table 6, criteria 3 and 4) showed that in boys the association between BMI and ethnicity was significantly mediated by television viewing, active transport to school, and consumption of fruit juices (fig-ure 3). In girls, the association between BMI and ethnicity was significantly mediated by television viewing, active transport to school, consumption of fruit juices, and con-sumption of savoury snacks (figure 3). Adding all EBRBs that met all four criteria resulted in a significant decrease
of the regression coefficient, both in boys and girls (figure 3).
Discussion
To our best knowledge, this is the first study exploring whether ethnic differences in objectively measured BMI can be explained by energy balance-related behaviours, taking into account both sides of the energy balance, using mediation analysis.
Our results show that Non-Western adolescents were more likely to have a higher BMI than Dutch adolescents, confirming results of other studies among European chil-dren and adolescents [4,14,30-32]. Furthermore, we examined whether ethnic differences in energy balance-related behaviours partially explained the relationship between ethnicity and BMI and found that behaviours related to energy expenditure (television viewing and active transport behaviour) and energy intake (consump-tion of fruit juices and consump(consump-tion of savoury snacks in girls) partly explained the ethnic disparities in BMI.
Table 2: Energy balance-related behaviours (EBRBs) in Dutch and Non-Western boys
Dutch Non-Western
EBRBs n mean (std) median
(25th – 75th percentile)
mean (std) median
(25th – 75th percentile)
P Value*
Screen-viewing behaviour, min/day
television viewing 451 164 (96.8) 141 (94.3 – 212) 191 (108) 180 (86.8 – 267) .074
computer use 433 123 (86.0) 98 (60.0 – 178) 141 (80.7) 129 (77.1 – 30.0) .275
Physical activity, min/day
active transport to school 469 38.0 (29.6) 30.0 (14.0 – 60.0) 28.42 (24.9) 30.0 (10.0 – 30.0) .006
organized sports 322 33.8 (19.6) 32.1 (18.6 – 42.9) 34.2 (20.3) 28.6 (21.4 – 49.3) .275
unorganized sports 245 93.3 (111) 51.4 (25.7 – 111) 126 (1434) 164 (32.1 – 159) .912
Consumption of sugar-containing drinks, ml/day
soft drinks 375 890 (710) 685 (347 – 1251) 1041 (780) 918 (153 – 1438) .331
fruit juices 392 330 (391) 171 (28.6 – 468) 507 (499) 386 (10.2 – 788) .025
High-caloric snack consumption, portions/day
savoury snacks 415 .59 (.51) .43 (.29 – .86) .66 (.54) .43 (0.29 – 1.00) .660
sweet snacks 427 1.58 (1.17) 1.00 (.71 – 2.00) 1.26 (.97) .93 (.54 – 2.00) .141
Table 3: Energy balance-related behaviours (EBRBs) in Dutch and Non-Western girls
Dutch Non-Western
EBRBs n mean (std) median
(25th – 75th percentile)
mean (std) median
(25th – 75th percentile)
P Value*
Screen-viewing behaviour, min/day
television viewing 461 142 (86.4) 120 (77.1 – 180) 1867 (112) 161 (93.8 – 272) .033
computer use 429 89 (67.6) 68.6 (34.29 – 120) 102 (71.2) 81.4 (60.0 – 137) .529
Physical activity, min/day
active transport to school 480 36.8 (28.3) 30.0 (18.0 – 60.0) 27.3 (24.9) 20.0 (10.0 – 30.0) 480
organized sports 305 23.5 (16.4) 19.3 (10.7 – 30.0) 26.1 (18.6) 18.2 (11.8 – 37.5) 305
unorganized sports 204 53.4 (75.6) 34.3 (17.1 – 51.4) 75.4 (93.6) 34.3 (17.1 – 90.0) 204
Consumption of sugar-containing drinks, ml/day
soft drinks 395 774 (634) 657 (281 – 1142) 918 (700) 714 (439 – 1189) 395
fruit juices 396 326 (342) 200 (57.1 – 486) 476 (462) 323 (108 – 641) 396
High-caloric snack consumption, portions/day
savoury snacks 453 .58 (.51) .43 (.14 – 86) .77 (.59) .57 (.29 – 1.00) .044
sweet snacks 464 1.38 (.98) 1.00 (.57 – 2.00) 1.23 (1.10) .86 (.43 – 2.00) .094
*comparing Dutch and Non-Western adolescents, using the Mann-Whitney Test
Table 4: Differences between Dutch, Non-Western immigrants, and Western immigrants with regard to energy balance-related behaviours. Data are presented as mean (SD)
Dutch Non-Western immigrants Western immigrants
boys
television viewing 164 (96.8) 191 (108) 222 (148)
computer use 123 (86.0) 141 (80.7) 115 (39.2)
soft drink consumption 890 (710) 1041 (780) 930 (972)
fruit juice consumption 330 (391.29) 507 (499) 451 (540)
active transport to school 38 (29.6) 28.4 (24.9) 26 (11.4)
savoury snack consumption .59 (.51) .66 (.54) .69 (.68)
sweet snack consumption 1.58 (1.17) 1.26 (.97) 1.60 (1.46)
girls
television viewing 142 (86.4) 187 (112) 139 (52.9)
computer use 89.0 (67.6) 102 (71.2) 104 (104)
soft drink consumption 774 (634) 918 (700) 706 (800)
fruit juice consumption 326 (342) 476 (462) 290 (410)
active transport to school 36.8 (28.30) 27.3 (24.9) 35.3 (47.4)
savoury snack consumption .58 (.51) .77 (.59) .71 (.25)
Our results suggest that differences in BMI between Dutch and Non-Western adolescents can partly be attributed to the larger amount of time Non-Western adolescents spend on television viewing. Our findings are consistent with previous cross-sectional studies, suggesting that time spent on television viewing is associated with a less favourable body composition [33,34] and higher preva-lence rates of obesity [35] in youth. Several longitudinal data provide evidence that time spent on television view-ing predicts overweight and/or obesity in adulthood and television viewing during childhood and adolescence pre-cedes overweight and/or obesity in adulthood [36,37].
Andersen et al. [34] reported that Non-Hispanic black boys and girls had the highest rates of excessive television viewing (≥ 4 hours per day), but did not assess mediation effects of television viewing on the association between ethnicity and body composition. Previous evidence, derived from a sample of German children (aged 5–6 years), also indicates that television viewing is as an important determinant of ethnic differences in BMI [31].
Furthermore, our study findings indicate that differences with regard to commuting actively to school between Dutch and Non-Western adolescents partly explain the
Table 5: Results of testing the mediational model: energy balance-related behaviours (EBRBs) as mediators of the relationship between ethnicity and BMI (criteria 1 and 2)
boys girls
unstandardized regression coefficient (95% CI)
SE* unstandardized regression coefficient (95% CI)
SE*
BMI: ethnicity (criterion 1)†
BMI 1.54 (.80 – 2.28) .37 1.86 (1.00 – 2.72) .44
EBRBs: ethnicity (criterion 2)‡
screen-viewing behaviour
television viewing 26.75 (.30 – 53.21) 13.46 44.28 (18.73 – 69.82) 13.00
computer use 17.63 (-6.58 – 41.84) 12.32 13.14 (-6.88 – 33.16) 10.18
physical activity
active transport to school -9.60 (-17.27 – -1.93) 3.90 -9.46 (-17.26 – -1.66) 3.97
organized sports .41 (-6.52 – 7.33) 3.52 2.62 (-6.26 – 11.49) 4.51
unorganised sports 32.52 (-6.69 – 71.73) 19.91 22.07 (-8.97 – 53.12) 15.75
sugar-containing beverage consumption
soft drinks 151.03 (-73.48 – 375.54) 114.12 143.79 (-60.01 – 347.59) 103.66
fruit juices 177.13 (54.22 – 300.05) 62.52 150.27 (38.07 – 262.47) 57.07
high-caloric snack consumption
savoury snacks .07 (-.08 – .22) .08 .19 (.03 – .34) .08
sweet snacks -.32 (-.65 – .01) .17 -.15 (-.44 – .14) .17
*SE = standard error
ethnic differences with regard to BMI in our study sample. Although the average difference per day was small (i.e. 9– 10 minutes), such a small difference can have a significant impact on body composition over longer periods of time [38].
Declines in active commuting to school (i.e. the decrease in number of children actively commuting to school and the average distance travelled by bicycle and walking) and increases in overweight have both occurred at the same time [16,39]. In line with our findings, results of a cross-sectional study among Dutch adolescents show that stu-dents who used their bicycle for transportation were more likely to be native Dutch [40]. However, there is still lack of experimental evidence to prove the causal link between declines of physical activity levels and the increasing prev-alence of overweight, and a recent longitudinal study report suggests that excessive time spent in sedentary behaviour may be more important than (medium and high intensity) physical activity [37].
Fruit juice consumption partly explained the ethnic differ-ences in BMI in boys. This is in line with two recent stud-ies that found sweetened fruit juices to be dose-response associated with a higher risk of weight gain in adults [41] and overweight and obesity in schoolchildren [42]. In girls fruit juice consumption led to a significant increase of the regression coefficient (suppression). Since
Non-Western girls reported to consume significantly more fruit juice than Dutch girls, we would have expected that adjusting the crude model for consumption of fruit juices would lead to a decrease of the regression coefficient. This finding may reflect ethnic differences with regard to the rationale behind fruit juice consumption. In Non-Western girls, unlike Dutch girls, consumption of fruit juices may indicate an overall healthier diet [43].
Our findings suggest that differences in BMI between Dutch and Non-Western girls can partly be attributed to the higher consumption of savoury snacks of Non-West-ern girls. Reviewing the literature [44] there is no clear association between energy intake or food composition and body composition in adolescents. However, in com-bination with high levels of TV viewing, a relationship between snacking and body composition was found [45]. Additional analyses revealed also a positive significant association between television viewing and consumption of savoury snacks among girls of our study sample (Pear-son's r = .23, p = .000).
We were not able to fully explain ethnic differences in BMI by all energy balance-related behaviours. The unexplained remaining difference may be contributed to the interac-tion of biological and social factors with an environment that includes few opportunities for being physically active and an overabundance of other high-caloric foods or bev-erages [46].
Strength and limitations
A major strength of the present study is that we were able to analyze data of a relatively large study sample, with an equal gender distribution and a representative sub sample of Non-Western adolescents. Since misreporting of weight is very common, especially among overweight and obese adolescents [47-49], the quality and consistency of our anthropometric data collection is also a strong element of our study. Another strength is that we have considered a large set of behaviours that have widely been associated with overweight and obesity in children and adolescents.
Some limitations of this study are worth noting when interpreting our results. Since we analyzed cross-sectional data, cause-effect relationships between energy balance-related behaviours and BMI cannot be assumed. Rand-omized controlled trials are needed to gain more insight in the nature of these relationships. Besides, the assess-ment of behavioural variables was based on self-report, a common drawback that we share with many other studies in the field. We adapted validated questionnaires to our study population and specific energy balance-related behaviours, but did not support assessment by any objec-tive measurement. Objecobjec-tive behavioural measures how-ever often are not feasible in large epidemiological Model depicting the associations between ethnicity
(inde-pendent variable) and BMI (outcome variable), mediated by energy balance-related behaviours (mediator variables)
Figure 3
Model depicting the associations between ethnicity (independent variable) and BMI (outcome variable), mediated by energy balance-related behaviours (mediator variables). Correlation coefficients are pre-sented in parentheses for boys and girls, respectively
television viewing: 1.45/1.55
BMI active transport:
1.49/1.75
ethnicity 1.54/1.86
fruit juice: 1.29/2.22
studies. In consequence, we are not able to quantify the amount of over-reporting or under-reporting. When inter-preting our results one must bear in mind that especially overweight adolescents are likely to underreport energy intake and overreport physical activity [16,50].
Our study provides useful insights into the prevalence rates of overweight and obesity in Dutch and Non-West-ern adolescents and underlying behavioural determinants that may partly be responsible for ethnic disparities in BMI. Our findings indicate that behaviours related to both energy expenditure and energy intake may contribute to the ethnic differences in body composition that we found in our study population. Taking into account differences in energy balance-related behaviours in ethnic subpopula-tions help to improve targeted or tailored intervensubpopula-tions for preventing overweight in adolescents. Therefore,
inter-ventions aimed at Non-Western subgroups should specif-ically focus on promoting active transport and discouraging television viewing.
Competing interests
The authors declare that they have no competing interests.
Authors' contributions
AS, MC, JB, SK, TV, and WvM provided support in the design of the study and contributed intellectual input into the main ideas of this paper. AS designed and coordinated the implementation of the intervention. She supervised data-collection, analysed data, and drafted the manu-script. All authors contributed to the further writing of the manuscript. MC, JB, and WvM obtained financial support. AS will act as guarantor of the paper.
Table 6: Results of testing the mediational model: energy balance-related behaviours (EBRBs) as mediators of the relationship between ethnicity and BMI (criteria 3 and 4)
unstandardized regression coefficient (95% CI) % mediation SE* Sobel z-value
P value (Sobel)
boys
BMI: ethnicity and EBRBs (criteria 3 and 4)†
television viewing 1.45 (.69 – 2.21) 5.8 .39 2.73 .006
active transport to school 1.49 (.75 – 2.23) 3.3 .38 2.81 .005
fruit juices consumption 1.29 (.43 – 2.16) 16.2 .44 2.35 .02
savoury snacks consumption NA NA NA NA NA
BMI: ethnicity and all EBRBs‡ 1. 16 (.28 – 2.05) 24.7 .45 2.15 .03
girls
BMI: ethnicity and EBRBs (criteria 3 and 4)†
Television viewing 1.55 (.68 – 2.42) 16.7 .44 2.66 .008
active transport to school 1.75 (.87 – 2.62) 5.9 .44 2.86 .004
fruit juices consumption 2.22 (1.23 – 3.21) S .50 3.02 .003
savoury snacks consumption 1.75 (.89 – 2.61) 5.9 .44 2.86 .004
BMI: ethnicity and all EBRBs‡ 1.39 (.42 – 2.37) 25.3 .50 2.28 .02
*SE = standard error
†regression model with BMI as the criterion variable and EBRBs and ethnicity as predictor variables
‡regression model with BMI as the criterion variable and television viewing, active transport to school, fruit juices, and savoury snacks (girls only) NA = not applicable
Appendix 1
Questionnaire used to examine energy balance-related behaviour.
1. Questions on screen-viewing behaviour
How many days a week do you watch television/use the computer? Think about last week when answering the question. [Answering categories: none, 1, 2, 3, 4, 5, 6, every day]
How long on average did you watch television/use the computer on a usual (school/weekend)day? Think about a usual school day in the last week when answering the question. [Answering categories: open answer (hours and minutes/day)]
2. Questions on physical activity – active transport to school
How many days did you go to school by bicycle/on foot last week? [Answering categories: none, 1 day, 2 days, 3 days, 4 days, 5 days]
How many minutes does it usually take for you to bike/ walk to school? Think about a usual school day in the last week when answering the question. [Answering catego-ries: open answer (hours and minutes)]
3. Questions on consumption of sugar-containing beverages
How many days did you drink soft drinks/fruit juices last week? [Answering categories: none, 1, 2, 3, 4, 5, 6, every day]
On days that you drank soft drinks/fruit juices, how many glasses/bottles/cans did you drink (weekday/weekend day)? [Answering categories: open answers (glasses/day, bottles/day, cans/day)]
4. Questions on consumption of high-caloric snacks
How many days did you eat savoury snacks/sweets last week? [Answering categories: none, 1, 2, 3, 4, 5, 6, every day]
When you eat savoury snacks/sweets, how many portions do you usually eat? Think about last week when answer-ing the question. [Answeranswer-ing categories: open answers (portions/day)]
Acknowledgements
This study is part of NHF-NRG and is funded by the Netherlands Heart Foundation (No: 2000Z003), the Dutch Ministry of Health, Welfare, and Sports, and the Royal Association of Teachers of Physical Education. None of the funders had input into protocol development, data collection, or analyses or interpretation.
References
1. World Health Organization: Diet, nutrition, and prevention of chronic diseases, Joint WHO/FAO Expert Consultation, Geneva, 28 Jan – 1 Feb 2002. WHO technical report series 916. Geneva, Switzerland 2003.
2. Dietz WH: Critical periods in childhood for the development of obesity. Am J Clin Nutr 1994, 59:955-959.
3. Kumanyika S, Grier S: Targeting interventions for ethnic minor-ity and low-income populations. Future Child 2006, 16:187-207. 4. Fredriks AM, van Buuren S, Hirasing RA, Wit JM, Verloove-Vanhorick SP: Alarming prevalences of overweight and obesity for chil-dren of Turkish, Moroccan and Dutch origin in The Nether-lands according to international standards. Acta Paediatr 2005,
94:496-498.
5. Lobstein T, Baur L, Uauy R: Obesity in children and young peo-ple: a crisis in public health. Obes Rev 2004, 5(Suppl 1):4-85. 6. Must A, Spadano J, Coakley EH, Field AE, Colditz G, Dietz WH: The
disease burden associated with overweight and obesity. JAMA
1999, 282:1523-1529.
7. Kirk S, Scott BJ, Daniels SR: Pediatric obesity epidemic: treat-ment options. J Am Diet Assoc 2005, 105:S44-S51.
8. Leger LS, Nutbeam D: Research into health promoting schools.
J Sch Health 2000, 70:257-259.
9. Kuczmarski RJ, Flegal KM, Campbell SM, Johnson CL: Increasing prevalence of overweight among US adults. The National Health and Nutrition Examination Surveys, 1960 to 1991.
JAMA 1994, 272:205-211.
10. Brussaard JH, Erp-Baart MA, Brants HA, Hulshof KF, Lowik MR:
Nutrition and health among migrants in The Netherlands.
Public Health Nutr 2001, 4:659-664.
11. Ogden CL, Flegal KM, Carroll MD, Johnson CL: Prevalence and trends in overweight among US children and adolescents, 1999–2000. JAMA 2002, 288:1728-1732.
12. Whitaker RC, Orzol SM: Obesity among US urban preschool children: relationships to race, ethnicity, and socioeconomic status. Arch Pediatr Adolesc Med 2006, 160:578-584.
13. Gordon-Larsen P, Adair LS, Popkin BM: Ethnic differences in physical activity and inactivity patterns and overweight sta-tus. Obes Res 2002, 10:141-149.
14. Wardle J, Brodersen NH, Cole TJ, Jarvis MJ, Boniface DR: Develop-ment of adiposity in adolescence: five year longitudinal study of an ethnically and socioeconomically diverse sample of young people in Britain. BMJ 2006, 332:1130-1135.
15. Wong MD, Shapiro MF, Boscardin WJ, Ettner SL: Contribution of major diseases to disparities in mortality. N Engl J Med 2002,
347:1585-1592.
16. Rennie KL, Johnson L, Jebb SA: Behavioural determinants of obesity. Best Pract Res Clin Endocrinol Metab 2005, 19:343-358. 17. Goodman E: The role of socioeconomic status gradients in
explaining differences in US adolescents' health. Am J Public Health 1999, 89:1522-1528.
18. Singh AS, Chin A, Paw JM, Kremers SP, Visscher TL, Brug J, Van Mechelen W: Design of the Dutch Obesity Intervention in Teenagers (NRG-DOiT): Systematic development, imple-mentation and evaluation of a school-based intervention aimed at the prevention of excessive weight gain in adoles-cents. BMC Public Health 2006, 6:304.
19. Cole TJ, Bellizzi MC, Flegal KM, Dietz WH: Establishing a standard definition for child overweight and obesity worldwide: inter-national survey. BMJ 2000, 320:1240-1243.
20. Statistics Netherlands: Standaarddefinitie allochtonen. In Hoe doet het CBS dat nou? Voorburg, The Netherlands; 2000:24-25. 21. van Assema P, Brug J, Ronda G, Steenhuis I, Oenema A: A short
dutch questionnaire to measure fruit and vegetable intake: relative validity among adults and adolescents. Nutr Health
2002, 16:85-106.
22. van Assema P, Brug J, Ronda G, Steenhuis I: The relative validity of a short Dutch questionnaire as a means to categorize adults and adolescents to total and saturated fat intake. J Hum Nutr Diet 2001, 14:377-390.
23. Robinson TN: Television viewing and childhood obesity. Pediatr Clin North Am 2001, 48:1017-1025.
Publish with BioMed Central and every scientist can read your work free of charge "BioMed Central will be the most significant development for disseminating the results of biomedical researc h in our lifetime."
Sir Paul Nurse, Cancer Research UK
Your research papers will be:
available free of charge to the entire biomedical community
peer reviewed and published immediately upon acceptance
cited in PubMed and archived on PubMed Central
yours — you keep the copyright
Submit your manuscript here:
http://www.biomedcentral.com/info/publishing_adv.asp
BioMedcentral 25. van der Horst K, Kremers S, Ferreira I, Singh A, Oenema A, Brug J:
Perceived parenting style and practices and the consump-tion of sugar-sweetened beverages by adolescents. Health Educ Res 2007, 22:295-304.
26. Baron RM, Kenny DA: The moderator-mediator variable dis-tinction in social psychological research: conceptual, strate-gic, and statistical considerations. J Pers Soc Psychol 1986,
51:1173-1182.
27. Holmbeck GN: Toward terminological, conceptual, and statis-tical clarity in the study of mediators and moderators: exam-ples from the child-clinical and pediatric psychology literatures. J Consult Clin Psychol 1997, 65:599-610.
28. MacKinnon DP, Lockwood CM, Hoffman JM, West SG, Sheets V: A comparison of methods to test mediation and other inter-vening variable effects. Psychol Methods 2002, 7:83-104. 29. MacKinnon DP, Krull JL, Lockwood CM: Equivalence of the
Medi-ation, Confounding and Suppression Effect. Preventive Science
2000, 1:173-182.
30. Saxena S, Ambler G, Cole TJ, Majeed A: Ethnic group differences in overweight and obese children and young people in Eng-land: cross sectional survey. Arch Dis Child 2004, 89:30-36. 31. Kuepper-Nybelen J, Lamerz A, Bruning N, Hebebrand J,
Herpertz-Dahlmann B, Brenner H: Major differences in prevalence of overweight according to nationality in preschool children liv-ing in Germany: determinants and public health implica-tions. Arch Dis Child 2005, 90:359-363.
32. Kumar BN, Holmboe-Ottesen G, Lien N, Wandel M: Ethnic differ-ences in body mass index and associated factors of adoles-cents from minorities in Oslo, Norway: a cross-sectional study. Public Health Nutr 2004, 7:999-1008.
33. Klein-Platat C, Oujaa M, Wagner A, Haan MC, Arveiler D, Schlienger JL, Simon C: Physical activity is inversely related to waist cir-cumference in 12-y-old French adolescents. Int J Obes Relat Metab Disord 2005, 29:9-14.
34. Andersen RE, Crespo CJ, Bartlett SJ, Cheskin LJ, Pratt M: Relation-ship of physical activity and television watching with body weight and level of fatness among children: results from the Third National Health and Nutrition Examination Survey.
JAMA 1998, 279:938-942.
35. Crespo CJ, Smit E, Troiano RP, Bartlett SJ, Macera CA, Andersen RE:
Television watching, energy intake, and obesity in US chil-dren: results from the third National Health and Nutrition Examination Survey, 1988–1994. Arch Pediatr Adolesc Med 2001,
155:360-365.
36. Hancox RJ, Milne BJ, Poulton R: Association between child and adolescent television viewing and adult health: a longitudinal birth cohort study. Lancet 2004, 364:257-262.
37. Boone JE, Gordon-Larsen P, Adair LS, Popkin BM: Screen time and physical activity during adolescence: longitudinal effects on obesity in young adulthood. Int J Behav Nutr Phys Act 2007, 4:26. 38. Seidell JC: The current epidemic of obesity. In Physical Activity and Obesity Edited by: Bouchard C. Champaign, Illinois: Human Kinetics; 2000.
39. Salmon J, Timperio A, Cleland V, Venn A: Trends in children's physical activity and weight status in high and low socio-eco-nomic status areas of Melbourne, Victoria, 1985–2001. Aust N Z J Public Health 2005, 29:337-342.
40. De Bruijn GJ, Kremers SP, Schaalma H, Van Mechelen W, Brug J:
Determinants of adolescent bicycle use for transportation and snacking behavior. Prev Med 2005, 40:658-667.
41. Bes-Rastrollo M, Sanchez-Villegas A, Gomez-Gracia E, Martinez JA, Pajares RM, Martinez-Gonzalez MA: Predictors of weight gain in a Mediterranean cohort: the Seguimiento Universidad de Navarra Study. Am J Clin Nutr 2006, 83:362-370.
42. Sanigorski AM, Bell AC, Swinburn BA: Association of key foods and beverages with obesity in Australian schoolchildren. Pub-lic Health Nutr 2007, 10:152-157.
43. Wardle J, Haase AM, Steptoe A, Nillapun M, Jonwutiwes K, Bellisle F:
Gender differences in food choice: the contribution of health beliefs and dieting. Ann Behav Med 2004, 27:107-116.
44. Rodriguez G, Moreno LA: Is dietary intake able to explain differ-ences in body fatness in children and adolescents? Nutr Metab Cardiovasc Dis 2006, 16:294-301.
45. Francis LA, Lee Y, Birch LL: Parental weight status and girls' tel-evision viewing, snacking, and body mass indexes. Obes Res
2003, 11:143-151.
46. French SA, Story M, Jeffery RW: Environmental influences on eating and physical activity. Annu Rev Public Health 2001,
22:309-335.
47. Jansen W, Looij-Jansen PM van de, Ferreira I, de Wilde EJ, Brug J: Dif-ferences in measured and self-reported height and weight in Dutch adolescents. Ann Nutr Metab 2006, 50:339-346.
48. Elgar FJ, Roberts C, Tudor-Smith C, Moore L: Validity of self-reported height and weight and predictors of bias in adoles-cents. J Adolesc Health 2005, 37:371-375.
49. Morrissey SL, Whetstone LM, Cummings DM, Owen LJ: Compari-son of self-reported and measured height and weight in eighth-grade students. J Sch Health 2006, 76:512-515.