R E V I E W
Open Access
Physical activity equivalent labeling vs.
calorie labeling: a systematic review and
meta-analysis
Shirin Seyedhamzeh
1,2,7*, Minoo Bagheri
3, Abbas Ali Keshtkar
4, Mostafa Qorbani
5and Anthony J. Viera
6Abstract
Background:Many countries are trying to identify strategies to control obesity. Nutrition labeling is a policy that could lead to healthy food choices by providing information to consumers. Calorie labeling, for example, could lead to consumers choosing lower calorie foods. However, its effectiveness has been limited. Recently, physical activity equivalent labeling (i.e., displaying calories in terms of estimated amount of physical activity to burn calories) has been proposed as an alternative to the calorie-only label. The aim of this review was to identify and evaluate the published literature comparing effects on health behavior between physical activity equivalent labeling and calorie-only labeling.
Method:We searched the following databases: Pubmed/medline, Scopus, Web of science, Agris, Cochrane library, Google Scholar. We also searched along with reference lists of included articles. Articles that were published between 1 January 2000 and 31 October 2016 were eligible for inclusion provided they reported on studies that examined the effects of both types of labeling and included at least one outcome of interest. Mean and standard deviations of the included results were combined using a fixed-effect model. The difference in calories purchased between people exposed to physical activity labeling and calorie-only labeling was calculated as weighted mean difference by using a fixed-effect model.
Result:The difference of calories ordered between physical activity label and calorie label groups was not statistically significant (SMD: -0.03; 95% CI: -0.13, 0.07). The difference of calories ordered between physical activity label and calorie label according to real vs unreal (e.g. web-based) condition was 65 Kcal fewer in real-world settings.
Conclusion:Physical activity calorie equivalent labeling in minutes does not significantly reduce calories ordered compared to calorie-only labeling.
Keywords:Physical activity equivalent labeling, Food labeling, Calorie labeling, Meta-analysis
Background
Obesity is recognized as a significant threat to health. The increasing incidence of obesity, beyond imposing substantial costs, has been a source of concern for policy makers in health programs. Key factors in the develop-ment of obesity are unhealthy diets and low levels of physical activity. Raising awareness of the influence of
diet and physical activity on weight can be an effective strategy to combat obesity [1,2].
Recent studies have suggested that caloric restriction by 30% could reduce the incidence of type 2 diabetes, cardiovascular disease and cancer [3–5]. The Compre-hensive Assessment of the Long-term Effects of Redu-cing Intake of Energy (CALERIE) research program investigated the effects of 25% energy restriction in people without obesity for 2 years. The results of this study showed reductions in body weight by 11.5%, in fat free mass by 4.3%, and in fat mass by 23% at month 12 [6,7]. Calorie restriction and exercise not only con-tributed to weight loss but they also had a significant * Correspondence:[email protected]
1Food and Nutrition Policy, Department of Community Nutrition, School of
Nutritional sciences and Dietetics, Tehran University of Medical Sciences, Tehran, Iran
2Students’Scientific Research Center, Tehran University of Medical Sciences, Tehran, Iran
Full list of author information is available at the end of the article
Many developed countries are trying to identify strategies to reduce the burden of overweight and obesity [8, 9]. One such strategy is providing labeling
and consumer information [10], although studies at
the population level have shown inconsistent results on the effects of nutrition labeling [11]. Calorie label-ing on menus might help combat obesity and
over-weight by influencing consumers’food purchasing and
eating behaviors. Although calorie labeling has been found to have limited effectiveness on changing
behav-iors [12], consumers appear to want calorie menu
la-beling [13–15]. Physical activity calorie equivalent labeling is a type of nutrition labeling that might have more influential effects on food choice than other label formats [16]. By using a label that provides the amount of physical activity represented by the calories in a food item, people could more easily balance their diet with their physical activity level [17]. Symbols are more understandable than numerical information and peo-ple’s behavior might be affected by them [18], so inves-tigators are trying to find whether there is any relationship between this new kind of label and food choices. Evidence appears mixed as to whether this kind of labeling leads to changes in consumer’s behav-iors [19–25].
Since no published meta-analysis has assessed the ef-fectiveness of physical activity equivalent labeling and calorie labeling and previous individual studies in real and unreal settings showed controversial results, we sys-tematically reviewed the published literature comparing the difference of effects on health behavior between physical activity equivalent labeling and calorie-only la-beling. To our knowledge there is no meta-analysis on this topic.
Methods
Study selection
Based on our primary search there were few studies which compared calorie labeling and physical activity equivalent labeling.
Inclusion criteria
We included studies that compared calorie labeling and physical activity labeling, with either population or non-population based data without any restriction on race, education and socioeconomic status, types of food. We included studies in various settings including restau-rants and schools. Other criteria used for study selection were study population aged > 18 years and inclusion of an intervention of physical activity label using either mile or in minutes.
mentaries, letters, or conference proceedings.
Interventions and outcomes of interest
Outcomes of interest were calories purchased. The PICOS (population, intervention, comparator, outcome, setting) criteria used to perform the systematic review are outlined in Additional file1: Table S1.
Calorie label as interested interventions was defined as labels that show the amount of calorie in foods and mi-nutes or miles need to burn the calories of food ordered, respectively.
The effect of calorie labeling and physical activity la-beling was examined on calories ordered. Calorie order-ing as outcome of interest was defined as the amount of calorie of the foods that customers order after consider-ing menu in the restaurants.
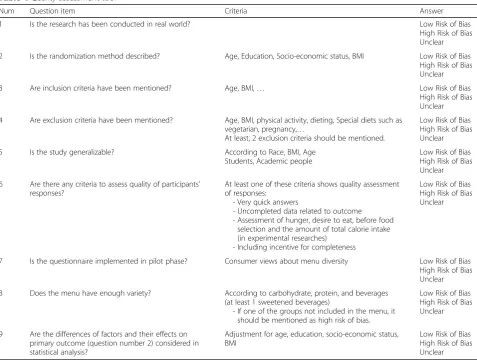
Quality assessment
We considered assessing the quality of the included
studies by using the Cochrane assessment tool [26].
However, considering that many of the studies were con-ducted using hypothetical scenarios or non-real-world settings existing quality tools might not yield a proper assessment of the studies. Therefore, a quality assess-ment tool was designed one of the authors (AAK). Qual-ity was scored based on setting (real, unreal design), randomization, mentioning inclusion and exclusion cri-teria, generalization, quality of participants’ responses, implementing pilot phase, enough variety of menu, assessing physical activity after intervention, and asses-sing factors and their effects on the primary outcome. Then, first and second authors classified studies into three categories: high risk of bias, low risk of bias and unclear (Appendix 1).
Search strategy
We searched the following databases: Pubmed/medline, Scopus, Web of science, Agris, Cochrane library, Google Scholar. We also searched reference lists of included arti-cles. Articles that were published between 1 January 2000 and 31 October 2016 were included. We searched Google Scholar and Agris to find grey literature. Key words were obtained from Mesh, Emtree or extracted from related ar-ticles. Keywords which were obtained from Emtree or Mesh were included in our search strategy without any changes. Since our aim was to compare the effect of two different types of labeling (calorie labeling and physical ac-tivity equivalent labeling) on food choice, the study syntax was formed from two components. The first component referred to label (calorie and physical activity) including:
“eat label”,“nutrient label”,“nutrient content”,“food away from home”, “traffic light”, “PACE”, “motor activity”
“physical activity”,“locomotor activity”,“exercise”,“energy expenditure”,“walk”and the second component included
“caloric restriction”,“diet”,“low-calorie”,“low calorie diet”,
“energy intake”,“caloric intake restriction”,“calorie”,“ kilo-calorie”,“food energy”,“K-Cal”,“Kcal”,“meal low calorie”,
“meal low-calorie”, “food order”, “food consume”, “food consumption”,“food decision”,“diet selection”,“diet deci-sion”, “food desire”, “diet desire”, “food choose”, “diet choose”, “appetite regulation”, “feed intake”, “feeding methods”,“food ingestion”,“food intake regulation”,“food intake”,“food uptake”,“food Preference”,“selection Food”,
“food choice”,“behavior eating”,“nutrition behavior”. Our search strategy is shown inAppendix 2.
Studies were selected without language restriction, and non-English language publications were translated into English. First and second authors screened the title and abstract independently and the screened results were assessed. If there were any disagreements in data extraction, a decision was made by consensus. Full texts of included articles were identified. One author (SS) extracted data. The information extracted from the full-text of the included articles included: country, type of setting (school, restaurant or web based design), study design (experimental or quasi-experimental), par-ticipant characteristics (age, sex, BMI) and quantitative data needed for meta-analysis (samples size, means and standard deviations of calorie label groups and physical activity label groups).
The averages of differences in calories ordered (mean ± SD(between the two groups (calorie label and physical activity label) were extracted. Then the value of stan-dardized mean difference (SMD) using the means and standard deviations (SD) of two groups (calorie label and physical activity label) were calculated as follow:
Cohen’s d¼Mean1−Mean2=SDpooled
SDpooled¼√ ð Þs1 2þð Þs2 2
=2
Authors of studies with unclear information were con-tacted. If we did not receive a response after contacting the corresponding author for three times over 6 weeks, we excluded the study.
We followed the PRISMA checklist for this study [27] (Additional file2).
Statistical analysis
Data were analyzed using STATA 12 (StataCorp, College Station, TX, USA). To compare the effect of interventions we used Cohen’s d approach [28]. In this approach, Cohen’s d which is also known the standardized mean difference (SMD) was calculated using the following formula:
SMD¼Mean1−Mean2=Standard deviation pooled Standard deviation pooled¼√ ð ÞS1 2þð ÞS2 2
=2
In this formula Standard deviation pooled (SD) is a weighted average of standard deviations for two groups. The individual standard deviations are aver-aged, with more “weight” given to larger sample sizes. Meta-analysis was performed to estimate the pooled SMD of the effect of physical activity equivalent label-ing vs. calorie labellabel-ing on calories ordered. The Q Cochrane test and I2statistics were used to assess het-erogeneity between studies. The I2 statistics less than
25%, 25–50% and more than 50% were considered as
little, moderate and severe heterogeneity, respectively. A fixed effects met-analysis method was used to pool the estimated SMD. The forest plot was used to sche-matically present the pooled SMD and its 95% CI. To assess the source of heterogeneity, subgroup analyses (according to quality score, BMI, age, sex and study
setting) were manipulated. Publication bias was
assessed by Egger’s regression asymmetry test [29] and trims and fills method [30]. Also we used Egger’s test to assess the existence of unpublished data. The stud-ies that reported physical activity labeling in minutes and miles were separately analyzed. We also conducted another sensitivity analysis to assess the influence of the label types and the study quality. Statistical signifi-cance was considered atp< 0.05. This study was
regis-tered at http://www.crd.york.ac.uk/PROSPERO/ as
CRD42017051697.
Results
A total of 2068 article titles were identified by database searching. After removing duplicates, 1236 articles were screened based on the study inclusion criteria. Of 92 full-text article evaluated, 84 were excluded with the fol-lowing reasons: qualitative studies, review, letter and com-mentary (n = 15), studies with population aged less than 18 years (n = 26) and incompatibility with primary out-come (n= 43).Finally, 8 articles were eligible for inclusion. One of them conveyed physical activity in miles format [22]. Two studies used physical activity labels in mile and minute (min) formats [19,20], and the rest displayed the physical activity label in minutes [21,23–25,31]. Figure1 presents the flow chart of the study selection.
The settings of the studies varied. Two studies [21,23] were conducted in real world settings, and the rest [19, 20,22,24,25,31] were conducted in web based and hy-pothesis format (Table1).
Fig. 1Flow chart of the selection study
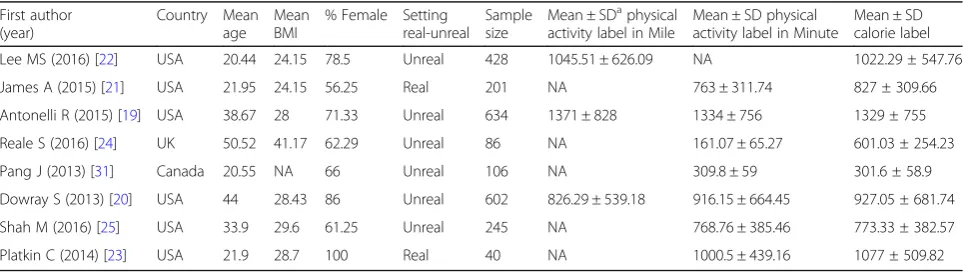
Table 1Characteristics of the included studies
First author (year)
Country Mean age
Mean BMI
% Female Setting real-unreal
Sample size
Mean ± SDaphysical activity label in Mile
Mean ± SD physical activity label in Minute
Mean ± SD calorie label
Lee MS (2016) [22] USA 20.44 24.15 78.5 Unreal 428 1045.51 ± 626.09 NA 1022.29 ± 547.76
James A (2015) [21] USA 21.95 24.15 56.25 Real 201 NA 763 ± 311.74 827 ± 309.66
Antonelli R (2015) [19] USA 38.67 28 71.33 Unreal 634 1371 ± 828 1334 ± 756 1329 ± 755
Reale S (2016) [24] UK 50.52 41.17 62.29 Unreal 86 NA 161.07 ± 65.27 601.03 ± 254.23
Pang J (2013) [31] Canada 20.55 NA 66 Unreal 106 NA 309.8 ± 59 301.6 ± 58.9
Dowray S (2013) [20] USA 44 28.43 86 Unreal 602 826.29 ± 539.18 916.15 ± 664.45 927.05 ± 681.74
Shah M (2016) [25] USA 33.9 29.6 61.25 Unreal 245 NA 768.76 ± 385.46 773.33 ± 382.57
Platkin C (2014) [23] USA 21.9 28.7 100 Real 40 NA 1000.5 ± 439.16 1077 ± 509.82
a
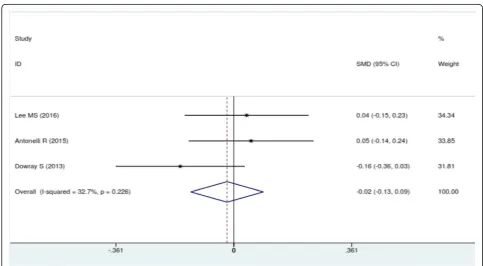
There was no difference in calories ordered among people shown physical activity labeling in miles vs calories only (SMD: -0.02; 95%CI: -0.13, 0.09) (Fig.3).
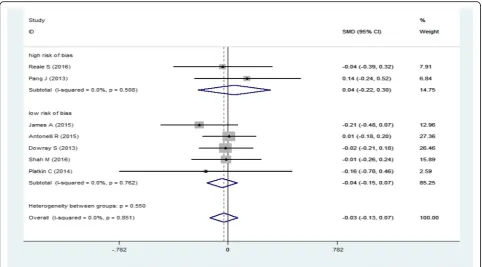
Subgroup analysis of calories ordered in physical activ-ity label and calorie label based on qualactiv-ity assessment is
shown in Fig.4. In studies with high risk of bias the cal-ories ordered were slightly increased (SMD: 0.04; 95%CI: -0.22, 0.30). However, in low risk of bias studies the amount of calories ordered was slightly decreased (SMD: -0.04; 95%CI: -0.15, 0.07).
Overall (I-squared = 0.0%, p = 0.851) Pang J (2013)
Platkin C (2014) Dowray S (2013) ID
Antonelli R (2015)
Reale S (2016)
Shah M (2016) James A (2015) Study
-0.03 (-0.13, 0.07) 0.14 (-0.24, 0.52)
-0.16 (-0.78, 0.46) -0.02 (-0.21, 0.18) SMD (95% CI)
0.01 (-0.18, 0.20)
-0.04 (-0.39, 0.32)
-0.01 (-0.26, 0.24) -0.21 (-0.48, 0.07)
100.00 6.84
2.59 26.46 Weight
27.36
7.91
15.89 12.96 %
-0.03 (-0.13, 0.07) 0.14 (-0.24, 0.52)
-0.16 (-0.78, 0.46) -0.02 (-0.21, 0.18) SMD (95% CI)
0.01 (-0.18, 0.20)
-0.04 (-0.39, 0.32)
-0.01 (-0.26, 0.24) -0.21 (-0.48, 0.07)
100.00 6.84
2.59 26.46 Weight
27.36
7.91
15.89 12.96 %
0
-.782 0 .782
Fig. 2Forest plot of mean difference in physical activity label (min) versus mean in calorie label. The pooled SMDs were calculated by using a fixed-effect model
Calories ordered was not associated with either un-real setting (SMD: - 0.003; 95%CI:-0.106, 0.111), or real-world setting (SMD: -0.198; 95%CI: -0.128, 0.071) (Fig. 5).
Subgroup analysis of calories ordered by quality, BMI, age, percentage of female, and setting of studies is shown in Table2.
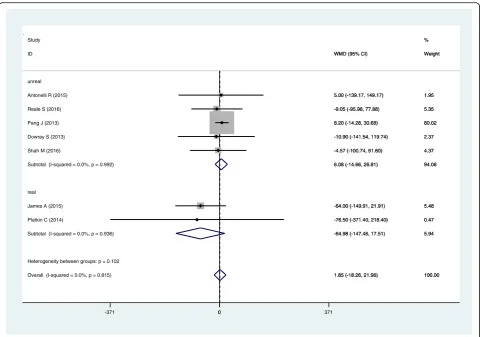
The effect of physical activity label on calorie reduc-tion is shown in Fig. 6. In real condition studies, the average reduction in calories ordered was 65 cal among people viewing physical activity labels.
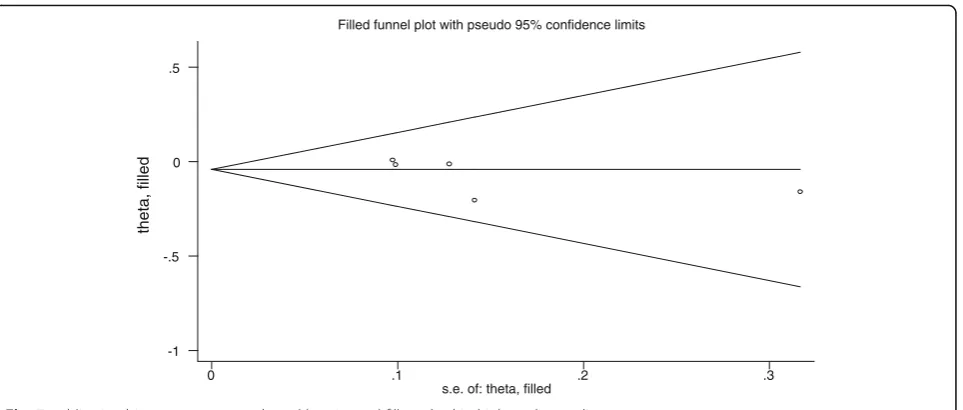
Publication bias and sensitivity analysis were evaluated based on quality assessment. Findings from the sensitiv-ity analysis in low risk of bias studies revealed that ex-cluding any single study did not alter the main findings (Table3).
On the same basis, no evidence of publication
bias was observed (P = 0.304 in Egger’s test, P =
0.762 in trim and fill method). The plot of trim
and fill method is shown in Fig. 7. Moreover,
Egger’s test showed that there was not any
unpub-lished data.
Discussion
The main finding of this systematic review is that using physical activity labeling (e.g., minutes of
walking to burn calories) contributes to a slight but non-significant reduction in amount of calories in food ordering. Subgroup analysis showed no dif-ferences in these results based on age, sex, or BMI. There also was no difference based on setting:, the
“real-world” studies appeared to reduce calories
or-dered by 65 cal, but this result was not statistically significant. To the best of our knowledge, this study is the first meta-analysis that compares the effects of calorie-only labeling with physical activity labeling.
It should be taken into account that studies in real world settings provided more precise and powerful findings than those in unreal settings. In one real set-ting study, the calories ordered in the physical activity label group were lower than that of in the calorie label group, yet the observed association failed to reach statistical insignificance. This finding, in the
study by Platkin et al. [23], was mainly observed in
overweight and obese females, although the sample size was low.
According to the results of the research by Shah et al. [25], there is no significant difference in calories ordered between people exposed to the physical activ-ity label (minutes) vs the calorie label groups in His-panic population, although the participants ordered fewer calories in the physical activity label group. The
result of this study is consistent with those of the studies by Viera et al. [19] and Dowray et al. [20].
However, in the study by Pang and Hammond [31],
the amount of calories ordered in the group of phys-ical activity label was non-significantly greater than that of in the calorie label group. The inconsistency in results was attributed to the differences in food choices and the format of the label used in studies. Particularly, in the latter study, snacks (muffins and donuts) were used with a relatively small variation and the amount of physical activity in each case was written in minutes.
The number of studies conveying physical activity
in miles was low, but in two studies [19, 25] the
average of calories ordered among people shown miles was higher than that of those in the calorie label group. In the hypothetical scenario study
conducted by Dowray et al. [20], people shown
physical activity labels in miles ordered fewer calories than those shown physical activity in mi-nutes, although the difference was not statistically significant.
A combination of many factors including education level, ethnicity, and socio-economic status influence
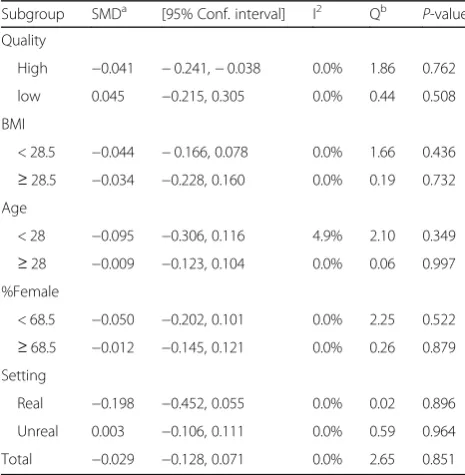
Table 2Subgroup analysis on mean of energy order by quality, BMI, age, percentage of female, and setting of studies
Subgroup SMDa [95% Conf. interval] I2 Qb P-value
Quality
High −0.041 −0.241,−0.038 0.0% 1.86 0.762
low 0.045 −0.215, 0.305 0.0% 0.44 0.508
BMI
< 28.5 −0.044 −0.166, 0.078 0.0% 1.66 0.436
≥28.5 −0.034 −0.228, 0.160 0.0% 0.19 0.732 Age
< 28 −0.095 −0.306, 0.116 4.9% 2.10 0.349
≥28 −0.009 −0.123, 0.104 0.0% 0.06 0.997 %Female
< 68.5 −0.050 −0.202, 0.101 0.0% 2.25 0.522
≥68.5 −0.012 −0.145, 0.121 0.0% 0.26 0.879 Setting
Real −0.198 −0.452, 0.055 0.0% 0.02 0.896
Unreal 0.003 −0.106, 0.111 0.0% 0.59 0.964
Total −0.029 −0.128, 0.071 0.0% 2.65 0.851
a
Standardized Mean Difference b
Heterogeneity Statistics
Heterogeneity between groups: p = 0.153
Overall (I-squared = 0.0%, p = 0.851) Subtotal (I-squared = 0.0%, p = 0.896) James A (2015)
Subtotal (I-squared = 0.0%, p = 0.964) Pang J (2013)
real Shah M (2016) unreal
Platkin C (2014) Reale S (2016) Antonelli R (2015) ID
Dowray S (2013) Study
-0.03 (-0.13, 0.07) -0.20 (-0.45, 0.05) -0.21 (-0.48, 0.07) 0.00 (-0.11, 0.11) 0.14 (-0.24, 0.52)
-0.01 (-0.26, 0.24)
-0.16 (-0.78, 0.46) -0.04 (-0.39, 0.32) 0.01 (-0.18, 0.20) SMD (95% CI)
-0.02 (-0.21, 0.18)
100.00 15.55 12.96 84.45 6.84
15.89
2.59 7.91 27.36 Weight
26.46 %
-0.03 (-0.13, 0.07) -0.20 (-0.45, 0.05) -0.21 (-0.48, 0.07) 0.00 (-0.11, 0.11) 0.14 (-0.24, 0.52)
-0.01 (-0.26, 0.24)
-0.16 (-0.78, 0.46) -0.04 (-0.39, 0.32) 0.01 (-0.18, 0.20) SMD (95% CI)
-0.02 (-0.21, 0.18)
100.00 15.55 12.96 84.45 6.84
15.89
2.59 7.91 27.36 Weight
26.46 %
0
-.782 0 .782
people’s food choices [32]. Several studies assessed in this systematic review suggested that education in
nutrition could result in healthier food choices [19,
20, 22, 24, 31].
In one study, both calorie and physical activity la-bels had less effect on exercise-related outcomes
[22]. However, findings from other studies showed
that the physical activity label is more likely to con-tribute to lower-calorie food choices and increased
physical activity levels [16, 19]. Among low-income
African American adolescents, physical activity but not calorie information had a significant effect in re-ducing the purchase of sugar-sweetened beverages
[33]. On the other hand, among Hispanics, and in
participants from Western and Mid-Western geo-graphic regions with household income of less than $35,000, no significant associations were reported
among consumers for these outcomes [19].
Another question is whether the label’s appearance
as a schematic representation can make a difference
in people’s preferences. In a study that used
eye-tracking, a schematic image that depicted minutes to run on the nutrition factsheet was felt to be trustworthy [34].
Although food labeling is not a new strategy for educating consumers, researchers continue looking for the most effective methods. This issue is be-coming increasingly important as we face the
obes-ity outbreak and increased diversity of food
Table 3Sensitivity analysis in high quality studies Selected study SMDa 95%CI Z
P-Value I2
1 −0.012 −0.129
0.106
0.20 0.844 0.0%
2 −0.064 −0.195
0.067
0.96 0.339 0.0%
3 −0.053 −0.183
0.078
0.79 0.428 0.0%
4 −0.048 −0.168
0.072
0.79 0.432 0.0%
5 −0.038 −0.147
0.072
0.67 0.502 0.0%
a
Standardized Mean Difference
Heterogeneity between groups: p = 0.102
Overall (I-squared = 0.0%, p = 0.815) real
Study
Antonelli R (2015)
Shah M (2016) ID
Reale S (2016) unreal
Platkin C (2014) Dowray S (2013) Pang J (2013)
James A (2015)
Subtotal (I-squared = 0.0%, p = 0.992)
Subtotal (I-squared = 0.0%, p = 0.936)
1.85 (-18.26, 21.96) 5.00 (-139.17, 149.17)
-4.57 (-100.74, 91.60) WMD (95% CI)
-9.05 (-95.98, 77.88)
-76.50 (-371.40, 218.40) -10.90 (-141.54, 119.74) 8.20 (-14.28, 30.68)
-64.00 (-149.91, 21.91) 6.08 (-14.66, 26.81)
-64.98 (-147.46, 17.51)
100.00 %
1.95
4.37 Weight
5.35
0.47 2.37 80.02
5.48 94.06
5.94
0
-371 0 371
products. In addition, since various factors such as taste, price, culture, and knowledge play roles in food choices making the ability to influence food decisions even more difficult. Physical activity label-ing of food products has been criticized in several ways. One of the criticisms of the use of physical activity label is the failure in incorporating the base
metabolic rate [35], which can cause a misleading
effect on how our bodies use energy. The average person may think that all calories must be burned
by “extra” physical activity making it appear nearly
impossible to burn so many calories [37]. On the
other hand Cramer et al. [17] suggests that if
people get aware of the amount of activity they need to burn the energy, they can be encouraged to be more physically active. It should be noted that this meta-analytic review has been conducted on studies performed only on adults. The hypothetical
scenario study by Viera and Antonelli [38] in which
the participants selected foods items for their chil-dren was not included in this review. We found only one eligible study that examined potential out-comes among children, but in this study the par-ents were asked about food ordering for their
children [38]. Therefore, we included the results for
the parents [19]. Similar studies should be
con-ducted on younger ages in order to assess their preferences. The results of these studies may be used to encourage families toward healthier food choices. Part of the above encouragement may be
done through education [36].
This study has several strengths. First, we included studies that had large sample sizes. Secondly, most stud-ies included in our meta-analysis were adjusted for
confounding factors. Third, we performed subgroup ana-lysis by BMI, percentage of females, age and setting of studies.
Our review also has several limitations. First, the number of included studies was small. In particu-lar, more real-world studies are needed to have a better understanding of labeling effects. Secondly, in this study, the effect of two types of labeling on
calorie purchasing was explored. However, the
amount of consumption was not addressed. This was mainly due to the limited real-world studies included in this review. Third, because of the low number of studies, we could not compare the
cal-orie order between the physical activity label
groups in miles and minutes. More studies are needed to assess the effectiveness of these two types of labeling. Fourth, search for unpublished studies was not conducted.
Conclusion
In summary, physical activity calorie equivalent la-beling compared to calorie-only lala-beling did not significantly reduce calories ordered. In this study we included 8 studies all of which were conducted in high-income countries and in which races includ-ing black, white, and mixed were investigated. Therefore, we expect that our results could be gen-eralized to different populations from high-income countries. Further original research in middle- and low- income countries is necessary to confirm whether these findings are similar in such settings. Also, more research is needed to examine whether
physical activity labeling influences exercise
behaviors.
Filled funnel plot with pseudo 95% confidence limits
theta, filled
s.e. of: theta, filled
0 .1 .2 .3
-1 -.5 0 .5
Appendix 2
PUBMED:
((((((Label*[tiab] AND Food[tiab]) OR (Label*[tiab] AND Nutrition*[tiab]) OR (Menu[tiab] AND Label*[-tiab]) OR (food[tiab] AND marking[Label*[-tiab]) OR
(food[-tiab] AND packing[tiab]) OR (food[tiab] AND
wrapping[tiab]) OR (Calorie*[tiab] AND Converter[-tiab]) OR (Label*[tiab] And eat*[Converter[-tiab]) OR (Label*[tiab] AND Nutrient*[tiab]) OR (Nutrient[tiab] AND con-tent[tiab]) OR“food Away from home”[tiab] OR “traffic
light”[tiab] OR PACE[tiab]))) AND (((Activit*[tiab]
AND Motor[tiab]) OR (Activity[tiab] AND Physical[-tiab]) OR (Activit*[tiab] AND Locomotor[Physical[-tiab]) OR Exercise[tiab] OR (Energy[tiab] AND Expenditure[tiab]) OR walk*[tiab]))) AND (((Restriction[tiab] AND Calor-ic[tiab]) OR (Diet [tiab] AND “Low-Calorie”[tiab]) OR
“Low Calorie Diet”[tiab] OR (Energy[tiab] AND
Inta-ke[tiab]) OR (Caloric[tiab] AND intake[tiab] AND restriction[tiab]) OR Calorie[tiab] OR kilocalorie[tiab]
OR “Food energy”[tiab] OR K-Cal[tiab] OR Kcal[tiab]
OR (meal*[tiab] AND “Low Calorie”[tiab]) OR
(meal*[-tiab] AND Low-Calorie[(meal*[-tiab]) OR (food[(meal*[-tiab] AND order[tiab]) OR (food[tiab] AND consume[tiab]) OR (food[tiab] AND consumption[tiab]) OR (food[tiab] AND decision[tiab]) OR (diet[tiab] AND selection[-tiab]) OR (diet[tiab] AND decision[selection[-tiab]) OR (food[tiab] AND desire[tiab]) OR (diet[tiab] AND desire[tiab]) OR (food[tiab] AND choose[tiab]) OR (diet[tiab] AND choose[tiab]) OR (appetite[tiab] AND regulation[tiab]) OR (feed[tiab] AND intake[tiab]) OR (feeding[tiab] AND methods[tiab]) OR (food[tiab] AND ingestion[-tiab]) OR (“food intake”[tiab] AND regulation[tiab]) OR (food[tiab] AND intake[tiab]) OR (food[tiab] AND uptake[tiab]) OR (Preference[tiab] AND Food[tiab]) OR (Selection*[tiab] AND Food[tiab]) OR (food[tiab] AND choice[tiab]) OR (behavior[tiab] AND eating[tiab]) OR (nutrition[tiab] AND behavior[tiab])))) AND (2000/01/ 01:2016/10/31[dp])
Num Question item Criteria Answer
1 Is the research has been conducted in real world? Low Risk of Bias
High Risk of Bias Unclear
2 Is the randomization method described? Age, Education, Socio-economic status, BMI Low Risk of Bias High Risk of Bias Unclear
3 Are inclusion criteria have been mentioned? Age, BMI,… Low Risk of Bias
High Risk of Bias Unclear
4 Are exclusion criteria have been mentioned? Age, BMI, physical activity, dieting, Special diets such as vegetarian, pregnancy,…
At least, 2 exclusion criteria should be mentioned.
Low Risk of Bias High Risk of Bias Unclear
5 Is the study generalizable? According to Race, BMI, Age
Students, Academic people
Low Risk of Bias High Risk of Bias Unclear
6 Are there any criteria to assess quality of participants’ responses?
At least one of these criteria shows quality assessment of responses:
- Very quick answers
- Uncompleted data related to outcome - Assessment of hunger, desire to eat, before food
selection and the amount of total calorie intake (in experimental researches)
- Including incentive for completeness
Low Risk of Bias High Risk of Bias Unclear
7 Is the questionnaire implemented in pilot phase? Consumer views about menu diversity Low Risk of Bias High Risk of Bias Unclear
8 Does the menu have enough variety? According to carbohydrate, protein, and beverages (at least 1 sweetened beverages)
- If one of the groups not included in the menu, it should be mentioned as high risk of bias.
Low Risk of Bias High Risk of Bias Unclear
9 Are the differences of factors and their effects on primary outcome (question number 2) considered in statistical analysis?
Adjustment for age, education, socio-economic status, BMI
SCOPUS:
((((TITLE-ABS (label*) AND TITLE-ABS (food)) OR (TITLE-ABS (label*) AND TITLE-ABS (nutri-tion*)) OR (TITLE-ABS (menu) AND TITLE-ABS (label*)) OR (TITLE-ABS (food) AND TITLE-ABS (marking)) OR (TITLE-ABS (food) AND TITLE-ABS (packing)) OR (TITLE-ABS (food) AND TITLE-ABS
(wrapping)) OR (TITLE-ABS (calorie*) AND
TITLE-ABS (converter)) OR (TITLE-ABS (label*) AND TITLE-ABS (eat*)) OR (TITLE-ABS (label*) AND TITLE-ABS (nutrient*)) OR (TITLE-ABS (nu-trient) AND TITLE-ABS (content)) OR TITLE-ABS
(“food Away from home”) OR TITLE-ABS (“traffic
light”) OR TITLE-ABS (pace))) AND (TITLE-ABS
(activit*) AND TITLE-ABS (motor)) OR
(TITLE--ABS (activit*) AND TITLE-ABS (physical)) OR
(TITLE-ABS (activit*) AND TITLE-ABS
(loco-motor)) OR TITLE-ABS (exercise) OR (TITLE-ABS
(energy) AND TITLE-ABS (expenditure)) OR
TITLE-ABS (walk*) AND ((TITLE-ABS (restriction) AND TITLE-ABS (caloric)) OR (TITLE-ABS (diet*)
AND TITLE-ABS (“Low-Calorie”)) OR TITLE-ABS
(“Low Calorie Diet”) OR (TITLE-ABS (energy) AND
TITLE-ABS (intake)) OR (TITLE-ABS (caloric) AND TITLE-ABS (intake) AND TITLE-ABS (restriction)) OR TITLE-ABS (calorie) OR TITLE-ABS
(kilocal-orie) OR TITLE-ABS (“Food energy”) OR
TITLE-ABS (k-cal) OR TITLE-ABS (kcal) OR
(TITLE-ABS (meal*) AND TITLE-ABS (“Low
Cal-orie”)) OR (TITLE-ABS (meal*) AND TITLE-ABS
(low-calorie)) OR (TITLE-ABS (food) AND
TITLE-ABS (order)) OR (TITLE-ABS (food) AND
TITLE-ABS (consume)) OR (TITLE-ABS (food)
AND TITLE-ABS (consumption)) OR (TITLE-ABS (food) AND TITLE-ABS (decision)) OR (TITLE-ABS (diet) AND TITLE-ABS (selection)) OR (TITLE-ABS (diet) AND TITLE-ABS (decision)) OR (TITLE-ABS (food) AND TITLE-ABS (desire)) OR (TITLE-ABS (diet) AND TITLE-ABS (desire)) OR (TITLE-ABS (food) AND TITLE-ABS (choose)) OR (TITLE-ABS (diet) AND TITLE-ABS (choose)) OR (TITLE-ABS
(appetite) AND TITLE-ABS (regulation)) OR
(TITLE-ABS (feed) AND TITLE-ABS (intake)) OR (TITLE-ABS (feeding) AND TITLE-ABS (methods)) OR (TITLE-ABS (food) AND TITLE-ABS
(inges-tion)) OR (TITLE-ABS (“food intake”) AND
TITLE-ABS (regulation)) OR (TITLE-ABS (food) AND TITLE-ABS (intake) OR (TITLE-ABS (food) AND TITLE-ABS (uptake)) OR (TITLE-ABS (prefer-ence) AND TITLE-ABS (food)) OR (TITLE-ABS (se-lection) AND TITLE-ABS (food)) OR (TITLE-ABS (food) AND TITLE-ABS (choice)) OR (TITLE-ABS (behavior) AND TITLE-ABS (eat*)) OR (TITLE-ABS (nutrition) AND TITLE-ABS (behavior))))) AND
((((PUBYEAR > 1999 AND PUBYEAR < 2016) OR PUBDATETXT (january 2016) OR PUBDATETXT (february 2016) OR PUBDATETXT (march 2016) OR PUBDATETXT (april 2016) OR PUBDATETXT (may 2016) OR PUBDATETXT (june 2016) OR
PUBDATETXT (july 2016) OR PUBDATETXT
(agust 2016) OR PUBDATETXT(September 2016) OR PUBDATETXT(October 2016))))
Cochrane:
((((((Label* AND Food) OR (Label* AND Nutri-tion*) OR (Menu AND Label*) OR (food AND pack-ing) OR (food AND wrapppack-ing) OR (Calorie* AND Converter) OR (Label* And eat*) OR (Label* AND
Nutrient*) OR (Nutrient AND content) OR “food
Away from home” OR “traffic light” OR PACE)))
AND (((Activit* AND Motor) OR (Activity AND Physical) OR (Activit* AND Locomotor) OR Exer-cise OR (Energy AND Expenditure) OR walk*))) AND (((Restriction AND Caloric) OR (Diet AND
“Low-Calorie”) OR “Low Calorie Diet” OR (Energy
AND Intake) OR (Caloric AND intake AND
restric-tion) OR Calorie OR kilocalorie OR “Food energy”
OR K-Cal OR Kcal OR (meal* AND “Low Calorie”)
OR (meal* AND Low-Calorie) OR (food AND order) OR (food AND consume) OR (food AND consump-tion) OR (food AND decision) OR (diet AND selec-tion) OR (diet AND decision) OR (food AND desire) OR (diet AND desire) OR (food AND choose) OR (diet AND choose) OR (appetite AND regulation) OR (feed AND intake) OR (feeding AND
methods) OR (food AND ingestion) OR (“food
in-take” AND regulation) OR (food AND intake) OR
(food AND uptake) OR (Preference AND Food) OR (Selection* AND Food) OR (food AND choice) OR (behavior AND eating) OR (nutrition AND behav-ior)))) AND (2000:2016)
Web of science: 506
((TI = (label*) AND TI = (food)) OR (TS = (label*) AND TS = (nutrition*)) OR (TS = (menu) AND TS = (label*)) OR (TI = (food) AND TI = (marking)) OR (TI = (food) AND TI = (packing)) OR (TI = (food) AND TI = (wrapping)) OR (TS = (calorie*) AND TS = (converter)) OR (TI = (label*) AND TI = (eat*)) OR (TI = (label*) AND TI = (nutrient*)) OR (TS =
(nutri-ent) AND TS = (cont(nutri-ent)) OR TS = (“food Away
from home”) OR TS = (“traffic light”) OR TS
= (pace)) AND ((TI = (activit*) AND TI = (motor)) OR (TI = (activit*) AND TI = (physical)) OR (TI = (activit*) AND TI = (locomotor)) OR TI = (exercise) OR (TS = (energy) AND TS = (expenditure)) OR TS = (walk*)) AND ((TS = (restriction) AND TS =
(cal-oric)) OR (TS = (diet*) AND TS = (“Low-Calorie”))
OR TS = (“Low Calorie Diet”) OR (TS = (energy)
TS = (k-cal) OR TS = (kcal) OR (TS = (meal*) AND
TS = (“Low Calorie”)) OR (TS = (meal*) AND TS
= (low-calorie)) OR (TS = (food) AND TS = (order)) OR (TS = (food) AND TS = (consume)) OR (TS = (food) AND TS = (consumption)) OR (TS = (food) AND TS = (decision)) OR (TS = (diet) AND TS = (se-lection)) OR (TS = (diet) AND TS = (decision)) OR
(TS = (food) AND TS = (desire)) OR (TS = (diet)
AND TS = (desire)) OR (TS = (food) AND TS
= (choose)) OR (TS = (diet) AND TS = (choose)) OR
(TS = (appetite) AND TS = (regulation)) OR (TS
= (feed) AND TS = (intake)) OR (TS = (feeding) AND TS = (methods)) OR (TS = (food) AND TS =
(inges-tion)) OR (TS = (“food intake”) AND TS =
(regula-tion)) OR (TS = (food) AND TS = (intake) OR (TS = (food) AND TS = (uptake)) OR (TI = (preference) AND TI = (food)) OR (TS = (selection) AND TS = (food)) OR (TS = (food) AND TS = (choice)) OR (TS = (behavior) AND TS = (eat*)) OR (TS =
(nutri-tion) AND TS = (behavior)))) AND (PY = (2000–
2016))
Additional file 1:Table S1.PICOS (population, intervention, comparator, outcome, setting). (DOC 29 kb)
Additional file 2:PRISMA 2009 Checklist. (DOC 63 kb)
Abbreviations
BMI:Body mass index; CALERIE: Comprehensive assessment of the long-term effects of reducing intake of energy; DNA: Deoxyribonucleic acid; FFM: Fat free mass; PICOS: Population, intervention, comparator, outcome, setting; RNA: Ribonucleic acid
Acknowledgements
This research has been supported by Tehran University of Medical Sciences & health Services.
Funding
The study was funded by Tehran University of Medical Sciences.
Availability of data and materials
All data generated or analyzed during this study are included in this article and its supplementary information files.
Authors’contributions
SS and AV designed research; SS and MB conducted research; SS and MB provided essential materials; SS and MB analyzed data; SS, AK, MQ performed statistical analysis; SS wrote paper; SS, MB, AK, MQ, and AV had primary responsibility for final content. All authors read and approved the final manuscript.
Ethics approval and consent to participate
This study was approved by Tehran University of Medical Sciences with the registry code of 96-01-61-33489 and registered athttps://www.crd.york.ac.uk/ prospero/display_record.php?RecordID=51697as CRD42017051697.
Consent for publication
As the study does not contain any individual person’s data in any form (including individual details, images or videos), this section is not applicable to our study.
Competing interests
The authors declare that they have no competing interests.
Publisher’s Note
Springer Nature remains neutral with regard to jurisdictional claims in published maps and institutional affiliations.
Author details
1Food and Nutrition Policy, Department of Community Nutrition, School of
Nutritional sciences and Dietetics, Tehran University of Medical Sciences, Tehran, Iran.2Students’Scientific Research Center, Tehran University of Medical Sciences, Tehran, Iran.3PhD student in Nutrition, Department of Community Nutrition, School of Nutritional Sciences and Dietetics, Tehran University of Medical Sciences, Tehran, Iran.4MD, MPH, PhD of Epidemiology, Department of Health Sciences Education Development, School of Public Health, Tehran University of Medical Sciences, Tehran, Iran.5PhD of Epidemiology, Non-communicable Diseases Research Center, Alborz University of Medical Sciences, Karaj, Iran.6MD, MPH, Professor and Chair, Department of Community and Family Medicine, Duke University, Durham, NC, USA.7No 44, Hojjat-dost Alley, Naderi Street, Keshavarz Boulevard, Tehran 1416-643931, Iran.
Received: 7 February 2018 Accepted: 30 August 2018
References
1. Serdula MK, Mokdad AH, Williamson DF, Galuska DA, Mendlein JM, Heath GW. Prevalence of attempting weight loss and strategies for controlling weight. JAMA. 1999;282:1353.
Appendix 3
2. Celis-Morales C, Lara J, Mathers JC. Personalising nutritional guidance for more effective behaviour change. Proc Nutr Soc. 2015;74:130.
3. Colman RJ, Beasley TM, Kemnitz JW, Johnson SC, Weindruch R, Anderson RM. Caloric restriction reduces age-related and all-cause mortality in rhesus monkeys. Nat Commun. 2014;5:3557.
4. Mattison JA, Roth GS, Beasley TM, Tilmont EM, Handy AM, Herbert RL, et al. Impact of caloric restriction on health and survival in rhesus monkeys from the NIA study. Nature. 2012;489:318.
5. Most J, Tosti V, Redman LM, Fontana L. Calorie restriction in humans: an update. Ageing Res Rev. 2017;39:36.
6. Ravussin E, Redman LM, Rochon J, Das SK, Fontana L, Kraus WE, et al. A 2-year randomized controlled trial of human caloric restriction: feasibility and effects on predictors of health span and longevity. J Gerontol A Biol Sci Med Sci. 2015;70:1097.
7. Villareal DT, Fontana L, Das SK, Redman L, Smith SR, Saltzman E, et al. Effect of two-year caloric restriction on bone metabolism and bone mineral density in non-obese younger adults: a randomized clinical trial. J Bone Miner Res. 2016;31:40.
8. Cecchini M, Lauer JA, Sassi F. The OECD/WHO chronic disease prevention (CDP) model: a tool to identify effective and efficient strategies to prevent NCDs. Applying modeling to improve health and economic policy decisions in the Americas; 2015. p. 7.
9. Pearce N, Ebrahim S, McKee M, Lamptey P, Barreto ML, Matheson D, et al. Global prevention and control of NCDs: limitations of the standard approach. J Public Health Policy. 2015;36:408.
10. Mozaffarian D, Afshin A, Benowitz NL, Bittner V, Daniels SR, Franch HA, et al. Population approaches to improve diet, physical activity, and smoking habits a scientific statement from the American Heart Association. Circulation. 2012;126:1514.
11. Campos S, Doxey J, Hammond D. Nutrition labels on pre-packaged foods: a systematic review. Public Health Nutr. 2011;14:1496.
12. Swartz JJ, Braxton D, Viera AJ. Calorie menu labeling on quick-service restaurant menus: an updated systematic review of the literature. Int J Behav Nutr Phys Act. 2011;8:135.
13. Bleich SN, Pollack KM. The publics’understanding of daily caloric recommendations and their perceptions of calorie posting in chain restaurants. BMC Public Health. 2010;10:121.
14. Roberto CA, Larsen PD, Agnew H, Baik J, Brownell KD. Evaluating the impact of menu labeling on food choices and intake. Am J Public Health. 2010;100:312.
15. Urban LE, McCrory MA, Dallal GE, Das SK, Saltzman E, Weber JL, et al. Accuracy of stated energy contents of restaurant foods. JAMA. 2011; 306(3):287.
16. Swartz JJ, Dowray S, Braxton D, Mihas P, Viera AJ. Simplifying healthful choices: a qualitative study of a physical activity based nutrition label format. Nutr J. 2013;12:1.
17. Cramer S. Food should be labelled with the exercise needed to expend its calories. BMJ. 2016;353:i1856.
18. Hersey JC, Wohlgenant KC, Arsenault JE, Kosa KM, Muth MK. Effects of front-of-package and shelf nutrition labeling systems on consumers. Nutr Rev. 2013;71:1.
19. Antonelli R, Viera AJ. Potential effect of physical activity calorie equivalent (PACE) labeling on adult fast food ordering and exercise. PLoS One. 2015;10: e0134289.
20. Dowray S, Swartz JJ, Braxton D, Viera AJ. Potential effect of physical activity based menu labels on the calorie content of selected fast food meals. Appetite. 2013;62:173.
21. James A, Adams-Huet B, Shah M. Menu labels displaying the kilocalorie content or the exercise equivalent: effects on energy ordered and consumed in young adults. Am J Health Behav. 2015; 29:294.
22. Lee MS, Thompson JK. Exploring enhanced menu labels’influence on fast food selections and exercise-related attitudes, perceptions, and intentions. Appetite. 2016;105:416.
23. Platkin C, Yeh M-C, Hirsch K, Wiewel EW, Lin C-Y, Tung H-J, et al. The effect of menu labeling with calories and exercise equivalents on food selection and consumption. BMC Obes. 2014;1(1):1.
24. Reale S, Flint SW. Menu labelling and food choice in obese adults: a feasibility study. BMC Obes. 2016;3:016.
25. Shah M, Bouza B, Adams-Huet B, Jaffery M, Esposito P, Dart L. Effect of calorie or exercise labels on menus on calories and macronutrients ordered
and calories from specific foods in Hispanic participants: a randomized study. J Investig Med. 2016;64:1261.
26. Higgins JP, Altman DG, Gøtzsche PC, Jüni P, Moher D, Oxman AD, et al. The Cochrane Collaboration’s tool for assessing risk of bias in randomised trials. BMJ. 2011;343:5928.
27. Liberati A, Altman DG, Tetzlaff J, Mulrow C, Gøtzsche PC, Ioannidis JP, et al. The PRISMA statement for reporting systematic reviews and meta-analyses of studies that evaluate health care interventions: explanation and elaboration. PLoS Med. 2009;6(7):e1000100.
28. Cohen J. The statistical power of abnormal-social psychological research: a review. J Abnorm Soc Psychol. 1962;65:145–53.
29. Egger M, Smith GD, Schneider M, Minder C. Bias in meta-analysis detected by a simple, graphical test. BMJ. 1997;315:629.
30. Duval S, Tweedie R. Trim and fill: a simple funnel-plot–based method of testing and adjusting for publication bias in meta-analysis. Biometrics. 2000; 56:455.
31. Pang J, Hammond D. Efficacy and consumer preferences for different approaches to calorie labeling on menus. J Nutr Educ Behav. 2013;45:669. 32. Nestle M, Wing R, Birch L, DiSogra L, Drewnowski A, Middleton S, et al.
Behavioral and social influences on food choice. Nutr Rev. 1998;56(5):50–64. 33. Bleich SN, Herring BJ, Flagg DD, Gary-Webb TL. Reduction in purchases of
sugar-sweetened beverages among low-income black adolescents after exposure to caloric information. Am J Public Health. 2012;102(2):329–35. 34. Wolfson JA, Graham DJ, Bleich SN. Attention to physical activity–equivalent
calorie information on nutrition facts labels: an eye-tracking investigation. J Nutr Educ Behav. 2017;49:35.
35. Howard SJ. Labelling food with the exercise needed to expend its calories may lack integrity when activity is summed over the course of a whole day. BMJ. 2016;353:2430.
36. Davies S. Annual report of the chief medical officer: surveillance volume, 2012: on the state of the public’s health. London: Department of Health; 2014.
37. Sylvetsky AC, Dietz WH. Nutrient-content claims—guidance or cause for confusion? N Engl J Med. 2014;371:195.
![Fig. 8 An example of calorie labeling and physical activitylabeling [20]](https://thumb-us.123doks.com/thumbv2/123dok_us/756810.2071847/12.595.56.291.417.706/fig-example-calorie-labeling-physical-activitylabeling.webp)