R E S E A R C H
Open Access
Impact of reducing portion sizes in
worksite cafeterias: a stepped wedge
randomised controlled pilot trial
Gareth J. Hollands
1*, Emma Cartwright
1,2, Mark Pilling
1, Rachel Pechey
1, Milica Vasiljevic
1, Susan A. Jebb
1,2and Theresa M. Marteau
1Abstract
Background:Reducing the portion sizes of foods available in restaurants and cafeterias is one promising approach to reducing energy intake, but there is little evidence of its impact from randomised studies in field settings. This study aims toi.examine the feasibility and acceptability, andii.estimate the impact on energy purchased, of reducing portion sizes in worksite cafeterias.
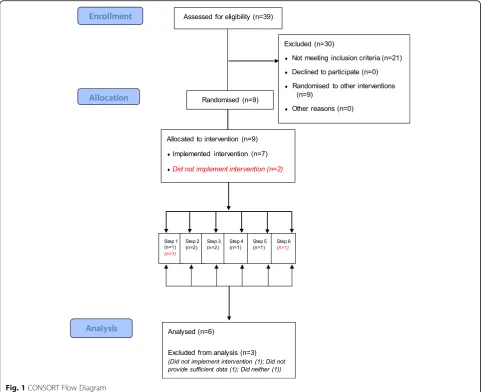
Methods:Nine worksites in England were recruited to reduce by at least 10% the portion sizes of foods available in their cafeterias from targeted categories (main meals, sides, desserts, cakes). In a stepped wedge randomised controlled pilot trial, each site was randomised to a date of implementation, staggered fortnightly, following a baseline period of four weeks. Impact on energy purchased was analysed using generalised linear mixed modelling. We also assessed feasibility, acceptability, and fidelity of intervention implementation.
Results:Data from six of the nine randomised sites were analysed, with three sites excluded for not providing sufficient data and/or not implementing the intervention. The extent to which the intervention was implemented varied by site, with between 6 and 49% of products altered within targeted categories. Feedback following the intervention suggested it was broadly acceptable to customers and cafeteria staff. For the primary outcome of daily energy (kcal) purchased from intervention categories, there was no statistically significant change when data from all six sites were pooled: percentage change−8.9% (95% CI: -16.7,−0.4;p= 0.081). Each of these six sites showed reductions in energy purchased, ranging from−15.6 to−0.3%, which were borderline statistically significant at two sites (respective percentage changes (95% CIs): −15.6% (−26.7,−2.8);−14.0% (−25.0,−1.2)). Secondary outcome data are suggestive of a compensatory increase in energy purchased from food categories not targeted by the intervention, with no overall effect observed on energy purchased across all categories.
Conclusions:The results of this pilot trial suggest that reducing portion sizes could be effective in reducing energy purchased and consumed from targeted food categories, and merits investigation in a larger trial. Future studies will need to address factors that prevented optimal implementation including site dropout and application across a limited range of products.
Trial Registration:(ISRCTN52923504). Registered on 20th September 2016.
Keywords:Portion size, Workplace interventions, Physical micro-environment, Choice architecture, Nudging, Stepped wedge trial, Randomised controlled trial
* Correspondence:[email protected]
1Behaviour and Health Research Unit, University of Cambridge, Cambridge, UK
Full list of author information is available at the end of the article
Introduction
Unhealthy patterns of food consumption, including excess energy intake, make a major contribution to the burden of non-communicable disease that accounts for more than two-thirds of deaths worldwide [1, 2]. The immediate physical environments with which we interact exert a con-siderable influence on selection and consumption of food, potentially without awareness [3–5]. As such, changing cues within physical micro-environments such as restau-rants and shops could act as a catalyst for changing beha-viour to improve health [6–9]. Worksite cafeterias are a particularly important intervention setting, with estimates suggesting that at least one-third of an adult’s daily energy intake is consumed when at work [10]. A key environmen-tal cue to consumption, and therefore a promising target for interventions in physical micro-environments, is the portion size of foods available for selection, purchase and consumption. This is supported by the findings of a Cochrane review [11] as well as other systematic and narrative reviews [12–14] that consistently highlight the important effect of portion size on consumption.
A key limitation of the existing evidence base is that most studies that attempt to isolate the singular effect of reducing portion sizes have been conducted in controlled, laboratory settings [11] with few studies in field settings, es-pecially involving adults. Studies in workplaces have typic-ally tested the impact of multiple concurrent intervention components [15,16], while studies of adults in uncontrolled restaurant or cafeteria settings are scarce and typically make few reductions in portion size across the range of available food options, and across few sites [17,18]. A small number of studies have implemented a promising but slightly different intervention in which reduced portion options are added to the range of available options, although with larger sizes remaining available [19–21].
The current study instead focuses on an intervention that effectively removes larger portion sizes from sale and replaces them with reduced sizes of the same product. A recent study [22] used this approach to reduce portions of meat in three restaurants using a randomised crossover design. However, this was only in some main meal selec-tions and was combined with simultaneously increasing the portion sizes of accompanying vegetable servings. To our knowledge, the current study is the most comprehen-sive to date of an intervention to directly reduce portion sizes of menu items in a field setting, both in terms of the number of study sites, and the extent of the range of products targeted by the intervention.
Beyond estimating the potential behavioural impact of this intervention, the current study sought to examine the feasibility and acceptability of reducing portion size. Feasibility here concerns how readily this type of inter-vention can be implemented within a cafeteria setting, and an assessment of the feasibility of conducting a
larger, potentially definitive, trial. Acceptability to key stakeholders, including the customers subject to the intervention, is another relevant concern given that this influences the likelihood of implementation by actors in positions to change environments. While there is evidence from general surveys that environmental inter-ventions including limiting portion sizes are relatively acceptable to the public [23], there is more specific evi-dence from focus groups that portion size interventions may differ in their acceptability, with direct size reduc-tions less likely to be accepted by consumers [24]. We are not, however, aware of intervention studies that have directly reduced portion sizes in this way and examined feasibility and acceptability within the same setting.
Methods Design
A stepped wedge randomised controlled trial design was used (for explanation of the trial design see [25]), between March 2017 and July 2017. Following a baseline period of four weeks for all sites, each site was rando-mised to a date for implementing the intervention, staggered over six, two-week periods (steps), plus an additional one-week intervention period for all sites at the end of the trial. Two sites were randomised to each of the first three steps, with one site randomised to each of the final three steps (see‘Participating sites’for further details). This meant that the duration of the intervention at each site ranged from 3 to 13 weeks. Randomisation was conducted by the host research unit’s statistician using computer-generated random numbers. Following implementation, all sites were required to maintain the intervention until the end of the study. There was no al-location concealment as the research team enrolled and communicated with the sites and were therefore aware of their intervention assignment. Ethical approval for the study was obtained from the University of Cambridge Psychology Research Ethics Committee (Pre.2016.035).
Participating sites
one site (Site 6) was recruited despite having fewer than 350 employees. The current study was con-ducted as one of a set of three separate intervention trials in worksite cafeterias, with the other two pilot trials focusing on a nutritional labelling intervention [26] and an intervention to alter the proportion of healthier vs less healthy foods (Pechey et al., under review). As such, the nine worksites that were initially recruited were identified from a pool of 39 worksites that had expressed an interest in participating in research in their cafeterias. Three had previously par-ticipated in the aforementioned nutritional labelling intervention and had continued with providing nutri-tional labelling in their cafeterias. One of these sites was randomised to each of the first three steps (of six total steps). The other six sites had not previously participated in any intervention and one of these sites was randomised to each of the six steps.
Intervention
The intervention comprised reducing the portion sizes (by volume without changing energy density) of specified food items that were available in the worksite cafeterias (a Size x Product intervention within the TIPPME intervention typology [7]). It was also required that items reduced in size were priced proportionately to the reduction so that value-for-money remained consistent, and that the range of available food products was unchanged. The interven-tion targeted four product categories that initial consult-ation with cafeteria managers had suggested were most feasible for intervention, being main meals, sides, desserts, and cakes. Within these categories, changes were specific-ally requested for (but not limited to) all products that were trayed (e.g. pies), countable in pieces (e.g. scampi), wet/served with a ladle (e.g. curry, rice) or sliced or por-tioned by the sites (e.g. cakes), as these allowed reductions to be made most readily and precisely.
The four intervention categories (main meals, sides, desserts, cakes) were defined as follows:
Main meals
The meat or vegetarian principal element of a meal. In Site 3 only, this did not include any accompanying sides (e.g. rice).
Sides
Carbohydrate-rich portions (e.g. chips), vegetable por-tions (e.g. peas), and protein pots (e.g. tuna, cheese). This did not include those where they were provided as part of main meals.
Desserts
Hot desserts (e.g. crumbles), yoghurts, ice creams, and dessert pots (e.g. cheesecake, mousse, jelly, granola).
Cakes
Slices of cake and tray-bakes.
Categories that were not targeted by the intervention were those that cafeteria managers had indicated were not viable to intervene upon, such as pre-packaged foods (which were not targeted due to sites typically already sell-ing the smallest commercially available sizes) and items for which the customer pays relative to the quantity they self-serve (e.g. salads). In total, these non-intervention cat-egories comprised breakfast foods, hot and cold drinks, soups, savoury snacks, sweet snacks, sandwiches and wraps, salads and self-serve foods, and fruit.
Procedure
A list of products available in each cafeteria was obtained from each site upon recruitment, and a site visit was con-ducted to explain the trial procedures and identify and re-solve any initial issues for intervention implementation. The research team identified specific products that could be targeted, with the catering management making the final decision on what was intervened on. The reductions in portion size varied by site and specific product but were requested to be at least a 10% reduction by volume in each targeted product. Along with keeping a consistent range of available products throughout the duration of the study period, sites were also requested to maintain a consistent environment in other respects, such as cafeteria deco-ration, pricing of products outwith the intervention, and promotion and marketing activities.
Within the first intervention week at each site, compli-ance visits were conducted in which researchers visited the cafeteria to ensure agreed changes had been made (with photographs of intervention items sent by the sites on a weekly basis after that to enable corroboration). Cafeteria customers were not informed of the portion size reductions or commensurate price reductions. In
sites where it was anticipated customers would notice and query reductions, staff (who were necessarily not blinded to the intervention) were instructed to respond to any queries from customers with a non-specific re-sponse concerning management trying various changes to the range of available food. In one site (Site 3) the cafeteria chose to inform customers that some products would be reduced in size. Cafeteria staff were supervised by cafeteria management throughout the study, and did not receive any direct training from the research team. Data on the energy content of each item sold in the cafeteria were provided by each site, with daily sales data obtained from the till records of each site.
Measures
Feasibility and acceptability
These assessments are detailed in the protocol [25] and summarised as follows:
1. Feasibility of recruiting and retaining eligible worksites in a trial: assessed by recruitment and drop-out rates.
2. Feasibility of implementing the intervention: assessed after initial visits to worksite cafeterias by the research team, in discussions and formal interviews with worksite managers and catering teams, and through examination of the sites’sales data. 3. Acceptability of the intervention: measured by
surveying cafeteria customers and summarised with descriptive statistics, complemented by qualitative interviews with worksite or catering managers. 4. Compliance with the study protocol: assessed during
compliance visits conducted during the first week following intervention implementation for each worksite, and via photographs of intervention items that were sent by the sites each week thereafter.
Intervention impact on consumption
Primary outcome:
– Total energy (kcal) purchased per day from intervention categories.
Secondary outcomes:
– Total energy (kcal) purchased per day from non-intervention categories.
– Total energy (kcal) purchased per day from all categories (for all items with calorie information).
Covariates:
– Day of the week, given regular within-week fluctua-tions in sales.
– Number of days pre−/post-intervention, to allow for time trends.
– Daily mean temperature, daily hours of sunshine, and daily rainfall in site location, to account for changing weather conditions that may impact upon sales patterns.
Changes from published protocol
Since the publication of the protocol for this study [25], the primary outcome has been limited to the energy pur-chased from targeted intervention categories only. At the time of discussing potential changes with cafeteria management, it was clear that it was only feasible to intervene within certain product categories, with many categories (such as pre-packaged foods) unable to be changed. The registered primary outcome was changed to reflect this (registered at http://www.isrctn.com/ ISRCTN52923504on 31/5/2017), prior to completion of data collection and prior to any inspection of the data. At this point, the original primary outcome of total en-ergy purchased per day from all categories became a specified secondary outcome.
Analysis of intervention impact
Prior to any data analysis, any sites that did not provide suf-ficient data (we required sales data for the duration of the study period that identified purchases at the individual product level), or that had not implemented the planned intervention as previously described, were excluded from subsequent analysis. Energy (calorie) information provided by sites was matched to their sales data. Where sales of dif-ferent product items had been recorded using the same till button, the median energy value of items recorded under the till button was used. Items with no energy information available across the study period were treated as missing. Daily sales values that were possible statistical outliers based on visual inspection of data plots were investigated by discussing with the sites whether there were any unusual circumstances that could explain them. Sites could not identify reasons that any data should be treated as invalid, and so they were generally considered to be part of the nat-ural range of variation of such measurements. However, due to concerns about the unreasonable influence of any extreme and highly improbable values, we additionally used the median absolute deviation (MAD) approach to detect-ing statistical outliers for each analysis, applydetect-ing a highly conservative threshold of 20 standard deviations. As a re-sult, for the primary outcome analysis we excluded a single value representing one day’s sales at one site, being more than six times the median pre-intervention value at that site and which disproportionately influenced the effect
estimates and worsened model fit. No values were excluded for analyses of secondary outcomes.
Data analysis
Generalised linear mixed models in R version 3.4.2 with packages lme4 [27] and pbkrtest [28] were used. The daily energy purchased was logged in analyses due to skew in the data affecting the residuals in untransformed models.
P-values were calculated using the Kenward-Roger method, to robustly adjust estimates for the small sample size relative to the number of explanatory variables. Primary outcome analysis was on the log of total energy (kcal) purchased per day from targeted food categories and examined the impact of the intervention (modelled using a dummy variable for intervention periods as rando-mised). In addition, the number of transactions, number of days pre-or post-intervention, and weather conditions (temperature, sunshine, rainfall) were modelled as fixed effects, with random effects for worksite (with day of the week nested therein as a random effect due to different daily patterns per site). The unit of analysis was the work-site cafeteria per day, as only aggregate till transaction data were available. To examine the impact of the intervention in each site separately, six separate dummy variables indicating the intervention period in each site replaced the overall intervention dummy variable in a follow-up ana-lysis. Secondary outcomes were examined using the same analysis.
Sensitivity analyses
As implementation of the intervention was delayed at two worksites, we pre-specified conducting sensitivity analyses to account for this. At Site 3, there was a two-week delay in the intervention being introduced. At Site 2, there was a one-week delay in the implementation of main meals and sides categories, which comprised the majority of the inter-vention items. As our main analysis treated interinter-vention pe-riods as randomised, a sensitivity analysis involved running the analyses with the intervention coded as starting from the date when the intervention was actually implemented at Sites 2 and 3. Given three sites had previously partici-pated in a nutritional labelling intervention, we also con-ducted sensitivity analyses that accounted for the different pre-intervention comparator conditions by including a variable indicating whether each site had received no prior intervention or a labelling intervention.
Results
Feasibility and acceptability
Recruiting and retaining eligible worksites in a trial
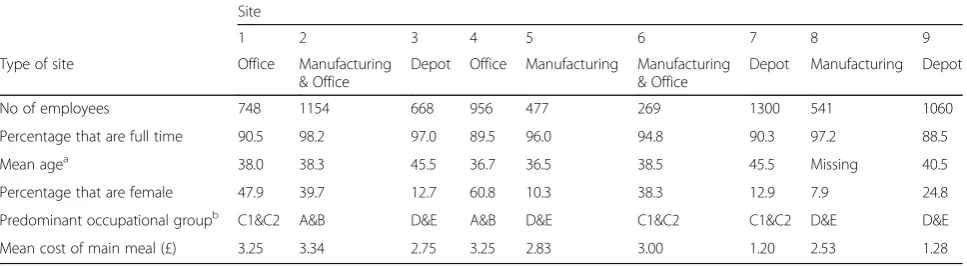
The type of sites varied, including office, depot and manu-facturing sites, with this being reflected in the predominant occupational group. Of the nine randomised sites, three (33%) were not included in the analysis of intervention implementation and impact (although initial feasibility could be assessed); Site 7 did not implement the planned intervention, Site 8 neither implemented the intervention nor provided sufficient data, and Site 9 did not provide suf-ficient data (see the following section for further details). These results suggest that initial recruitment and random-isation of sites into a larger trial would be feasible, but that subsequent retention could be suboptimal.
Feasibility of implementing the intervention
Once recruited, initial site visits and meetings with work-site managers and catering teams identified several important barriers to implementing the intervention in the nine randomised sites. These were grouped as follows:
Acceptability to cafeteria customers
In 6 of 9 sites, catering and worksite managers perceived that customers usually wanted the largest possible meal or meal with most calories, and so may be unhappy if they noticed that sizes had been reduced. This issue was explicitly reported by Site 3 as leading them to make only a small number of portion size reductions. Other sites appeared satisfied that it was manageable.
Proportionate pricing
In all 9 sites, catering and worksite managers emphasised the potential financial implications of the intervention. Caterers were often tied into contracts which would pre-vent proportional pricing, and some were also concerned that reducing portions could affect their profits. These is-sues were addressed by clarifying that senior management within the worksite companies had agreed to cover any
additional costs introduced by the intervention for the study period.
Difficulty of implementation
In all 9 sites, catering and worksite managers emphasised that portion size reductions would be difficult to imple-ment across the entire range of available products. For ex-ample, this was typically not possible for pre-packaged snack products or soft drinks as most cafeterias were already providing the smallest commercially available sizes. Other products were in theory possible to reduce in size but would place too much of a burden on staff, such as changing from self-served quantities of salads to having quantities measured out by staff, or ensuring that single pieces of meat or fish were reduced down in size, and were considered unviable. Relatedly, managers were con-cerned about the additional burden and workload placed on their staff having to change menus and working prac-tices to reduce portions over the intervention period. Sites also did not all follow strict, pre-planned menus, making it difficult to clearly identify products in advance to be targeted by the intervention.
Through discussion between the research team and worksites, these issues were resolved sufficiently such that all nine randomised sites agreed to continue their partici-pation and none dropped out of the study prior to the date at which they were due to introduce the intervention. However, two sites did not implement the planned inter-vention (Sites 7 and 8). Site 7 were not convinced that the intervention was feasible in its intended form, being concerned about perceived unacceptability to cafeteria pa-trons. As a result, they failed to implement the interven-tion by offering multiple different sizes simultaneously rather than replacing larger sizes with reduced sizes. Site 8 introduced a new cafeteria menu concurrent with the start of the intervention period, which while not explicitly linked to concerns about the intervention, highlights the
Table 1Characteristics of recruited sites
Site
1 2 3 4 5 6 7 8 9
Type of site Office Manufacturing & Office
Depot Office Manufacturing Manufacturing & Office
Depot Manufacturing Depot
No of employees 748 1154 668 956 477 269 1300 541 1060
Percentage that are full time 90.5 98.2 97.0 89.5 96.0 94.8 90.3 97.2 88.5
Mean agea 38.0 38.3 45.5 36.7 36.5 38.5 45.5 Missing 40.5
Percentage that are female 47.9 39.7 12.7 60.8 10.3 38.3 12.9 7.9 24.8
Predominant occupational groupb C1&C2 A&B D&E A&B D&E C1&C2 C1&C2 D&E D&E
Mean cost of main meal (£) 3.25 3.34 2.75 3.25 2.83 3.00 1.20 2.53 1.28
a
Reported in age bands, and estimated using the mean age value for employees in each age band
b
difficulty for management in providing an otherwise unchanged cafeteria environment. Sites 8 and 9 did not provide sufficient data to enable inclusion in analysis be-cause neither provided product-level sales data for the duration of the study period (Site 8 did not provide this for any weeks during the study period, while Site 9 pro-vided this for only three study weeks and these data were incomplete). As a result of these issues at Sites 7, 8 and 9, data on the extent to which the intervention was imple-mented is derived from the remaining six sites.
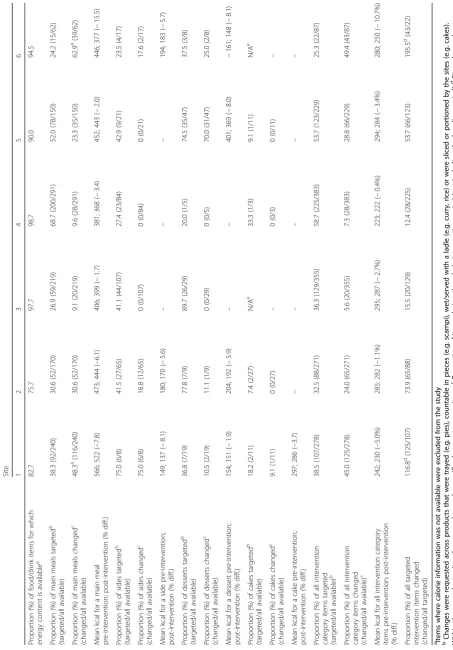
Table 2 presents the intervention characteristics of the six sites. Main meals was the only targeted category where all sites implemented the intervention to at least some de-gree. Three sites intervened on sides, four intervened on desserts, and of the four sites that could have intervened on the cakes category (i.e. that sold products classed as cakes), only one did so. The extent of implementation of the intervention varied substantially by site, ranging from 5.6% of all available intervention category products at Site 3 to 49.4% at Site 6. It is also of note that the percentage of intervention category products that were changed relative to the number specifically targeted also varied, in particular, Sites 3 (15.5%) and 4 (12.4%) made very few changes, while Sites 6 (195.5%) and 1 (116.8%) made widespread changes beyond those initially suggested by the research team. This led to considerable variability; the size of main meals (reflected in mean calorie values at the category level) was reduced by an average of between 1.7% (Site 3) and 15.5% (Site 6). Reductions varied considerably by individual items within intervention categories, but were substantially greater for some items than the suggested minimum of 10%. For example, in Site 3, a portion of scampi was reduced from 514 to 386 kcal, resulting from a 25% decrease in the number of scampi pieces served as a main meal.
Acceptability of the intervention
From the six sites that implemented the intervention, three sites (2, 3, and 6) conducted a post-intervention survey concerning acceptability of the intervention, with the other three sites not collecting feedback as they did not want to alert their customers that portion sizes had been reduced. Of the 2091 employees at the three sites, 175 customers (8.4%) responded to the survey. Two questions were asked of respondents. For the first ques-tion,“How did you feel about the portion size of prod-ucts changing?”, 24% reported feeling pleased or very pleased, 19.4% felt neither pleased nor displeased, 29.1% felt displeased or very displeased, and 27.4% didn’t no-tice the changes. For the second question, “Would you like to see the changes remain in place permanently?”, 44% answered yes (either “yes, definitely” or“yes, prob-ably”), 22.3% didn’t mind, while 33.7% answered no
(either “no, probably not” or “no, definitely not”). In summary, most respondents seemed to find the inter-vention acceptable or were indifferent to or unaware of its implementation, but a sizeable minority were not happy with the reductions in portion size and did not want to see them continue.
Table3highlights comments made by managers in the post-intervention interviews, grouped in the same way as for the barriers identified pre-intervention. Managers did not typically report many customer complaints, con-sistent with the customer survey suggesting most pa-trons were positive or indifferent to the changes. By contrast, the challenges of implementation were com-monly highlighted, although responses indicated that these were reasonably surmountable.
Compliance with the study protocol
In the six sites that implemented the intervention and provided data, compliance with the protocol was high. Once the portion size reductions were introduced, they were implemented consistently throughout the duration of the intervention period, although, as mentioned, im-plementation was delayed in two sites.
Intervention impact
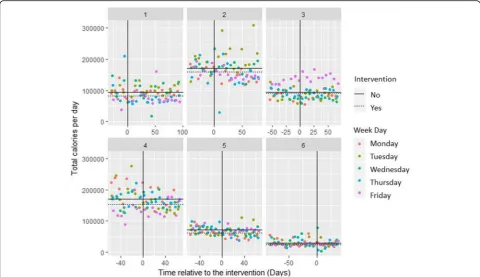
Figure 2 shows the primary outcome measure of mean daily energy purchased by site from intervention cat-egories. However, due to the different base levels of sales across sites and staggered implementation, a simple ana-lysis of pre−/post-intervention means is not appropriate.
Primary outcome
Secondary outcomes
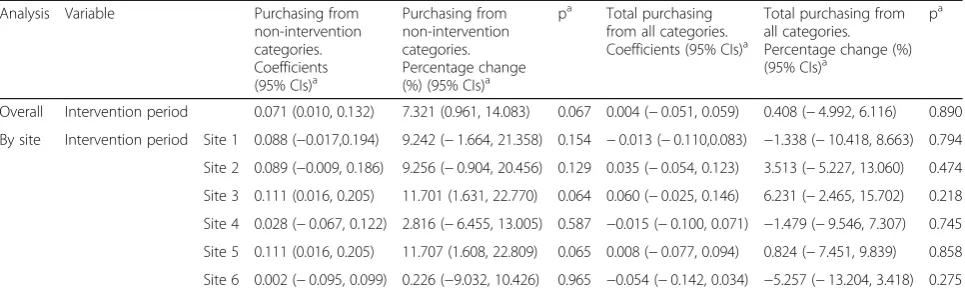
For the secondary outcome of daily energy purchased from non-intervention categories, the mean effect of the intervention across all sites was an increase of 7.3% (95% CI: 1.0 to 14.1;p= 0.067) which was not statistically sig-nificant. At the individual site level, each of the six sites showed increases in energy purchased, with effects ranging from 0.2 to 11.7%. None were statistically sig-nificant, although Sites 3 and 5 were borderline signifi-cant with respective, near-identical mean increases of 11.7% (95% CI: 1.6 to 22.8; p= 0.064) and 11.7% (95% CI: 1.6 to 22.8;p= 0.065). For the secondary outcome of total daily energy purchased from all food categories, the mean effect of the intervention across all sites was an in-crease of 0.4% (95% CI: -5.0 to 6.1,p= 0.890) which was not statistically significant. At the individual site level, three sites showed reductions in energy purchased, ranging from −5.3% to −1.3%, while three showed in-creases, ranging from 0.8 to 6.2%, none of which were statistically significant. See Table 5 for details of secon-dary outcomes.
Sensitivity analyses
We conducted pre-specified sensitivity analyses accounting for delays in intervention implementation at Sites 2 and 3. Analysis of the primary and secondary outcomes was ro-bust to using the actual intervention start date as opposed to intended start date and no conclusions changed. Analyses were also robust to accounting for whether sites had previously participated in a nutritional labelling inter-vention and again no conclusions changed.
Discussion
The results of this study suggest that, first, a future trial of a portion size reduction intervention is feasible, with a high likelihood of initially recruiting and randomising worksite cafeterias. Significant barriers were identified in the randomised sites for implementing the planned intervention and providing necessary data. Nonetheless, six of nine sites in this pilot trial completed the study, suggesting that such barriers are often surmountable. Second, having been implemented, feedback following the intervention suggested it was broadly acceptable to customers and cafeteria staff. Third, the pattern of results suggests that portion size reductions could be effective in cutting energy purchased and thus consumed from targeted food categories. While this was a pilot ra-ther than an appropriately powered confirmatory trial, and no effects were statistically significant in our pri-mary analysis, there was sufficient evidence of feasibility and potential effectiveness to support a larger, poten-tially definitive, trial being conducted.
The direction and size of the effects at some worksites appears consistent with recent systematic review evidence
Table 3Manager comments relating to acceptability
Acceptability to cafeteria customers
“The intervention went quite smoothly really. A lot of the proposed issues that we thought may raise up hadn’t come to, didn’t come to anything. A lot of the people didn’t really notice a 10% variance in their portion sizing.”(Site 1) “I think at [site] the vast majority of people probably either won’t notice or it won’t really bother them sufficiently for them to say anything or do anything any different other than just go along with what’s there and available to them.”(Site 1)
“So honestly there was no real negative feedback or issues regarding the people on site and this intervention happening”(Site 5) “I did expect people to notice that maybe their portion of lasagne was a bit smaller, the amount of pasta they got on their plate was a bit smaller but they actually haven’t so, or if they have they haven’t been concerned about it.”(Site 2 and 6)
“There wasn’t any kind of‘we want them bigger again’or any fuss in any way so no I didn’t get any noise at all from anybody in terms of discontent”(Site 2 and 6)
“I think with some of the colleagues there was some negative feedback. I think they thought it was another initiative from [catering provider] to make more money by reducing the portion sizes.”(Site 3)
“I think because it was only a very minor change really that nobody seemed to come back and say it was an issue.”(Site 4)
Proportionate pricing
“…the technical side gave us a little bit of a challenge reducing the pricing according to the dishes that we did because we didn’t do it across the whole board”(Site 1)
“…didn’t really notice and then when they did once they realised that there was a price reduction they were kind of less bothered by it”(Site 5)
Difficulty of implementation
“What we certainly didn’t anticipate up front when we were talking about these kind of experiments at a higher level is just how many complexities there would be around, I suppose when you then introduce the pricing factor as well”(Site 1 and 5)
“…it’s just become difficult when you get down to the detail of how we actually make this work without upsetting our employees”(Site 1 and 5) “…this intervention and the portion sizes it’s been quite difficult to continue it because of the structure of the pricing and the contract” (Site 1 and 5)
“We did think at the beginning when we talked about it that there could be a few issues…but it went, in real terms it was fine, no problem”(Site 5)
“…the challenges were getting in the smaller size branded products, that don’t exist”(Site 2 and 6)
“…we had the equipment on site so we already had some smaller ladles and cutting up the tray-bakes wasn’t an issue.”(Site 2 and 6) “…probably only looking at hot food, so the hot food counters, because a lot of the portion sizing on pre-packaged foods is pretty reasonable” (Site 4)
“I think [they] struggled at the beginning to work out what they could reduce because a lot of our things we already have things that are relatively cut down. There wasn’t a huge amount of things that we could perhaps change in terms of pre-packaged things…they focused on the main meals where they could serve up slightly less of different dishes”(Site 4)
“…quite a challenging one because we couldn’t advertise entirely what we were doing”(Site 1)
“There’s this view that the guys working out of the factory need feeding up, they’ve got hard manual jobs haven’t they and obviously the definition of, of course they need a few more calories than perhaps someone who’s sitting at a desk all day”(Site 5 and 8)
showing that portion size reductions can substantially re-duce selection and consumption of food [11,12]. The vari-ation observed between sites aligns with recent trials conducted in the same research programme that focus on nutritional labelling [26] and availability interventions (Pechey et al., under review), and previous results of inter-ventions in physical micro-environments suggesting that ef-fects may depend on context or intervention characteristics when applied within worksites [15] or more generally [29].
This inconsistency is unsurprising given the considerable variation in site characteristics in this study. For example, the cafeterias were within worksites that differed in size and function and related socio-demographic characteristics, with some being principally office-based with a more sed-entary workforce from higher occupational groups, and others being depots or manufacturing plants with a physic-ally active workforce. Worksite environments are also sub-ject to considerable complexity, with an interplay of shifting
Fig. 2Scatterplots of daily energy purchased from targeted intervention categories over time, by site per day. Solid black lines indicate the geometric mean at each site pre-intervention; dotted lines post-intervention
Table 4Results of primary outcome analysis by site per day (log total calories)
Analysis Variable Coefficients (95% CIs)a
Percentage change (%) (95% CIs)a
pa Change in energy purchased (kcal)b
Mean number of transactions (s.d.)b
Change in energy purchased (kcal) per transactionb
Overall Portion size intervention period
−0.093 (−0.182,−0.004) −8.92 (−16.68,−0.44) 0.081 −10,208 537 (342) −19.0
By site Portion size intervention period
Site 1 −0.116 (−0.271, 0.039) −10.94 (−23.74, 4.01) 0.188 −12,541 460 (80) −27.3
Site 2 −0.052 (−0.194, 0.090) −5.05 (−17.61, 9.44) 0.499 −11,738 877 (129) −13.4
Site 3 −0.003 (−0.141, 0.134) −0.32 (−13.13, 14.38) 0.965 −2010 340 (28) −5.9
Site 4 −0.074 (−0.212, 0.064) −7.13 (−19.07, 6.56) 0.328 −15,575 1054 (233) −14.8
Site 5 −0.150 (−0.288,−0.012) −13.96 (−25.04,−1.24) 0.071 −10,034 338 (25) −29.7
Site 6 −0.170 (−0.311,−0.029) −15.63 (−26.74,−2.84) 0.051 −4468 147 (45) −30.4
a
physical, political, social and economic environments over time, at a multitude of levels including the cafeteria itself, the wider worksite and organisation that runs it, and the wider context, which all influence behaviour of both those intervening and those exposed to the intervention [30].
The observed reductions in energy purchased from inter-vention categories were apparent in spite of the widely varying, but generally modest, intervention fidelity. While we could not reasonably expect full implementation, four of six sites intervened on fewer than 30% of intervention category items. However, this suboptimal fidelity was not simply a function of sites being unwilling to apply the inter-vention, and may also have reflected an upper bound of what is practicable. It is notable that only 25–59% of inter-vention category items were specifically targeted by the intervention, this being determined by the types of products that were most feasible to reduce in size. While two sites intervened on fewer than 8% of intervention category products–clearly substantially fewer than were targeted -another two sites actually changed more items than were initially suggested by the research team. Constraints on intervening within intervention categories are also set within the wider context of these targeted categories only representing a subset of all the food and drink product ca-tegories available within cafeterias, with others considered unfeasible at the outset.
The importance of optimising the extent to which this intervention can be implemented is emphasised in light of the results for secondary outcomes. This suggests–albeit with the same due caution applied elsewhere about over-interpreting site-level data–that there may be a sub-stantial compensatory increase in energy purchased from those categories that are not subject to portion size reduc-tions, resulting in no overall effect on energy purchased across all categories. Clearly, should this finding be repli-cated, it has important implications for potential effective-ness. It suggests that to maximise effectiveness, impetus
should be placed both on achieving wide implementation within each targeted category, and on extending imple-mentation to a wider range of food categories. Realising these would minimise the capacity for substitution effects or compensatory purchasing, but where there are limited opportunities to do so, the current intervention would not be expected to have a meaningful effect on total energy consumed. Potential solutions involving extra staffing re-sources, more advanced administrative systems or changes to the available ranges of foods in cafeterias may therefore need to be considered and evaluated if implementation is to increase within categories currently targeted and be extended to additional categories.
Strengths and limitations
To our knowledge, the current study is the most compre-hensive to date of an intervention to directly reduce portion sizes of menu items in a field setting, in terms of the number of study sites, the breadth of products that were targeted, and the concurrent assessment of intervention feasibility and acceptability. The field nature of the cafeteria settings represents an important strength. While controlled laboratory studies provide valuable information on potential effects and underlying mechanisms, even when relatively naturalistic they are unable to provide insights into how people - importantly not just the recipients but also those involved in implementation - will respond within a complex food environment. Although challenging to develop and conduct, field studies are vitally important for building a conclusive evidence base for interventions.
The worksite settings also resulted in a number of study limitations. The absence of direct control of the cafeterias and their data collection systems likely impacted upon both intervention fidelity and data quality. Concerning interven-tion fidelity, while sites were instructed to refrain from introducing new promotional activities or making any physical e.g. decorative, changes to the cafeteria, it is
Table 5Regression coefficients and percentage changes for portion size intervention variables in analyses of secondary outcomes per day
Analysis Variable Purchasing from non-intervention categories. Coefficients (95% CIs)a
Purchasing from non-intervention categories. Percentage change (%) (95% CIs)a
pa Total purchasing from all categories. Coefficients (95% CIs)a
Total purchasing from all categories. Percentage change (%) (95% CIs)a
pa
Overall Intervention period 0.071 (0.010, 0.132) 7.321 (0.961, 14.083) 0.067 0.004 (−0.051, 0.059) 0.408 (−4.992, 6.116) 0.890
By site Intervention period Site 1 0.088 (−0.017,0.194) 9.242 (−1.664, 21.358) 0.154 −0.013 (−0.110,0.083) −1.338 (−10.418, 8.663) 0.794
Site 2 0.089 (−0.009, 0.186) 9.256 (−0.904, 20.456) 0.129 0.035 (−0.054, 0.123) 3.513 (−5.227, 13.060) 0.474
Site 3 0.111 (0.016, 0.205) 11.701 (1.631, 22.770) 0.064 0.060 (−0.025, 0.146) 6.231 (−2.465, 15.702) 0.218
Site 4 0.028 (−0.067, 0.122) 2.816 (−6.455, 13.005) 0.587 −0.015 (−0.100, 0.071) −1.479 (−9.546, 7.307) 0.745
Site 5 0.111 (0.016, 0.205) 11.707 (1.608, 22.809) 0.065 0.008 (−0.077, 0.094) 0.824 (−7.451, 9.839) 0.858
Site 6 0.002 (−0.095, 0.099) 0.226 (−9.032, 10.426) 0.965 −0.054 (−0.142, 0.034) −5.257 (−13.204, 3.418) 0.275
a
possible that some (albeit likely minor) operational changes were made over the study period in at least some sites and not reported by cafeteria staff or identified by compliance checks. While working more closely with worksites and increasing levels of direct monitoring would require sub-stantially more resources, it could enable increased confi-dence that this would be avoided. Regarding the quality of data, in some cases the data systems used by the cafeterias were basic and not ideal for this study. For example, we identified that a small number of items that cost the same were recorded on a single till button at some sites, with cafeteria management balancing the need to keep track of purchasing patterns with wishing to avoid the extra time and burden placed on their staff should they have to use more complex purchasing systems. A future trial would likely seek to recruit only sites that already used, or were willing to install, more advanced data systems capable of the detailed recording of sales data needed.
The certainty of the conclusions that can be drawn from this pilot trial are limited. Worksites were either unable, due to not having the necessary systems in place, or unwilling for ethical or privacy issues, to pro-vide us with individual-level data for each customer, so the analysis used site-level data from only six cafeterias. This prevented examination of how individuals may have altered their purchasing behaviour in response to the intervention (such as buying additional servings or alternative products, or reducing their use of the cafe-teria), and how this was modified by participant charac-teristics. Additionally, the variable nature of food purchasing meant that the data tended to be relatively disperse. This resulted in wide confidence intervals around effects, and the inability to map how individuals shifted their purchasing behaviour in response to the intervention. The lack of direct monitoring also meant that the veracity of specific data-points could not be independently corroborated or verified beyond the po-tentially fallible record-keeping and recall of cafeteria management. While there is no reason that these factors would have any systematic influence on the re-sults, any conclusions based on estimating intervention impact from these data are necessarily cautious. Finally, although purchasing represents a strong and workable proxy for consumption, it is important to note that such outcomes are only indicative of potential impact on the amount of energy actually consumed. Again, with more resources, we could have attempted to model actual consumption in a more sophisticated manner, such as taking account of food waste at each site. It is also pertinent to note that while energy consumption in this context is an outcome that is indi-cative of likely health impact, we acknowledge that they are not synonymous – high energy food is typically nutritionally less healthy but is not always.
Implications for research and policy
Given the burden of non-communicable disease [1, 2], there is a clear need for interventions to change be-haviour and that have potential to be scaled up to population level, such as those that target physical micro-environments [7]. The results of this study extend prior evidence that reducing portion sizes may be a promising strategy to reduce energy purchased and in turn consumed. However, confirmatory or definitive trials are needed, likely with longer study durations and a larger number of worksites, as well as more intensive monitoring of, and support pro-vided to, the implementation process. Additionally, more detailed process evaluations would be able to better identify related barriers and solutions.
In terms of policy implications, a key determinant of public health policy action, beyond simply provi-ding sufficient evidence of effectiveness, is accep-tability to key stakeholders including businesses and the publics targeted by such interventions. Encour-agingly, the current study found that portion size reductions were relatively acceptable to cafeteria management and to patrons once they were imple-mented. Our findings are broadly consistent with those of an earlier focus group study of consumers [24] which whilst identifying some resistance to por-tion size reducpor-tions, found that there was general approval of interventions in this area and also of proportional pricing strategies (which were mandated in our intervention, but may not always be feasible). It should be noted, however, that customer feedback in the current study was provided by only a relatively small percentage of worksite employees and that this was provided in the context of modest intervention fidelity. We cannot assume similar support if the intervention were implemented more extensively, potentially increasing adverse responses in customers and cafeteria staff.
Conclusion
The results of this pilot trial suggest that reducing portion sizes could be effective in reducing energy purchased and consumed from targeted food categories, and merits investigation in a larger trial. Future studies will need to address factors that prevented optimal implementation in-cluding site dropout and application across a limited range of products.
Additional file
Additional file 1:Table S1.Regression coefficients (log total calories) and percentage changes from all variables in the primary outcome analysis aggregating across sites per day.Table S2.Regression coefficients (log total calories) and percentage changes from all variables in the primary outcome analysis by site per day. (DOCX 16 kb)
Acknowledgements
We are grateful to all the participating worksites for taking part in this study.
Data availability
The data are commercially sensitive, and were provided by the participating worksites on condition that they are not shared beyond the research team.
Funding
The study is independent research funded by the National Institute for Health Research Policy Research Programme (Policy Research Unit in Behaviour and Health [PR-UN-0409-10109]) and the Institute of Grocery Distribution [RG83425]. RP is supported by a Wellcome Trust Research Fellowship in Society and Ethics [106679/Z/14/Z]. The funders had no role in the study design, data collection, analysis, or interpretation. The views expressed in this publication are those of the authors and not necessarily those of the funders, the NHS, the National Institute for Health Research, the Department of Health and Social Care or its arm’s length bodies, and other Government Departments.
Authors’contributions
All authors collaborated in designing the study. GJH and EC coordinated the study, intervention procedures and data collection. MP performed the data analyses. GJH drafted the manuscript, with EC, MP, SAJ, RP, MV and TMM providing critical revisions to the manuscript. All authors read and approved the final manuscript.
Ethics approval
Approved by the Psychology Research Ethics Committee of the University of Cambridge (Reference Number: PRE.2016.035).
Consent for publication
Not applicable.
Competing interests
The authors declare that they have no competing interests.
Publisher’s Note
Springer Nature remains neutral with regard to jurisdictional claims in published maps and institutional affiliations.
Author details
1Behaviour and Health Research Unit, University of Cambridge, Cambridge, UK.2Nuffield Department of Primary Care Health Sciences, University of Oxford, Oxford, UK.
Received: 28 March 2018 Accepted: 23 July 2018
References
1. Gakidou E, Afshin A, Abajobir AA, Abate KH, Abbafati C, Abbas KM, Abd-Allah F, Abdulle AM, Abera SF, Aboyans V, et al. Global, regional, and national comparative risk assessment of 84 behavioural, environmental and occupational, and metabolic risks or clusters of risks, 1990-2016: a systematic analysis for the global burden of disease study 2016. Lancet. 2017;390:1345–422.
2. Naghavi M, Abajobir AA, Abbafati C, Abbas KM, Abd-Allah F, Abera SF, Aboyans V, Adetokunboh O, Afshin A, Agrawal A, et al. Global, regional, and national age-sex specific mortality for 264 causes of death, 1980-2016: a systematic analysis for the global burden of disease study 2016. Lancet. 2017;390:1151–210.
3. Cohen DA, Lesser LI. Obesity prevention at the point of purchase. Obes Rev. 2016;17:389–96.
4. Hollands GJ, Marteau TM, Fletcher PC. Non-conscious processes in changing health-related behaviour: a conceptual analysis and framework. Health Psychol Rev. 2016;10:381–94.
5. Marteau TM, Hollands GJ, Fletcher PC. Changing human behavior to prevent disease: the importance of targeting automatic processes. Science. 2012;337:1492–5.
6. Hollands GJ, Shemilt I, Marteau TM, Jebb SA, Kelly MP, Nakamura R, Suhrcke M, Ogilvie D. Altering micro-environments to change population health behaviour: towards an evidence base for choice architecture interventions. BMC Public Health. 2013;13:1218.
7. Hollands GJ, Bignardi G, Johnston M, Kelly MP, Ogilvie D, Petticrew M, Prestwich A, Shemilt I, Sutton S, Marteau TM. The TIPPME intervention typology for changing environments to change behaviour. Nature Human Behaviour. 2017;1:0140.
8. Stok FM, Hoffmann S, Volkert D, Boeing H, Ensenauer R, Stelmach-Mardas M, Kiesswetter E, Weber A, Rohm H, Lien N, et al. The DONE framework: Creation, evaluation, and updating of an interdisciplinary, dynamic framework 2.0 of determinants of nutrition and eating. PLoS One. 2017;12:e0171077.
9. Swinburn BA, Sacks G, Hall KD, McPherson K, Finegood DT, Moodie ML, Gortmaker SL. The global obesity pandemic: shaped by global drivers and local environments. Lancet. 2011;378:804–14.
10. NHS Choices: Boost your health at work.http://www.nhs.uk/Livewell/ workplacehealth/Pages/workplaceoverview.aspx. Accessed 21st February 2018. 11. Hollands GJ, Shemilt I, Marteau TM, Jebb SA, Lewis HB, Wei Y, Higgins J,
Ogilvie D. Portion, package or tableware size for changing selection and consumption of food, alcohol and tobacco. Cochrane Database Syst Rev. 2015:CD011045.
12. Zlatevska N, Dubelaar C, Holden SS. Sizing up the effect of portion size on consumption: a meta-analytic review. J Mark. 2014;78:140–54.
13. Steenhuis IH, Vermeer WM. Portion size: review and framework for interventions. Int J Behav Nutr Phys Act. 2009;6:58.
14. Steenhuis I, Poelman M. Portion size: latest developments and interventions. Curr Obes Rep. 2017;6:10–7.
15. Allan J, Querstret D, Banas K, de Bruin M. Environmental interventions for altering eating behaviours of employees in the workplace: a systematic review. Obes Rev. 2017;18:214–26.
16. Brehm BJ, Gates DM, Singler M, Succop PA, D'Alessio DA. Environmental changes to control obesity: a randomized controlled trial in manufacturing companies. Am J Health Promot. 2011;25:334–40.
17. Diliberti N, Bordi PL, Conklin MT, Roe LS, Rolls BJ. Increased portion size leads to increased energy intake in a restaurant meal. Obes Res. 2004; 12:562–8.
18. Freedman MR, Brochado C. Reducing portion size reduces food intake and plate waste. Obesity. 2010;18:1864–6.
19. Vermeer WM, Steenhuis IHM, Leeuwis FH, Heymans MW, Seidell JC. Small portion sizes in worksite cafeterias: do they help consumers to reduce their food intake? Int J Obes. 2011;35:1200.
20. Vermeer WM, Leeuwis FH, Koprulu S, Zouitni O, Seidell JC, Steenhuis IHM. The process evaluation of two interventions aimed at portion size in worksite cafeterias. J Hum Nutr Diet. 2012;25:180–8.
22. Reinders MJ, Huitink M, Dijkstra SC, Maaskant AJ, Heijnen J. Menu-engineering in restaurants - adapting portion sizes on plates to enhance vegetable consumption: a real-life experiment. Int J Behav Nutr Phys Act. 2017;14:41.
23. Petrescu DC, Hollands GJ, Couturier D-L, Ng Y-L, Marteau TM. Public acceptability in the UK and USA of nudging to reduce obesity: the example of reducing sugar-sweetened beverages consumption. PLoS One. 2016;11: e0155995.
24. Vermeer WM, Steenhuis IHM, Seidell JC. Portion size: a qualitative study of consumers’attitudes toward point-of-purchase interventions aimed at portion size. Health Educ Res. 2010;25:109–20.
25. Vasiljevic M, Cartwright E, Pechey R, Hollands GJ, Couturier D-L, Jebb SA, Marteau TM. Physical micro-environment interventions for healthier eating in the workplace: protocol for a stepped wedge randomised controlled pilot trial. Pilot and Feasibility Studies. 2017;3:27.
26. Vasiljevic M, Cartwright E, Pilling M, Lee M-M, Bignardi G, Pechey R, Hollands GJ, Jebb SA, Marteau TM. Impact of calorie labelling in worksite cafeterias: a stepped wedge randomised controlled pilot trial. Int J Behav Nutr Phys Act. 2018;15:41.
27. Bates D, Maechler M, Bolker B, Walker S. Fitting linear mixed-effects models using lme4. J Stat Softw. 2015;67:1–48.
28. Halekoh U, Højsgaard S. A Kenward-Roger approximation and parametric bootstrap methods for tests in linear mixed models - the R package pbkrtest. J Stat Softw. 2014;59:1–30.
29. Zlatevska N, Neumann N, Dubelaar C. Mandatory calorie disclosure: a comprehensive analysis of its effect on consumers and retailers. J Retail. 2018;94:89–101.
30. Rutter H, Savona N, Glonti K, Bibby J, Cummins S, Finegood DT, Greaves F, Harper L, Hawe P, Moore L, et al. The need for a complex systems model of evidence for public health. Lancet. 2017;390:2602–4.
31. Pomeranz JL, Brownell KD. Can government regulate portion sizes? N Engl J Med. 2014;371:1956–8.
32. Marteau TM, Hollands GJ, Shemilt I, Jebb SA. Downsizing: policy options to reduce portion sizes to help tackle obesity. BMJ. 2015;351
33. Vermeer WM, Steenhuis IHM, Seidell JC. From the point-of-purchase perspective: a qualitative study of the feasibility of interventions aimed at portion-size. Health Policy. 2009;90:73–80.