Ph.D Dissertation
UNIVERSITY OF TRENTO
Doctoral School in Mathematics
Human behaviour
in epidemic modelling
Piero Poletti
Advisor:
Prof. Andrea Pugliese
Co-Advisor:
Dr. Stefano Merler
Contents
1 Introduction 5
1.1 Human behavior in response to epidemics . . . 5
1.2 State of Art . . . 7
1.2.1 Spontaneous social distancing during an epidemic outbreak . . . 7
1.2.2 Vaccination choices in not compulsory vaccination program . . . . 8
1.3 Innovative aspects . . . 10
1.3.1 Spontaneous social distancing . . . 11
1.3.2 Vaccination choices . . . 12
1.4 Structure of the Thesis . . . 12
2 Spontaneous behavioral response to an epidemic outbreak 15 2.1 Introduction . . . 15
2.2 The Model . . . 16
2.3 Study of Dynamics . . . 19
2.4 Discussion . . . 28
3 Effectiveness of spontaneous social distancing and risk perception 31 3.1 Introduction . . . 31
3.2 The model . . . 32
3.3 Reproductive number and model parametrization . . . 34
3.4 Results . . . 36
3.5 Discussion . . . 42
4 The effect of risk perception on the 2009 H1N1 pandemic influenza dyanmics 45 4.1 Introduction . . . 45
4.2 Materials and Methods . . . 46
4.2.1 Data description . . . 46
4.2.2 The model . . . 46
4.3 Results . . . 48
5 Optimal vaccination choice, (static) vaccination games, and rational
ex-emption 55
5.1 Introduction . . . 55
5.2 A simple model of optimal family behavior without strategic interaction . . 57
5.2.1 The case of informed families . . . 58
5.2.2 Not fully-informed families . . . 60
5.2.3 Only a fraction of the population is eligible . . . 62
5.3 Implications of strategic behavior: the game-theoretic approach . . . 62
5.3.1 A preliminary: the critical elimination line for multigroup popula-tions . . . 62
5.3.2 The vaccination game . . . 63
5.3.3 The basic strategic competition . . . 65
5.3.4 The Stackelberg case with anti-vaccinators leadership . . . 69
5.3.5 The social planner case . . . 70
5.4 Discussion: can we get off the no-elimination trap? . . . 73
6 The impact of vaccine side effects on the natural history of immunization programs: an imitation-game approach 75 6.1 Introduction . . . 75
6.2 Materials and Methods . . . 76
6.2.1 Dynamic vaccine demand and vaccine side effects . . . 76
6.2.2 The importance of time delays . . . 78
6.3 Results . . . 79
6.3.1 Endemic equilibria and their stability . . . 79
6.3.2 Analysis of selected subcases . . . 81
6.4 Substantive implications of vaccine side effects for vaccination programmes 82 6.4.1 The epidemiological transition and vaccination payoff . . . 82
6.4.2 Simulations . . . 83
6.5 Concluding remarks . . . 88
7 Conclusion 91 8 Appendix 97 8.1 Appendix A . . . 97
8.1.1 Proofs . . . 97
8.2 Appendix B . . . 101
8.2.1 The model . . . 101
8.2.2 Sensitivity analysis . . . 104
8.2.3 Alert time . . . 109
8.2.4 Analysis of past influenza seasons . . . 109
8.2.5 Analysis of epidemiological and virological surveillance data . . . . 112
8.3 Appendix C . . . 114
Chapter 1
Introduction
1.1
Human behavior in response to epidemics
Mathematical models represent a powerful tool for investigating human infection dis-eases, providing useful predictions about the potential transmissibility of a disease and the effectiveness of possible control measures.
As well known, the characteristics of the pathogen responsible for the infections [6, 19] play a central role in the spread of an infectious disease. Nonetheless, one of the most central aspects of the human infection dynamics is the heterogeneity in behavioral patters adopted by the host population. Actually, the role played by human mobility patterns [84, 38, 151, 11, 112], the sociodemographic structure of the population [112] and intervention measures [6, 92] has been deeply investigated.
However, changes in human behaviors caused by the reaction to the disease can play a crucial role as well [56, 52]. Beyond behavioral changes imposed by public authorities, human behavioral changes can be triggered by uncoordinated responses driven by risk perception and fear of diseases (eventually of unknown fatality). Indeed, some studies on recent outbreaks of infectious disease have shown that people are prone to reduce risky behaviors [144, 98, 90, 125].
While behavioral responses to the spread of a diseases have been frequently reported anecdotally, there has been relatively little systematic investigation into their nature and on how they can affect the spread of infectious diseases. Behavioral changes are sometimes cited in the interpretation of outbreak data to explain drops in the transmission rate [132, 121], yet rarely spontaneous behavioral changes are explicitly modeled and investigated.
Withspontaneous behavioral responseshere we define the changes in human behavioral patterns that involve personal decisions based on the available information about the disease or on individuals’ beliefs and attitudes. This phenomenon is completely different from scenarios where the public is expected to comply with recommendations or control measures imposed by institutions.
Common childhood diseases, such as chickenpox and measles, provide a suitable ex-ample of when personal decisions are relevant. In fact, the decision whether or not to vaccinate a child is ultimately a personal decision and thus it has a strong behavioral component. Similarly, it is reasonable that during a severe epidemic outbreak individuals try to reduce the number of potentially infectious contacts. The avoidance of crowded environments, usage of face masks, practice of better hygiene protocols and self-restriction in traveling represent examples of self-imposed measures that can remarkably affect the disease spread.
During the 1918 influenza pandemic people eventually stayed away from congregated places [40]. In 1995, a supposed outbreak of bubonic plague in Sura, India, caused widespread panic on hundreds of thousands of people remarkably changing their trav-eling patterns [24]. When the Severe Acute Respiratory Syndrome (SARS) emerged in 2003, the usage of face masks became widespread in affected areas [98], and many indi-viduals changed their traveling behavior [98, 58]. More recently, a high risk perception, possibly as a consequence of the exposure to a massive information campaign (media) on the risks of an emerging influenza pandemic, was detected during the 2009 H1N1 pan-demic influenza [90] and, despite the low fatality associated to the event [128], behavioral response apparently played a relevant role during the early stages of the pandemic as well [144]. On the other hand, it was observed an increase in protective behavior as the prevalence of the disease was increasing, for both measles [125] and HIV [2]. Finally, concerns about proclaimed risks of vaccines have probably driven a widespread refusal of vaccination, leading to drops in vaccine uptake. This was the case of pertussis in the 1970s [70] and more recently of measles-mumps-rubella (MMR) vaccine [89].
As a matter of fact, attitudes, belief systems, available information about the risk associated to a disease can change over time. The dynamics of these attributes is a rel-evant element to understand the impact of behavioral responses to a disease [68]. Thus, infection dynamics should be considered as a coupled dynamics where the transmission of the pathogen is driven by human behavior dynamics, and vice versa. The investigation of this complex interplay would be helpful for giving insight to public health policy makers, for planning public health control strategies (e.g., vaccination) and better estimating the burden for health care centers over time.
Two specific phenomena are discussed in this thesis. The first one is represented by vaccination choices during a not compulsory vaccination program for childhood diseases. The second one is represented by spontaneous social distancing during an emerging epi-demic outbreak.
infec-tion dynamics are very different in these two specific situainfec-tions. Vaccinainfec-tion may result in moving individuals directly from the susceptible compartment to the removed com-partment, i.e. those individuals that have developed immunity for the disease. On the other hand a reduced exposure to diseases, as a reaction to the presence of either the disease or certain beliefs about the disease, could be modeled either as a reduction in the number of contacts (e.g., reduced travel behavior), or as a reduction of intensity of contacts (e.g., usage of face mask). Thus models dealing with spontaneous social distanc-ing, usually, assume a change in parameters (mainly the transmission rate or the recovery rate) or changes in population structure. Moreover, unless one considers vaccines that require boosting at regular intervals because of waning immunity or because of pathogen evolution ( e.g. seasonal influenza), the decision to vaccinate is usually not reversible. On the opposite, social distancing triggered by risk perception, may depend on the dynamics of the risk of infection.
1.2
State of Art
There are various ways to model behavioral changes over time. Different assumption can be made not only on the effect of behavioral changes on the epidemic dynamics, but also on source and type of available information and the way the information spreads in the population. In addition, more sophisticated models can explicitly include spatial or contact network structure. In this case behavioral response to epidemics can change in the network structure as well.
1.2.1
Spontaneous social distancing during an epidemic
out-break
A number of studies have considered extensions of the simple SIR model in which the incidence rate is not bilinear in susceptible and infective individuals, but is modeled through a more general function, to include effects of saturation. Basically, the assumption is that, in the presence of a very large number of infective individuals, the population may tend to reduce the number of contacts per time [25]. These models have been shown to yield rich complex dynamics [101, 100], but human behavior and its dynamics are not explicitly modeled in order to account for a specific reaction to the disease [68].
Arguably, also behavioral response which affects the disease transmission can spread among individuals. Recently a class of models accounting for such phenomenon has been proposed. Such models share the idea that the spread of responsiveness is driven by the diffusion of fear, which can be modeled as a parallel infection [147, 42, 53, 93, 67, 66].
and death. In general, the impact on disease dynamics can be quite remarkable if protec-tive behavior is triggered by fear or awareness of a disease spread. In [53] it is assumed that people remove themselves from the circulation of a disease completely when they are affected by fear from the epidemic; in this case the modeled infection dynamics can lead to multiple epidemic waves as a consequence of the subsequent return into circulation of the individuals, as fear decreases [53]. In [93], it is assumed that individuals avoid infection or seek treatment earlier as they become aware of a disease; as a consequence, the diffusion of health information can reduce the prevalence of infection. In [42], behavioral responses can produce a reduction in both the basic reproductive number of the disease and the final epidemic size as a consequence of people entering a class of low activity at a given rate depending on the prevalence of a disease.
As for models involving more complex structures, if susceptibility of individuals is reduced as a direct consequence of having infectious contacts in a social network, it has been shown that a disease can be brought to extinction when self-protection is strong enough [9]. Moreover, it was shown that behavioral response results particularly effective when the network of information spread overlaps with the contact network of disease transmission [67, 66].
The behavior of infected individuals has also been considered in several works [77, 141, 167]. The underlying idea is that individuals that develop symptoms alter their contact patters as a consequence of their sickness. More specifically, models based on contact network assume that individuals who stay at home or avoid infected peers can be seen as cutting links of possible contagion. For instance, in [77, 141, 167], it was assumed that healthy individuals completely remove contacts with infected peers (eventually re-connecting them with the rest of the population). However, changing network structure removing only existing link is often unrealistic (e.g., it could be “realistic” only in the specific context of sexually transmitted diseases). The effect of cutting links of possible contagion is very similar to a reduction in the transmission rate [68].
1.2.2
Vaccination choices in not compulsory vaccination
pro-gram
Vaccination policies of a large number of countries are based on voluntary compliance [68]. Some recent outbreaks of vaccine preventable diseases occurred in groups opposing vaccination on ideological grounds [79] or in communities beyond the reach of health care authorities [35]. Although forms of exemption to vaccination have always existed [139], the natural historyof vaccination programs has always been pervaded by a high degree of optimism [29]. However, this optimistic view has increasingly been challenged in recent years. Indeed, concerns about proclaimed risks of vaccines can produce widespread refusal of vaccination and consequent drops in vaccine uptake.
hand, the high degree of herd immunity achieved by decades of successful immunization programs has reduced the incidence of many infections to negligible levels. On the other hand, the large, and increasing, number of vaccines routinely administered every year yields steady flows of vaccine-associated side effects [160, 159]. In the US approximately 30,000 reports of Vaccine Adverse Events are notified annually, with 10–15% classified as serious [62]. In such circumstances the perception of the public will likely rank the per-ceived risk of suffering avaccine side effect(VSE) as much higher than the corresponding risk of infection.
A common example is poliomyelitis in industrialized countries. In Italy during 1980-2000 the number of vaccine-induced polio cases was three times higher than wild polio cases [43]. In addition, it is well known that there can be a significant imbalance between perceived and real risk. An example of misperception of risk is the belief that the MMR vaccine can cause autism [120, 146]. In fact, such belief has spread widely despite the overwhelming evidences that reject such a causality [146].
Drops in vaccination coverage have led to increased interest in so-called rational vac-cination decisions and their effects on the epidemiology of vaccine preventable infectious diseases. Many epidemiological modelers have turned to game theory and focused on the dilemma introduced by voluntary vaccination.
The “free riding” problem and the rational exemption in vaccination
Under voluntary vaccination high degrees of herd immunity might incentives vaccination
free riding [145, 23, 131].
The name “free rider” comes from a historical example for public transportation: people using a bus without paying the fare are free riders. The free rider problem raises when too many individuals becomes free riders and thereby the system has not enough money to operate. Herd immunity consists in the indirect protection for unvaccinated individuals provided by vaccinated individuals, as the latter will not contract and transmit the disease. The notion of free riding in vaccination means that, if vaccination is perceived to come with risk or side-effects, the better strategy can appear not vaccinating, thus avoiding any risk of vaccine side effects, while relying on the rest of the population to keep the coverage high enough to provide herd immunity.
Therational exemption, as defined in [48, 108], represents the parents’ decision not to immunize children after a seemingly “rational” comparison between the perceived utility of vaccination, i.e. protection from the risk of infection – perceived as very low as a consequence of the high herd immunity due to decades of successful vaccination policies – with its disutility, i.e. the risk of vaccine associated side effects. Actually, a behavior, resulting from the optimization performed by rational agents, might well turn out to be
provided the first game-theoretic proof of the elimination impossible result, and various implications of rational exemption. These implications suggest potential difficulties for global eradication plans, both at the national and international level [13, 55].
The game theoretical approach
When vaccination decisions are investigated using the game theory framework, it can be shown that the vaccination level attained from individuals acting only in their best self-interest is always below the optimal for the community. This result implies that it is impossible to eradicate a disease under voluntary vaccination [17, 15, 16, 29, 48, 23, 61, 48, 47, 49, 45, 131, 69, 129, 69, 72].
Moreover, models based on game theory have shown that the coupled dynamics of vac-cination coverage and disease prevalence can lead to oscillations with outbreaks following upsurges in vaccination coverage and subsequent epidemic troughs. Such results comes from the assumption that vaccination decisions are made by imitating other individuals at a rate depending on the individual benefit [15, 131]. Actually, similar results have also been found by assuming that decisions are based on past prevalence of a disease (e.g. by considering time delays and memory mechanisms [131, 150, 48, 49, 22, 45]).
Works focusing on influenza [69] and on human papillomavirus (HPV) [14], in which the model is parametrized using the results of population surveys, confirmed the problem that, with individuals acting rationally according to their perceived risk, the population does not achieve vaccination levels that minimize disease prevalence in the population. Moreover, a similar approach (leading to similar results) has been applied to the study of vaccination against smallpox to prepare for bioterrorism [17], to childhood diseases [16, 48, 49], to seasonal influenza [150] and to yellow fever [34].
However, it was recently suggested that elimination might become possible when more realistic contact network structures are considered [124]. Specifically, in [124] it has been shown that voluntary ring-vaccination of individuals can reduce local outbreaks if contacts are sufficiently local and the response is fast enough.
Beyond investigations based on game theory framework, models have recently been proposed to base vaccination behavior on the spread of opinions in a social neighborhood rather than assuming individual rational behavior. In that case, it was shown that clusters of unvaccinated individuals can make outbreaks more likely to occur [138, 50].
1.3
Innovative aspects
1.3.1
Spontaneous social distancing
While the game theoretical approach has been shared by many modelers for investigating the problem of vaccination choices, to the best of my knowledge, no efforts, but for a very recent ones [130], were developed for investigating spontaneous social distancing during an outbreak by using this framework. Moreover, still few works, e.g. [15], deal with the evolutionary game theory framework, instead of considering classic and static games. The approach of considering dynamical games allows to explicitly model the coupled dynamics of disease transmission and behavioral changes based on the risk perception.
Actually, most models accounting for spontaneous social distancing, assume a priori human response to the infection or consider only the behavioral response induced by the diffusion of fear, which is modeled as a parallel infection [42, 147, 53, 93, 67, 66]. However, an alternative mechanisms can contribute to the diffusion of responsiveness in a population. In fact, information diffusion may also spread through person to person contacts and can be modeled as an imitation process in which the convenience of different behaviors depends on the perceived risk of infection [9, 52].
Other novelties introduced in this thesis consist in considering: (i) asymptomatic in-fective individuals’ behavior in response to the risk of infection; (ii) the effect of risk misperception;(iii) time delays and memory mechanisms in the risk perception of infec-tion;
An innovative, in my opinion, aspect of this thesis is the investigation of an actual epidemic through a theoretical model explicitly considering human behavior. Indeed, the application to the 2009 H1N1 pandemic influenza may represent a further step to empirically assess quantitative and qualitative effects of spontaneous human response to perceived risk of infection.
Actually, most modeling efforts undertaken so far to study the impact of human be-havior on the spread of infectious diseases are based on anecdotal evidence and common sense. Such models are almost never validated against quantifiable observations. Undeni-ably, a lot of data would be needed for model validation and parametrization. Recently, in order to answer questions like “where people obtain their information from”, “which of information available to them they trust”, “if and how they act upon the information” and “how-effective this reaction is”, several surveys have been performed [98, 90, 82, 39]. However, even if many works share the insight on the effect of behavioral response on the epidemic spread, it is still difficult quantify human behavior with robust estimates [68]. Nonetheless, coupling the analysis of epidemiological data with drug purchase data, as discussed in chapter 4, could represent a promising solution.
1.3.2
Vaccination choices
Vaccination choices are investigated in chapters 5, 6 through different frameworks and as-sumptions, e.g. by considering families as representative agents and investigating different static and dynamic games.
Recent literature has highlighted that human perception of risk plays a central role in the dynamics of vaccination choices [17, 15, 16, 29, 48, 23, 61, 48, 47, 49, 45, 131, 69, 129, 69, 72], and thus strongly affects the chance of diseases’ elimination. As discussed in sec. 1.2, elimination of vaccine preventable diseases becomes a challenge when vaccine are perceived as risky. Actually, the mismatch between subjective and objective assessment of risk has been demonstrated experimentally [166] and some of the key factors contributing to this mismatch have been deeply investigated [65, 91].
One innovative aspect of proposed models is represented by considering misperception of risks induced by partial or incorrect information, both concerning the infection and vaccine side effects. Actually, the imbalance between perceived and real risk play a cen-tral role in determining the possibility of eliminating a vaccine preventable disease. For example, the investigation carried out in chapter 5 highlight that elimination turns out to be possible when individuals are not fully informed about herd immunity or about the existence of a critical vaccination coverage.
Other novelties introduced in this thesis consist in considering: (i) the case of hetero-geneous predisposition to vaccinate, assuming the population divided in groups that have different perceptions about risk of VSEs; (ii) nonlinear perceived costs of infection; (iii)
the possibility that the perceived costs of infection and vaccination are evaluated by the public using past values of state variables, for example due to information delay or of the perception of long-term vaccine side effects.
The model introduced in chapter 6 makes, in my opinion, useful contributions to the investigation of the problem of rational exemption. The main innovation is to model the perceived risk of vaccination as a function of the incidence of vaccine side effects. If available information on vaccine side effects is becoming the main driving force of vaccine demand, as strongly supported by empirical evidence [135], this work may represent an appropriate description of the future evolution of immunization programs in voluntary vaccination regimes.
1.4
Structure of the Thesis
In chapter 3, an extension of the model presented in chapter 2 is described. Both behavioral response performed by infected individuals and the effect of a memory mecha-nism in perception of risk are considered. The aim of this chapter is to investigate when and how the behavioral response affects the epidemic spread, clarifying the role of the key features describing human response. Moreover, scenarios accounting for the chance of delayed warning and behavioral responses triggered by the misperception of risk are analyzed.
In chapter 4, this approach is applied for investigating the specific case of the 2009 H1N1 pandemic influenza in Italy. The chapter is mainly focused on the analysis of real datasets. The hypothesis of an initial overestimation of risk by the host population is advanced, as a plausible explanation for the unusual and notable pattern observable in the ILI incidence reported to the national surveillance system. Such hypothesis is supported by empirical evidences, such as the temporal pattern of drug purchase and some (sporadic) reactive school closure (“self-imposed” by the scholastic board or suggested by local authorities).
Chapter 5, is devoted to the discussion of the problem of rational exemption in de-veloped countries, through a set of simple static models for vaccination behavior. Firstly the problem is investigated trough the hypothesis of representative agent and, secondly, considering game strategic interactions, including the Stackelberg competition and the analysis of Nash Equilibria. The case of partial information about the risk of an epi-demic is considered and the effect of heterogeneity in the perception of risks associated to vaccination is investigated as well.
In chapter 6, a transmission model with dynamic vaccine demand based on an imita-tion mechanism and with the perceived risk of vaccinaimita-tion modeled as a funcimita-tion of the incidence of VSEs is introduced. The analysis of the equilibria is performed and notewor-thy inferences as regards both the past and future lifetime of vaccination programs are drown.
Chapter 2
Spontaneous behavioral response to
an epidemic outbreak
2.1
Introduction
The epidemic dynamics depends on the complex interplay between the characteristics of the pathogens’ transmissibility and the structure and behaviour of the host population. Spontaneous change of behaviour in response to epidemics [56], possibly related to risk perception [9, 133, 141], has been recently proposed as a relevant factor in the compre-hension of infection dynamics. While the merits and influence of such phenomena are still debated [48, 117], experience from the 1918-19 pandemic indicates that a better un-derstanding of behavioural patterns is crucial to improve model realism and enhance the effectiveness of containment/mitigation policies [21].
Human behaviour is driven by evaluation of prospective outcomes deriving from alter-native decisions and cost-benefit considerations. Past experience, response to the action of others and changes in exogenous conditions all contribute to the balance, to which game theory provides a rich and natural modelling framework [154, 81]. It is not surpris-ing, therefore, that looking at behaviours through the lens of game theory has recently attracted the attention of the epidemiology community, for example when modelling the evolution over time of voluntary vaccination uptakes [16, 15].
In this paper we model a fairly general situation in which a population of individuals is subject to an epidemic outbreak developing according to an SIR model, but in which contact rates depend on the behavioural patterns adopted across the population. More specifically, all susceptible individuals can conform to either one or the other of two different behaviours,baandbn, respectively corresponding to an “altered” and a “normal”
behavioural pattern. The first gives the individuals an advantage in terms of reduced risk of infection, yet at some extra cost. For example, avoidance of crowded environments reduces the risk of infection, but also entails disadvantages deriving from greater isolation. Individuals adopting the second (bn) are exposed to a normal risk of infection, but are
spared the extra cost associated withba. Individuals may choose to switch betweenba and
The resulting model consists in the coupling of two dynamical systems, one describing the epidemic transmission and the other describing the behavioural changes. In principle, there is no reason for the two phenomena to evolve at the same speed. It is therefore crucial to study the model allowing for different time–scales, embodied in different time-units.
We give a full description of the model when the dynamics of the behavioural changes are “fast” with respect to the epidemic transmission. In particular, we provide sufficient conditions on the parameters for generating sequences of epidemic waves. Moreover, we show that the model is able to account for “asymmetric waves”, i.e., infection waves whose rising and decaying phases differ in slope. However, similar patterns can also be observed when the time–scales of the two dynamics are comparable. When the dynamic of behavioural changes is “slow”, the model basically reduces to a classical SIR.
The model’s dynamics gives rise to patterns that are morphologically compatible with multiple outbreaks and the same-wave asymmetric slopes recently reported for the Spanish influenza of the 1918–19 [32, 31, 58, 115]. For these phenomena (trivially incompatible with the classical SIR model) a variety of alternative explanations have in fact been advanced: military demobilization at the end of the First World War [58], genetic variation of the influenza virus [26, 7, 20], exogenous time changes in transmission rates, such as seasonal forcing [38, 37]. Other explanations have been proposed invoking coinfection scenarios [111, 1, 51, 114]
Finally, and regardless of the relative speeds of dynamics, we show that the fraction of susceptible individuals at the end of the epidemic is always larger than that of a classical SIR model in which all individuals adopt the normal behaviour (bn) with the
same parameters.
2.2
The Model
Our model consists of the coupling of two mutually influencing phenomena: a) the epi-demic transitions; b) the behavioural changes in the population of susceptible individuals. As for the epidemic transitions, whose time unit ist, our model is based on anS →I → R scheme1. We consider that susceptible individuals may adopt two mutually exclusive behaviours, bn (“normal”) and ba (“altered”). Specifically, we assume that individuals
adopting behaviour ba are able to reduce the number of contacts in the time unit with
respect to individuals adopting behaviourbn. Thus, two transmission rates are considered
for the two groups, accounting for the different contact rates associated with behaviours
ba and bn. In particular, susceptible individuals adopting behaviour bn, Sn(t), become
infected at a rateβnI(t) (and thus ˙Sn(t) =−βnSn(t)I(t)), whereI(t) represents the pool of
infectious individuals, while susceptible individuals adopting behaviour ba,Sa(t), become
infected at a rate βaI(t) (and thus ˙Sa(t) = −βaSa(t)I(t)), with βa < βn. Introducing
the variables S(t) = Sa(t) +Sn(t) and x(t) =Sn(t)/(Sn(t) +Sa(t)), corresponding to the
1Since we model single epidemic outbreaks, the vital dynamics of the population is not taken into
whole susceptible population and to the fraction of susceptibles adopting behaviour bn
respectively, the epidemic model can be written as:
dS
dt(t) = −[βnS(t)x(t) +βaS(t)(1−x(t))]I(t) dI
dt(t) = [βnS(t)x(t) +βaS(t)(1−x(t))]I(t)−γI(t) dR
dt (t) = γI(t) dx
dt(t) = x(t)(1−x(t))(βa−βn)I(t) .
(2.1)
Notice that the last equation describes the change of behaviours distribution in sus-ceptible individuals deriving from the different rates of infection, βn and βa.
We now allow susceptible individuals to change their behaviour spontaneously, follow-ing cost/benefit considerations. This phenomenon can be cast in the language of evo-lutionary game theory, in which behaviours correspond to strategies in a suitable game, with certain expected payoffs. Adopting ba reduces the risk of infection, but it is more
costly. On the other hand, individuals adopting bn are exposed to a higher risk of
infec-tion. It is clear that whether it is more convenient to adopt the first behaviour or the second depends on the state of the epidemic.
Of course, the two phenomena may not have the same time scales. In fact, while epidemic transmission can occur only through person-to-person contacts, it is fairly rea-sonable to consider that individuals can access the information required to decide whether to adopt either bn orba, much more frequently by telephone, email, the Internet and, in
general, the media.
Let us therefore introduceτ as the time unit of behavioural changes, and let us assume that t=ατ with α >0.
Payoffs can now be modelled as it follows. All individuals pay a cost for the risk of infection, which we assume depends linearly on the fraction of infected individuals,
I(τ), and it is higher for bn than for ba. Moreover, individuals playing ba pay an extra,
fixed cost k. It may be convenient to think of k as deriving from reducing the contacts with people, and therefore less traveling, working, attending school, visiting friends and relatives, etc.. Yet, it is more general than that, as it can account, in fact, for the cost of any self-imposable prophylactic measure. The payoffs associated withbn and ba are:
pn(τ) = −mnI(τ)
pa(τ) = −k−maI(τ) ,
(2.2)
withmn > ma. We may think ofmnandmaas parameters related to the risk of developing
symptoms (especially for the lethal infections) induced by the two different behavioursbn
The dynamics of behaviours is modelled as a selection dynamics based on imitation (Imitation Dynamics [81, 122]). A fraction of the individuals playing strategy bn can
switch to strategy ba after having compared the payoffs of the two strategies, at a rate
proportional to the difference between payoffs, ∆P(τ) =pn(τ)−pa(τ), with
proportion-ality constant ρ. Conversely for the fraction of the individuals playing ba.
The last equation of system (2.1), in the time scale of infection transmission, thus becomes:
(2.3)
dx
dt(t) = x(t)(1−x(t))(βa−βn)I(t)+
+ ρ
αx(t)(1−x(t))(k−(mn−ma)I(t)).
Notice that the first component of the time derivative of x(t) is negative, meaning that the fraction of susceptible individuals adopting the normal beahviour bn can only
decrease over time as an effect of theselection of behaviours induced by the epidemic. On the other hand, whenever bn is more convenient than ba (pn(t) > pa(t)), the fraction in
the population of susceptibles playing bn can grow.
Let us briefly comment on the second component of the time derivative of x(t). In principle, since the number of susceptible individuals decreases over time, one can argue that spontaneous changes of behaviour must depend explicitly on S(t), because of the diminished number of contacts among susceptible individuals. However, here we assume that susceptible individuals take their decision on the basis of the composition of the pool of susceptible individuals that they are able to meet somehow (by looking only at the fractions of susceptible individuals adopting the two behaviours bn and ba, without
considering the size of the sample).
It is worth noticing thatx= 0 andx= 1 are equilibria for Eq. (8.7). This in particular implies that there is no way to switch to a different strategy (independently of whether it would be convenient) unless there is a non zero fraction of individuals already playing it. To circumvent this (which one may regard as an undesirable effect of strict imitation),
irrational behaviour can be introduced which allows for rare (in τ time units) random switches of behaviour independent of encounters. Assuming a constant rate, χ >0, equal for both behaviours, the resulting equation for x is:
(2.4)
dx
dt(t) = x(t)(1−x(t))(βa−βn)I(t)+
+ ρ
αx(t)(1−x(t))(k−(mn−ma)I(t))+
+ χ
α(1−x(t))− χ αx(t) .
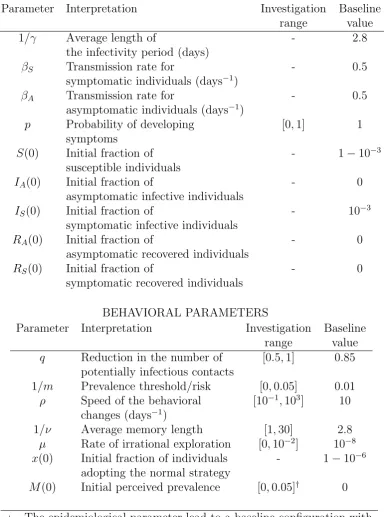
tran-Table 2.1: Model variables and parameters
Notation Description
S Fraction of susceptible individuals
I Fraction of infectious individuals
R Fraction of recovered individuals
x Fraction of susceptibles individuals adopting the “normal” behaviour
βn Transmission rate of individuals adopting the “normal”
behaviour
βa Transmission rate of individuals adopting the “altered”
behaviour
γ Recovery rate
1/m Threshold value determining the switch between “normal” and “altered” behaviour
µ Irrational behaviour rate
Relative speed of SIR dynamics and behavioural response
sitions) is given by:
dS
dt(t) = −[βnS(t)x(t) +βaS(t)(1−x(t))]I(t) dI
dt(t) = [βnS(t)x(t) +βaS(t)(1−x(t))]I(t)−γI(t) dR
dt (t) = γI(t) dx
dt(t) = x(t)(1−x(t))(1−mI(t)) +µ(1−2x(t)) .
(2.5)
where = α
kρ, m = (mn−ma)/k+(βn−βa) and µ = χ
kρ. As for the constraints
on the models parameters, we have: 0 < βa < βn, 0 < γ < βn2, > 0, m > (βn−βa)
and µ > 0. For facilitating the reader’s understanding, the definitions of the variables recurring throughout the paper are reported in Tab. 2.1.
2.3
Study of Dynamics
System (2.5) admits the disease free equilibrium (S, I, R, x) = (1,0,0, x?)3, with
(2.6) x? = 1−2µ+
p
1 + 4µ2
2 ,
2This constraint is required only to ensure that the epidemic occurs (see Eq. 3.3).
which is unstable when βnx?+βa(1−x?)> γ. Thus, we assume that the initial values for
system (2.5) are the following: (S(0), I(0), R(0), x(0)) = (1−I0, I0,0, x?) withI0 close to
0. Note that 1/2< x? <1 and x? →1 whenµ→0. Moreover, this equilibrium is stable as long as R0 <1 where the basic reproductive number of system (2.5) is:
(2.7) R0 =
βnx?+βa(1−x?)
γ .
Let us introduce the basic quantities Rn
0 = βn/γ and Ra0 = βa/γ. We can rewrite
Eq. (3.3) asR0 =Rn0x?+Ra0(1−x?). The quantitiesR0nandRa0 are reproduction numbers
themselves: Rn
0 characterizes the situation where the susceptible pool is fully composed
by individuals adopting the normal behaviour bn, whereas R0a characterizes the situation
where the susceptible pool is fully composed by individuals spontaneously reducing their contacts (behaviour ba). Thus, Eq. (3.3) has a straightforward interpretation: a typical
infective individual behaving according to bn (a case occurring with probabilityx?) would
cause Rn0 new infections during his/her whole period of infectivity. Similarly for R0a in case he/she adopts the altered behaviour ba (which occurs with probability 1−x?). Note
that R0 'Rn0 for x? '1.
We start by analyzing the dynamics of system (2.5) in two extreme cases, namely
→ 0 and → +∞, which correspond respectively to the situation when the dynamics of the behavioural changes is “fast” or “slow” with respect to the epidemic transmission. Let us consider first the case → +∞. In this case, the solutions of system (2.5) approximate those of system (2.1), which is a classical SIR model with two classes of susceptibility. Since ˙x(t) <0, the fraction of individuals adopting the normal behaviour
bn will decrease over time as a consequence of the selection of the behaviour ba induced
by the epidemic, even in the absence of spontaneous behavioural changes.
For the case → 0 (which is more interesting from both the mathematical and the biological point of view) we are going to apply the singular perturbation methods [123].
The solutions of the singularly perturbed initial value problem (2.5) is approximated by that of the degenerate system:
dS
dt(t) = −[βnS(t)x(t) +βaS(t)(1−x(t))]I(t) dI
dt(t) = [βnS(t)x(t) +βaS(t)(1−x(t))]I(t)−γI(t) dR
dt (t) = γI(t)
0 = x(t)(1−x(t))(1−mI(t)) +µ(1−2x(t)) ,
(2.8)
(2.9) dx
ds(s) =x(s)(1−x(s))(1−mI) +µ(1−2x(s)),
obtained by making the transformation of independent variables=t/, and then setting
= 0 (which in particular implies thatS(s), I(s) and R(s) are constant) [148, 83]. Notice that, after having set = 0, parameter m reduces to (mn−ma)/k.
Conse-quently, as it may be expected, the effect of the selection of behaviours induced by the epidemic is negligible when the dynamics of behaviours is much faster than that of the infection transmission.
We start by analyzing the solutions of Eq. (2.9), where the fraction of infected indi-viduals I is assumed to be constant. Eq. (2.9) admits the following equilibrium:
x?(I) =
1−2P +√1 + 4P2
2 if I <1/m ⇐⇒ P >0 1−2P −√1 + 4P2
2 if I >1/m ⇐⇒ P <0 1
2 if I = 1/m ,
(2.10)
where P = 1−µmI, which is asymptotically stable (comparing Eq. (2.6), note that x? =
x?(0)). In conclusion, the following Proposition holds:
Proposition 2.3.1. The boundary–layer system (2.9) admits the asymptotically stable
equilibrium (2.10) and, independently on I, x?(I) → 1 if I < 1/m and x?(I) → 0 if
I >1/m when µ→0.
As regards the stability of the equilibrium (2.10), it is sufficient to observe that the equation of ˙x is a parabola (which reduces to a straight line whenI = 1/m) and that the sign of ˙x is positive forx < x?(I) and negative for x > x?(I).
The following Proposition characterizes the solutions of system (2.5) when the dynam-ics of the behavioural changes is fast with respect to that of the epidemic transmission and irrational behaviour rate is small.
Proposition 2.3.2. Under the assumptions Rn
0 > 1 and 1/m < Ip where Ip = 1−
1
Rn
0 +
1
Rn
0 log
1
Rn
0, if → 0 and µ = o(
k) with k ≥ 1, the solutions of system (2.5) are
characterized as follows:
S1 there exists a finite time t1 > 0 such that the solutions of system (2.5) approximate
those of a classical SIR model with R0 =Rn0 on the interval(0, t1)and I(t1) = 1/m;
S2.1 If Ra
0S(t1) ≤ 1, there exists a finite time t02 > t1 such that the solution of system
(2.5) can be approximated in the time interval(t1, t02), wheret02 =t1+mγ(S(t1)−R1n
0),
byS(t) =S(t1)−mγ(t−t1)andI(t) = 1/m. Afterwards, the solutions of system (2.5)
approximate those of a classical SIR model (in its decaying phase) with R0 =Rn0 on
t
1t
2t
2t
31
2.2
2.2.2
2.2.1
2.1
1/m
t
I
Figure 2.1: Possible temporal evolution of the fraction of infected individuals I. Regions above and below 1/m correspond to x?(I) → 0 and x?(I) → 1, respectively. In the two regions the solutions of system (2.5) approximate those of classical SIR models with basic reproductive numbers R0 =Ra0 and R0 =Rn0 respectively.
S2.2 If Ra
0S(t1) > 1 there exists a finite time t2 > t1 such that the solutions of system
(2.5)approximate those of a classical SIR model with R0 =Ra0 on the interval(t1, t2)
and I(t2) = 1/m;
S2.2.1 If Rn
0S(t2)>1 there exists a finite time t3 > t2 such that the solutions of system
(2.5) can be approximated in the time interval(t2, t3), wheret3 =t2+mγ(S(t2)−R1n
0),
byS(t) =S(t2)−mγ(t−t2)andI(t) = 1/m. Afterwards, the solutions of system (2.5)
approximate those of a classical SIR model (in its decaying phase) with R0 =Rn0 on
the interval (t3,+∞);
S2.2.2 If Rn0S(t2)≤1 the solutions of system (2.5) approximate those of a classical SIR
model (in its decaying phase) with R0 =R0n on the interval (t2,+∞).
Therefore, under the hypotheses of Prop. 2.3.2, solutions of system (2.5) can be classified in the three following types:
C1 Solution S1 in [0, t1) and S2.1 in [t1,+∞);
C2 Solution S1 in [0, t1), S2.2 in [t1, t2) and S2.2.1in [t2,+∞); C3 Solution S1 in [0, t1), S2.2 in [t1, t2) and S2.2.2in [t2,+∞).
The possible behaviours of the solutions of system (2.5), which depends on the values of Ra
Let us briefly comment on the hypotheses of Prop. 2.3.2. The condition Rn
0 > 1 is
the obvious threshold condition for an epidemic to occur. Ip = 1 − R1n
0 +
1
Rn
0 log
1
Rn
0 is
the fraction of infected individuals at the peak for the classical SIR model with basic reproductive number R0 = R0n (this can be easily established by considering that the
fraction of infected individuals at the peak is 1
R0 and by employing the SIR invariant
S(t) +I(t)−R1
0 logS(t) = const). Thus the condition 1/m < Ip imposes that behaviour
bastarts being convenient at some point before the epidemic reaches its peak. Basically, if
the condition is not satisfied, system (2.5) is of scarce interest since all individuals adopt the normal behaviour bn during the course of the epidemic; thus, system (2.5) would be
equivalent to a classical SIR model with basic reproductive numberR0 =R0n. No explicit
condition is needed on Ra
0. In particular, Ra0 can be less than 1 (which means that no
epidemic will occur if the susceptible pool is fully composed by individuals adopting the altered behaviour ba). Clearly, in this case the solutions of system (2.5) can only be of
typeC1.
Full proof of Prop. 2.3.2 is given in App 8.1.1. Here we only observe that whenI(t)<
1/m we have x?(I)→ 1 (see Prop. 2.3.1). Thus, the solutions of the degenerate system
(2.8), obtained by solving the system of differential equations after having substituted
x(t) = 1, are those of a classical SIR model with basic reproductive number R0 = Rn0.
The same happens when I(t) > 1/m, but now x?(I) → 0, which results in R
0 = Ra0.
Let us now assume that is close to 0. The time intervals in which I(t) ≈ 1/m (for solutions of type C1or C2) can be interpreted as time intervals in which the fraction of infected individualsI(t) is characterized by a sequence of “micro–waves”. In fact, as soon as I(t) > 1/m, x(t) gets close to 1, so that the effective reproductive number (Ra0S(t1)
for solutions of typeC1 and Ra
0S(t2) for solutions of type C2) is not sufficiently large to
sustain the epidemic and thusI(t) decreases below 1/m. However, as soon asI(t)<1/m,
x(t) gets close to 1, so that the effective reproductive number (Rn0S(t1) for solutions of
typeC1andRn
0S(t2) for solutions of typeC2) is sufficient to sustain the epidemic and thus
I(t) increases over 1/m. The process is repeated as long as the fraction of susceptible individuals in the population is sufficiently large (Rn0S(t) > 1). In the limit → 0, these switches are instantaneous, and the solution I(t) is approximately always equal to 1/m. Finally, as soon as Rn
0S(t) ≤ 1, the fraction of infected individuals I(t) will start
decreasing to 0 over time. In Prop. 2.3.3 we give sufficient conditions for solutions of type
C1orC2to occur, which in particular implies the presence of sequences of “micro–waves” for small value of .
Proposition 2.3.3. Under the assumptions Rn
0 >1 and 1/m < Ip, where Ip = 1−R1n
0
+
1
Rn
0 log
1
Rn
0, if → 0, µ = o(
k) with k > 1 and Ra
0 satisfies the inequalities 1 < Ra0 <
Rn0exp{−Ra0(1−1/Rn0)} then the solution of system (2.5) are of type C1 or C2.
First of all, we comment on the hypotheses of Prop. 2.3.3. Clearly, if Ra
0S(t1) ≤ 1
the solutions of system (2.5) can only be of type C1. Condition Ra0S(t1) > 1 (which in
particular impliesRa
0 >1) is thus required for solutions of typeC2to occur, in particular
to have that the fraction of susceptible individuals does not decrease too much in the time interval (t1, t2), where system (2.5) is equivalent to an SIR model with basic reproductive
number R0 =Ra0. In fact, if S(t) decreases so much that Rn0S(t2)<1, I(t) will decrease
again for t > t2, resulting in a solution of type C3. Full proof of Prop. 2.3.3 is given in
App. 8.1.1.
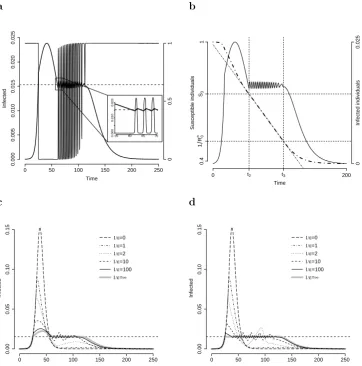
Prop. 2.3.3 guarantees that, under certain conditions, one (or more) epidemic waves will occur after the first when >0 is sufficiently small; here, a solution showing two (or more) epidemic waves is one for which ˙I(t) > 0 in two time intervals separated by one interval in which ˙I(t) < 0. A concrete example is shown in Fig. 2.2a. In this case, a sequence of small epidemic waves is observed fort > t2. In fact, as soon as the fraction of
infected individuals becomes larger than the threshold 1/m, the dynamics is the same as that of an SIR model withR0 =Ra0 for which there are not enough susceptible individuals
to sustain the epidemic. Thus, the fraction of infected individuals decreases below the threshold value (see the inset in Fig. 2.2a). A series of waves therefore follows, as long as
Rn0S(t) >1. Fig. 2.2b shows that, as stated in Prop. 2.3.2, S(t) decreases linearly while
I(t) undergoes this sequence of waves.
Convergence of the solutions of the singularly perturbed system (2.5) to those of the degenerate system (Eq. 2.8, = 0) for →0 is shown in Fig. 2.2c-d.
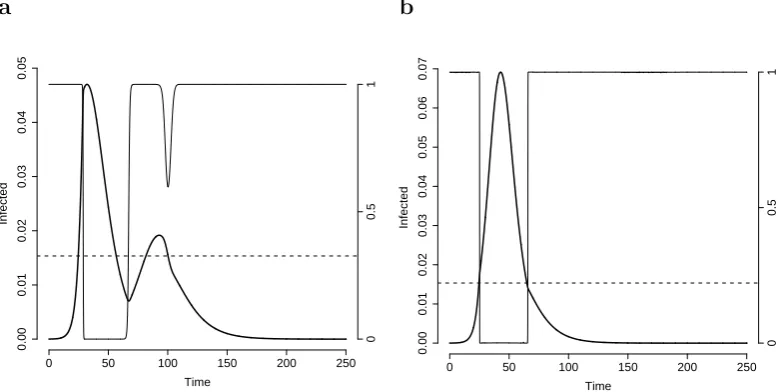
If we consider greater values of the parameter (about which proposition 2.3.3 does not say anything), the fraction of infected individuals reaches a higher peak, and thus the fraction of susceptible individuals decreases in the time interval (t1, t2) more than that of
a SIR model with R0 = Ra0. However, if Ra0 is not too large, the fraction of susceptible
individuals at time t = t2 can be sufficient to generate at least a second epidemic wave
(see Fig. 2.3a), that is now quite relevant in size.
As observed previously, if Ra0 is not sufficiently small (as required by Prop. 2.3.3) the fraction of susceptible individuals in the time interval (t1, t2) may decrease so much that
Rn
0S(t2)<1. In this case, no additional waves will be generated and only a change in the
slope during the decaying phase may be observed (see Fig. 2.3b).
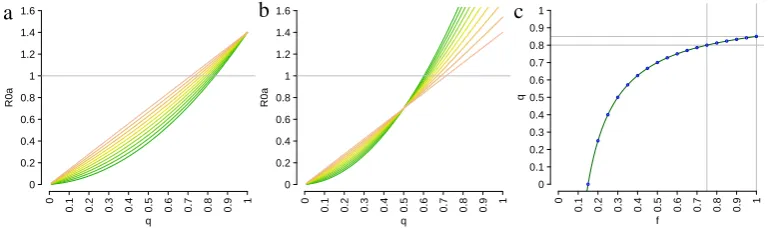
One may ask how large can be to give rise to a second epidemic wave of the type shown in Fig. 2.3a. Fig. 2.4a shows a numerical approximation to the minimum value,
−min1 , of 1/ giving rise to sequences of at least two epidemic waves, as a function of the threshold parameter m. In this respect, it should be observed that computing, given
m, the value of at which multiple waves start to occur is essentially equivalent to the problem of locating the zero (if it exists) of a one-variable monotonic function, within a suitable interval. It can be observed that −min1 decreases with m and −min1 & 0 as
m →+∞. Moreover,m has to be larger than the theoretical minimum m= 1/Ip (shown
as the dotted vertical line in Fig. 2.4a) in the assumptions of Prop. 2.3.2; indeed−min1 goes to ∞ (i.e. max goes to 0) as m→1/Ip.
The following Proposition shows that, independently of , the fraction of susceptible individuals at the end of an epidemic described by an SIR model with R0 =Rn0 is always
smaller than that obtained with model (2.5):
Proposition 2.3.4. S∞ > SSIR
∞ , where S∞SIR is the fraction of susceptible individuals at
a b
Time
Infected
0 50 100 150 200 250
0.000 0.005 0.010 0.015 0.020 0.025 0 0.5 1
55 60 65 70
0.000
0.010
0.020
Time
Susceptible individuals
0 t2 t3 200
0.4 1 R0 n S3 1 0 0.025 Infected individuals c d Time Infected
0 50 100 150 200 250
0.00 0.05 0.10 0.15 1/ε=0 1/ε=1 1/ε=2 1/ε=10 1/ε=100 1/ε=∞
Time
Infected
0 50 100 150 200 250
0.00 0.05 0.10 0.15 1/ε=0 1/ε=1 1/ε=2 1/ε=10 1/ε=100 1/ε=∞
Figure 2.2: aFraction of infected individuals (solid bold line, scale on the left) and fraction of individuals playing strategybn (solid tiny line, scale on the right) over time for system
(2.5). Parameters employed: βn = 0.6, γ = 0.3, βa = 0.35, = 3.33· 10−3, m = 65,
µ = 10−7. The dashed line represents the threshold value 1/m. b Fraction of infected
individuals (solid line, scale on the right) and susceptible individuals (bold dot-dashed line, scale on the left) in the same example as in panel a. We also plot the straight line
S(t) = S(t1)− mγ(t−t1) (tiny dot-dashed line, scale on the left)to show the linearity of
S(t) in [t2, t3] as predicted by Prop. 2.3.2. c Fraction of infected individuals vs. time for
different choices of the parameter(thin black lines) and the piecewise solution of system (2.5) (heavy gray line) as in Fig. 2.1; other parameters as in panela. d Like panel cbut with βa = 0.3; this implies Ra0S(t1)<1 so that the solution is of type C1.
S∞ is the fraction of susceptible individuals at the end of an epidemic described by system
(2.5).
a b
Time
Infected
0 50 100 150 200 250
0.00 0.01 0.02 0.03 0.04 0.05 0 0.5 1 Time Infected
0 50 100 150 200 250
0.00 0.01 0.02 0.03 0.04 0.05 0.06 0.07 0 0.5 1
Figure 2.3: Other possible behaviour of solutions of system (2.5). a As in Fig. 2.2a but with = 0.25. b As in Fig. 2.2a, but with βa = 0.45.
a b
m
1/ε
0 25 50 75 100 125 150
0 1 2 3 4 5 6 7 1/ε S∞
0 10−5 10−4 10−3 10−2 10−1 1 10 102 103
0.0 0.1 0.2 0.3 0.4 0.5 0.6
m=2 Ip
m=5 Ip
m=10 Ip
m=100 Ip
m=500 Ip
1 R0n
Figure 2.4: aThe minimum values of 1/giving rise to a sequence of at least two epidemic waves are plotted against m, for system (2.5). Parameters employed: βn = 0.6, γ = 0.3,
βa = 0.33, µ = 10−7. The vertical dotted line represents the value of m such that
m = 1/Ip. Notice that for such choice of parameters, the conditions of Prop. 2.3.3 are
satisfied, which implies that epidemic waves will occur for → 0. Notice how multiple waves can occur even for “slow” changes in behaviour (large values). bS∞ as a function of 1/for different choices ofmfor system (2.5). Parameters employed: βn = 0.6,γ = 0.3,
βa = 0.35, µ= 10−7.
Proposition 2.3.5. Under the assumptions Rn
0 > 1 and 1/m < Ip, where Ip = 1 −
1 Rn 0 + 1 Rn 0 log 1 Rn
0, in the limit → 0, µ= o(
k) with k ≥ 1, if Ra
a b
Days
Infected individuals
0 50 100 150 200
0
0.01
0.02
0.03
0.04
Days
Infected individuals
0 100 200 300 400
0
0.01
0.02
0.03
0.04
c d
Days
Infected individuals
0 50 100 150
0
0.003
0.006
0.009
0.012
Days
Infected individuals
0 50 100 150
0
0.01
0.02
0.03
0.04
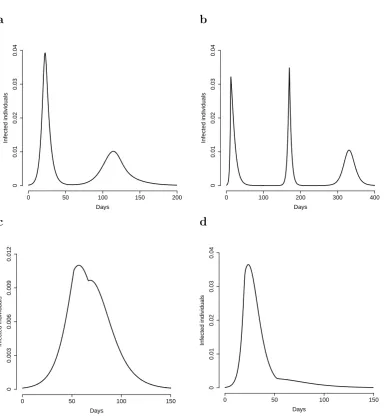
Figure 2.5: The model (2.5) accounts for interesting epidemic patterns: a Parameters employed: m = 150, βn = 0.8, βa = 0.4, γ = 0.5, µ = 0.01, = 10. b Parameters
employed: m = 300, βn = 1, βa = 0.48, γ = 0.5, µ = 10−10, = 2. c Parameters
employed: m = 100, βn = 0.6, βa = 0.54, γ = 0.5, µ = 10−5, = 0.01. d Parameters
employed: m= 100, βn= 0.8,βa= 0.6,γ = 0.5,µ= 10−5, = 1.
1< Ra0 < Rn0 exp{−Ra0(1−1/Rn0)}then the fraction of susceptible individuals at the end of the epidemic (S∞(m)) is an increasing function ofm andS∞(m)→1/Rn0 when1/m→0.
Proofs of Prop. 2.3.4 and 2.3.5 are in appendix 8.1.1. In Fig. 2.4b the values of S∞
are reported for increasing values of 1/ and for different choices of m. We can see that
S∞ is non monotonic in neither 1/nor in m. However, when 1/ is sufficiently large,S∞
increases by decreasing 1/m and S∞ → 1/Rn0 when 1/m → 0. For small values of 1/,
S∞ is equivalent to that obtained by employing a classical SIR model with R0 =Rn0.
of parameters, its solutions can exhibit some interesting patterns (unaccessible to any classical SIR model), that are morphologically compatible with the evolution of past pandemics. For example, two epidemic waves can be obtained (see Fig. 2.5a) in the same epidemic episode. However, more than two epidemic waves can be obtained (as it was in fact observed in the 1918-19 Spanish pandemic). Moreover, the peak daily attack rate of the sequence of waves is not necessarily decreasing over time (see Fig. 2.5b). Difference in slope in the decaying phase (reminiscent of those observed in the Fall wave of the 1918-19 Spanish pandemic in the UK) can also be captured by our model (see Fig. 2.5c and [33] for a brief discussion). Finally, very long decaying phases, making the epidemic curve strongly asymmetric, can also be obtained (see Fig. 2.5d).
2.4
Discussion
When studying the spread of epidemics, behaviour and contact patterns are typically considered “background” for the infection – i.e., they are not themselves variables of the dynamics. It is interesting, however, to address cases for which the population behaviour cannot be merely considered as an independent (though time-varying) parameter, but it is better modelled as a variable whose evolution influences, and is influenced by, the dynamics of the infection.
With the introduction of an explicit model for behavioural changes, infection and be-haviour both contribute to define the context for the other. Symmetry between these two key-factors is therefore restored, and no by-principle prevalence is given (even for-mally) to one over the other. Not only the dynamics of infection depends now on both the transmission and behaviour, but also the behaviour dynamics depends on behaviour (and infection as well). This is what makes evolutionary game theory especially suited to the case as compared to classical game theory. In fact, application of the latter would result in (rational) instantaneous best responses to the infection dynamics, regardless of the current distribution of behavioural strategies.
The model we propose is (deliberately) simple, and exhibits a transmission dynamics driven by an S →I →R scheme coupled with behavioural (contact) patterns driven by imitation dynamics. Still, we were able to prove that the model accounts for multiple waves occurring within the same outbreak, and is able to explain “asymmetric waves”, i.e., infection waves whose rising and decaying phases differ in slope. As an interesting feature, the attack rate for the model is always smaller than that of the equivalent SIR model (obtained by fixing x(t) = 1).
It should be observed that the model is based on two implicit, yet crucial assumptions: a) that the benefits of behavioral changes be immediately clear to the individuals; b) that individuals be able to recognize whether their contacts are susceptible, infective or removed (since susceptible individuals can change their behaviour only through encounters with other susceptible individuals). Consequently, our model applies better to severe epidemics, in which it is more likely that these requirements are actually met.
dy-namics of behavioural changes that we have adopted. In particular, the payoffs of the underlying game are modelled as the perceived risk of infection. Our choice was for a simple linear dependence from the fraction of currently infected individuals. Of course, a number of different options are available; for example one may tie the perception of risk to the number of new infections, or consider the actual probability of infection in place of perceived risk. Cumulation of risk over time could also be addressed by introducing appropriate memory mechanisms.
Independently of how the risk is specifically reckoned, the access to information per-taining the relative efficacy of behaviours may also be collected across more structured networks (e.g., the media). In this respect, considering different time units adds some flexibility to the model, in that it allows for different speeds in the diffusion of infection and behaviour. For example, tuning of key parameter may be obtained on the basis of empirical evidence.
At first sight, introduction of irrational behaviour may appear unnecessary, and con-trasting with the model simplicity we tried to keep throughout. Yet, by avoiding extinc-tion of allowed behaviours, irraextinc-tional behaviour overtakes an unrealistic (and undesirable) effect of strict imitation: the pool of strategies from which an individual can choose is limited to those effectively represented in the population. By allowing exploration of all possiblebehaviours, irrational behaviours may account for erroneous decisions or idiosyn-cratic attitudes always present in human societies.
The focus of this work is to investigate the effects that behavioural change as a pro-tective response to the state of infection has on the spread of a (severe) epidemic. That’s why the behavioural change modelled here affects only susceptible individuals (infected individuals may of course change behaviour as an effect of their status, regardless of the state of epidemic). As a side remark, notice that quarantine or isolation of infected indi-viduals can already be described by our model since they can be modelled as a reduction of the transmission parameters.
A wider class of models can also be considered. The model of behavioural changes can in fact be extended to infected individuals subdivided in symptomatic and asymptomatic, for example treating the infected asymptomatics as susceptibles for anything concerning the behavioural dynamics. A specific class for latent individuals could also be introduced, thereby delaying the epidemic spread and affecting behavioural changes. In general, con-sidering more than two behavioural classes would provide greater flexibility and realism, while of course opening to technical problems of increased complexity.
Chapter 3
Effectiveness of spontaneous social
distancing and risk perception
3.1
Introduction
Among the many factors known to influence the spread of epidemics across human pop-ulations, a central role is played by the heterogeneity in human behaviors and contact patterns [156, 103, 57, 151, 3, 76, 11, 112]. Human spontaneous behavioral response to the risk of infection is largely suspected to play a crucial role as well [71, 132, 56, 21, 52]. In fact, it is expected that, during an epidemic outbreak, individuals change their be-havior in order to reduce the risk of infection, especially if serious consequences are in-volved. As mathematical modeling has increasingly become a powerful tool for decision making, knowing in advance how to account for spontaneous behavioral changes would greatly improve the predictive power of epidemic transmission models and the evalua-tion of the effectiveness of control strategies. Actually, the impact of risk percepevalua-tion on the spontaneous behavioral response, and in turn on the epidemic spread, is largely acknowledged and several models have been proposed in order to investigate such phe-nomenon [42, 147, 53, 93, 67, 66, 9, 137, 138, 127, 90, 130, 68]. Nonetheless, most models in literature either assume a priori human response to the infection o