R E S E A R C H
Open Access
A comparability study between the General
English Proficiency Test- Advanced and the
Internet-Based Test of English as a Foreign
Language
Antony John Kunnan
1*and Nathan Carr
2* Correspondence:
1University of Macau, Taipa, Macau Full list of author information is available at the end of the article
Abstract
Background:This study examined the comparability of reading and writing tasks of two English language proficiency tests—the General English Proficiency Test-A (GEPT-A) developed by Language Training Center, Taipei and the Internet-Based Test of English as a Foreign Language (iBT) developed by Educational Testing Service, Princeton.
Methods:Data was collected from 184 test takers, 92 in Taiwan and 92 in the USA. Three specific analyses were conducted: First, a content analysis was performed on the passages in the GEPT-A and on the iBT reading passages. Second, a task analysis of the construct coverage, scope, and task formats used in the reading sections, and third, a test performance analysis of scores on the two tests were conducted.
Results:The results of the text analysis showed the reading passages on the two tests are comparable in many ways but differ in several key regards. The task analysis revealed that the construct coverage, item scope, and task formats of the two tests are clearly distinct. Analysis of test performance showed that scores on the GEPT-A and iBT are highly inter-correlated with each other. Exploratory and confirmatory factor analyses of the test score data indicated that the two tests appeared to be measuring reading and writing ability but emphasize different aspects of the reading construct.
Conclusion:Although the two tests are comparable in many ways, the reading passages differ in several key regards. Analyses of participant responses indicated that the two tests assess the same reading construct but emphasize different aspects of it.
Background
This study examined the comparability of reading tasks in two language tests, the General English Proficiency Test-Advanced (GEPT-A) and the Internet-Based Test of English as a Foreign Language (TOEFL) (iBT). A study of this kind is valuable for many reasons. First, although the two tests have similar purposes (that is, the tests are used for selection and placement into undergraduate and graduate English-medium universities in the USA and Canada), the two customer bases are different (the GEPT-A is primarily a test taken in Taiwan whereas iBT is taken worldwide). This difference could be reflected in the tests. Second, a study comparing the content and tasks as well as test performance on the two
tests should be required research before test agencies develop concordance score tables and use the tables for making decisions and portability of tests and scores. Comparability in terms of tasks and construct coverage and factor structures based on test performance are essential conditions before both test scores can be used in a concordance table. Without this evidence to support the comparability of the tests, concordance tables would be meaning-less and misleading. Third, a study of this kind could also be used to evaluate the claims of the tests themselves: analyses of the test content and test performance are essential aspects of such evaluations of assessments (Kunnan, 2017). Specifically, this study examined the depth to which the reading tasks are comparable and the degree to which they measured similar language abilities in reading. This study was undertaken for these reasons.
Previous relevant studies
The Cambridge-TOEFL comparability study (Bachman, Davidson, Ryan and Choi, 1995)
This widely known comparability study of language tests was conducted in 1987–1990 and published in 1995 by Lyle Bachman and colleagues. It investigated the comparability of theFirst Certificate of English (FCE)administered by the University of Cambridge Local Examinations Syndicate (now Cambridge ESOL) and the paper-and-pencil version of the
Test of English as a Foreign Language (TOEFL)administered by the Educational Testing Service, Princeton.
The research steps used were twofold: a qualitative content analysis of the items, tasks, and prompts and a quantitative analysis of the test performance of the subjects on the tests. The most important aspect of the study related to the care taken in choosing the test instruments, test samples (in terms of test taker characteristics and test takers’ score norms), and administrative and scoring procedures in such a way that they truly represented the two testing practices. The instruments used were authentic FCE tests, institutional (retired) TOEFL and SPEAK, the retired form of The Test of Spoken English, and a modified version of the Test of Written English. Sampling procedures included selecting participants that represented the characteristics of the test takers of the two tests. In addition, an examination of the descriptive statistics demonstrated that the means and standard deviations of the study subjects and the test norms of worldwide test taker groups for the two tests were only two points apart and were not practically different. Further, the administration and scoring procedures mirrored the procedures used by the test administrators and raters of the two tests. With these strict measures in place, it was possible to make conclusions regarding comparability based on the test content analyses, the test performance analyses, and the correlational analyses.
Other comparability studies
Other related comparability studies include the following studies: Bachman, Davidson and Milanovic (1995) performed content analyses using the newly developed Communicative Language Ability (CLA) and Test Method Facet (TMF) frameworks. The study used the framework to conduct a systematic procedure to analyze test content—the linguistic char-acteristics, test format charchar-acteristics, and the communicative language abilities that were tested in the test items, tasks, and prompts. Another study, Kunnan (1995), from the same dataset focused on the relationship between test taker characteristics and test perform-ance on the two tests, the FCE and theTOEFL. This study conducted exploratory and confirmatory factor analyses and structural equation modeling on the test performance data, and it once again showed that the two tests measured similar language abilities.
Another type of study that compared two versions of the same test was the Choi, Kim, and Boo (2003) study. This study compared a paper-based language test and a computer-based language test—theTest of English Proficiencydeveloped at Seoul National University. The findings based on content analysis using corpus linguistic techniques showed that both versions of the test are comparable. Along similar lines, another study that investigated the comparability of conventional and computerized tests of reading in a second language was Sawaki (2001). This study provided a comprehensive review of litera-ture regarding cognitive ability, ergonomics, education, psychology, and L1 reading. The study did not draw clear conclusions and generalizations about computerized language assessments due to the range of characteristics such as administrative conditions, com-puter requirements, test completion time, and test takers’affect. Similarly, yet another study investigated the comparability of direct and semi-direct speaking test versions (O’Loughlin, 1997). In general, the author concluded that the live and tape-based versions of the oral interaction sub-tests cannot be substituted for each other.
A different approach to investigating equivalence using psychometric equivalence between tests was conducted by Geranpayeh (1994). The study investigated the com-parability of test takers’scores who took two tests, the TOEFL and the International English Language Testing Service (IELTS). The study found that high to moderate correlations between the TOEFL and IELTS scores were found. Along the same lines, Bridgeman and Cooper (1998) conducted a study to investigate the comparability of scores from hand-written and word-processed essays. Results indicated that the scores were higher on the hand-written essays than on word-processed essays. Other more recent investigations included Weir and Wu (2006) who investigated the task comparabil-ity in semi-directed speaking tests of three forms of the GEPT-Intermediate, Stansfield and Kenyon (1992) who investigated the comparability of the oral proficiency interview and the simulated oral proficiency interview, and Hawkey (2009) who compared historical issues and themes in developing the two tests from Cambridge ESOL, theFirst Certificate of Englishand theCertificate in Advanced English.
The two Bachman et al. (1995, 1996) studies mentioned above obviously have direct bearing on this study as these studies investigated the comparability of two different tests. Therefore, this study will follow procedures used in the Bachman studies such as conducting both a test content and test performance analysis.
Research questions
1. What were thecontent, tasks, and response formatsof the reading tasks of the GEPT-A and the iBT in terms of the test passages, items, and tasks?
2. What was thetest performanceof the study participants on the reading and writing
tasks of the GEPT-A and on the iBT?
3. What was thecomparabilityof the factor structures of the GEPT-A and iBT based
on reading and writing scores?
Methods
Participants
The study participants consisted of 184 test takers; 92 from Taiwan and 92 from the USA. All participants were university students; 38% were undergraduates and 62% graduates; 92% of them were between the ages of 17 and 30; 45% male and 55% female; and their main academic majors were 34% engineering, 20% humanities, and 17% business.1 They responded to reading and writing tasks on the GEPT-A in a standard administration. In addition, they submitted scores they obtained on the iBT taken within 2 years prior to the study; this was a requirement to participate in the study.
Instruments GEPT-A
One form of the GEPT Advanced Reading Comprehension Test (Form AR-1101) and Advanced Level Writing Test was used for this study. The reading test consisted of two sections: Careful Reading with four passages and 20 items, including multiple-choice, short answer, and matching items, and Skimming and Scanning with three passages (with the last passage consisting of three short passages) and 20 items. The items in-cluded both matching and fixed-frame multiple choice. The writing test consisted of a task that required test takers to read two essays and write an essay in response.
Internet-Based TOEFL (iBT)
A practice iBT test form fromThe Official Guide to the TOEFL Test(Educational Test-ing Service, 2012) was used for the content comparison. Each readTest-ing test featured nine passages with a total of 122 items including multiple choice, a limited number of multiple-response multiple-choice items (selected response items in which test takers must select two or more correct options per item), and one categorization item. The writing task used was an independent writing task; it required test takers to write an essay in response to a brief prompt.
Data analysis Content analyses
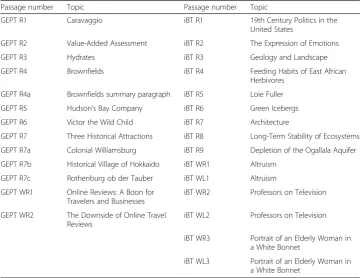
Table 1 lists the topics of the reading passages from both tests.
Coh-Metrix analyses used in this study were 43 variables deemed most useful from 106 generated by the web tool.
Task analysis
The reading items from both tests were examined to determine the aspects of the construct of reading that they seemed most likely to assess. Passages were also classified based on their topics. Additionally, the scope of each item was rated, using a five-point scale of very narrowfor any item for which the key information necessary to answer it correctly was found within a single sentence, narrowif the key information was within the space of several sentences, moderate for any item for which the key information could be found within all or almost all of a single paragraph, broadif the key information was spread across more than a single paragraph, and very broad for any item for which the key information was distributed across more than half the text. The final step in the task analysis was to identify theresponse formatfor items.
Analysis of participants’performance data
Descriptive statistics were computed for GEPT and iBT reading and writing scores, and these means and standard deviations were used to examine the test performance of the study participants.2
Correlations and exploratory and confirmatory factor analyses
Correlations were calculated among the reading and writing tasks for both tests. An exploratory factor analysis was conducted the GEPT-A and the iBT reading and writ-ing scores. A confirmatory factor analysis was then conducted takwrit-ing the results of Table 1Reading and listening passage identification key for GEPT-A and iBT
Passage number Topic Passage number Topic
GEPT R1 Caravaggio iBT R1 19th Century Politics in the
United States
GEPT R2 Value-Added Assessment iBT R2 The Expression of Emotions
GEPT R3 Hydrates iBT R3 Geology and Landscape
GEPT R4 Brownfields iBT R4 Feeding Habits of East African
Herbivores
GEPT R4a Brownfields summary paragraph iBT R5 Loie Fuller
GEPT R5 Hudson’s Bay Company iBT R6 Green Icebergs
GEPT R6 Victor the Wild Child iBT R7 Architecture
GEPT R7 Three Historical Attractions iBT R8 Long-Term Stability of Ecosystems
GEPT R7a Colonial Williamsburg iBT R9 Depletion of the Ogallala Aquifer
GEPT R7b Historical Village of Hokkaido iBT WR1 Altruism
GEPT R7c Rothenburg ob der Tauber iBT WL1 Altruism
GEPT WR1 Online Reviews: A Boon for Travelers and Businesses
iBT WR2 Professors on Television
GEPT WR2 The Downside of Online Travel Reviews
iBT WL2 Professors on Television
iBT WR3 Portrait of an Elderly Woman in a White Bonnet
the exploratory factor analysis as a starting point (Model 1). The steps for confirma-tory factor analysis (CFA) followed standard procedures outlined in Kunnan (1998). Several CFA models with variables from both tests were submitted for evaluation. Goodness-of-fit of the models was evaluated using the following indices: χ2, the NFI, NNFI, CFI, and RMSEA.
Results
Content analysis
The topics used in the tests have been listed in Table 1. It shows that a wide range of topics are used although the GEPT-A is narrower in terms of topics and does not use as many science and engineering as the iBT.
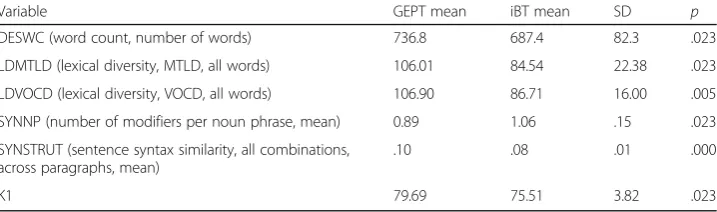
The Coh-Metrix and LexTutor analyses of the reading passages resulted in 43 values for each reading passage. The independent samples Mann-Whitney U test performed on the 43 variables indicated that only five variables were significantly different across the two tests. The two tests varied significantly in the following areas:
1. The number of words per passage,
2. The Measure of Textual Lexical Diversity (MTLD) across all words, 3. The Measure of Diversity of Vocabulary (VOCD) across all words, 4. The mean number of modifiers per noun phrase,
5. The mean sentence syntax similarity across paragraphs, and 6. The percentage of K1 words in each passage.
These statistics are presented in Table 2.
Task analysis
The GEPT-A passages came from a range of subject matter topics but with no content from the life sciences. In contrast, the iBT passages covered the same sorts of topics as the GEPT but with the addition of life sciences topics as well. Notably, the iBT physical sciences passages all dealt with geology.
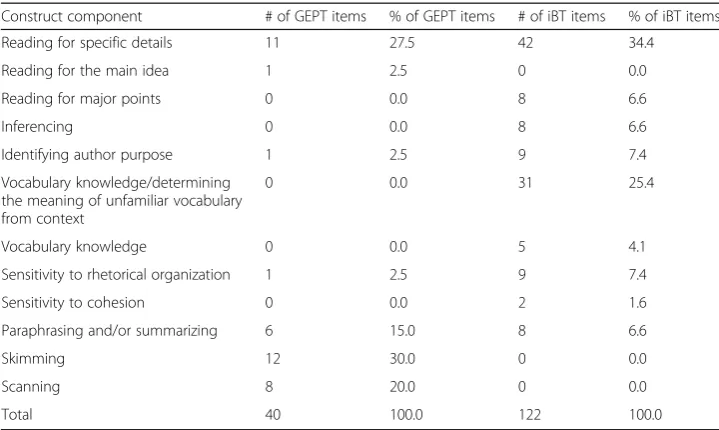
As can be seen in Table 3, the construct coverage of the two tests is similar in some aspects but dissimilar in others. First, in terms of reading for specific details, both tests are not that far apart (27.5 vs. 34.4%). In terms of paraphrasing and/or summarizing, the GEPT-A assesses this more extensively than does the iBT (15.5 vs. 6.6%). Neither does much to assess the ability to identify the main idea of a passage (the GEPT-A
Table 2Significant differences between the GEPT-A and iBT reading passages
Variable GEPT mean iBT mean SD p
DESWC (word count, number of words) 736.8 687.4 82.3 .023
LDMTLD (lexical diversity, MTLD, all words) 106.01 84.54 22.38 .023
LDVOCD (lexical diversity, VOCD, all words) 106.90 86.71 16.00 .005
SYNNP (number of modifiers per noun phrase, mean) 0.89 1.06 .15 .023
SYNSTRUT (sentence syntax similarity, all combinations, across paragraphs, mean)
.10 .08 .01 .000
included one item). In contrast, the iBT includes a number of items to assess the ability to read for major points or ideas (eight in all, one for each passage). And, the iBT in-cludes many items assessing vocabulary knowledge or the ability to determine the meaning of unfamiliar vocabulary from context (36 in all). Finally, another major differ-ence between the two tests lies in the areas of top-down reading processes such as inferencing, identifying author purpose (17 for both), and sensitivity to rhetorical organization and cohesion (11 for both). The iBT includes these to a far greater extent than does the GEPT-A. However, the GEPT-A devotes a whole section to skimming and scanning (20 in all); the iBT does not have any items of this type.
Table 4 describes the breakdown of the scope of the reading items on the GEPT-A and iBT. As can be seen, the GEPT-A predominantly uses items with a narrow or very narrow scope (i.e., requiring the processing of several sentences or less). The iBT, on the other hand, focuses more on moderate-scope items (i.e., those requiring the pro-cessing of an entire paragraph (or close to it)), with this level of scope proving to be the most common one. Finally, the iBT includes a high proportion of items with broad or very broad scope (i.e., the key information was spread across multiple paragraphs or the entire passage, respectively).
Table 5 summarizes the response formats of the two tests. While the iBT was entirely dependent upon selected response items, the GEPT-A included a substantial Table 3Summary of construct coverage for the GEPT-A and iBT
Construct component # of GEPT items % of GEPT items # of iBT items % of iBT items
Reading for specific details 11 27.5 42 34.4
Reading for the main idea 1 2.5 0 0.0
Reading for major points 0 0.0 8 6.6
Inferencing 0 0.0 8 6.6
Identifying author purpose 1 2.5 9 7.4
Vocabulary knowledge/determining the meaning of unfamiliar vocabulary from context
0 0.0 31 25.4
Vocabulary knowledge 0 0.0 5 4.1
Sensitivity to rhetorical organization 1 2.5 9 7.4
Sensitivity to cohesion 0 0.0 2 1.6
Paraphrasing and/or summarizing 6 15.0 8 6.6
Skimming 12 30.0 0 0.0
Scanning 8 20.0 0 0.0
Total 40 100.0 122 100.0
Table 4Summary of scope of reading items for the GEPT-A and iBT
Item scope # of GEPT items % of GEPT items # of iBT items % of iBT items
Very narrow 2 5.0 41 33.6
Narrow 8 20.0 51 41.8
Moderate 17 42.5 14 11.5
Broad 3 7.5 5 4.1
Very broad 10 25.0 11 9.0
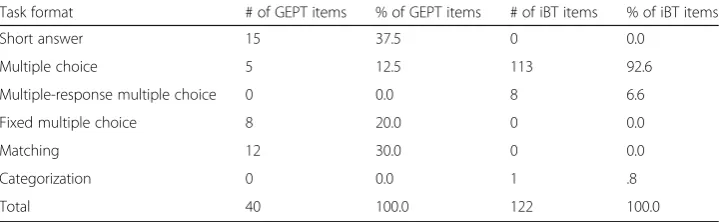
proportion of short answer items, with only about a third of the items using traditional multiple choice. In contrast, the iBT mainly relied upon multiple choice items (92.6%).
Analysis of participants’performance
Table 6 provides the descriptive statistics for GEPT-A and iBT scores. Scores are re-ported in percentages for comparability. The means for the two tests show that the GEPT-A reading and writing tests were more difficult than the iBT reading and writing tasks.
Correlational analysis
Table 7 shows the correlation matrix for the two GEPT-A and iBT reading and writing scores. Unsurprisingly, all of the correlations among test scores were highly significant (p≤.001). The correlation between the two GEPT-A reading sections (Careful reading and Skimming and Scanning) was very high (0.701). The correlation among the iBT scores was somewhat lower (0.545). Correlations across the GEPT-A and iBT scores were lower overall (range from 0.316 to 0.457).
Exploratory factor analysis
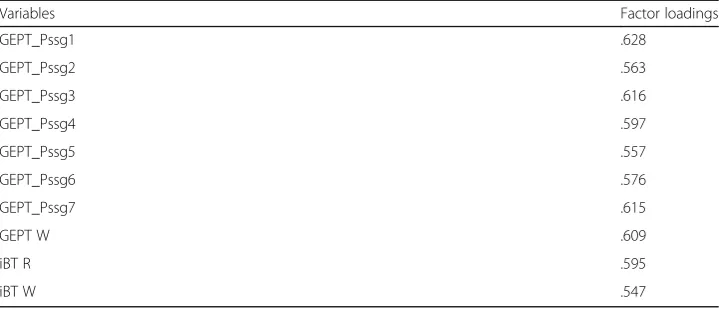
The results of the exploratory factor analysis (EFA) are summarized in Table 8. A single-factor solution provided relatively high loadings for all variables and was both parsimonious and easy to interpret. In contrast, a correlated two-factor solution (r= .593) yielded a first factor that accounted for most of the GEPT-A reading passages (passages 3 to 7), a second factor on which the iBT reading and writing scores loaded (with reading particularly high), and the GEPT-A writing and the remaining two GEPT-A reading passages cross-loaded on both factors, with roughly equal loadings on each. This solution was not easily interpretable. Therefore, the single-factor model was considered the best solution.
Table 5Summary of response formats of reading items on the GEPT-A and iBT
Task format # of GEPT items % of GEPT items # of iBT items % of iBT items
Short answer 15 37.5 0 0.0
Multiple choice 5 12.5 113 92.6
Multiple-response multiple choice 0 0.0 8 6.6
Fixed multiple choice 8 20.0 0 0.0
Matching 12 30.0 0 0.0
Categorization 0 0.0 1 .8
Total 40 100.0 122 100.0
Table 6Descriptive statistics for GEPT and iBT scores in percentage scores
GEPT reading
GEPT writing
iBT reading
iBT writing
Mean 57.9 51.1 82.9 80.1
Median 58.8 50.0 86.7 83.3
Confirmatory factor analysis
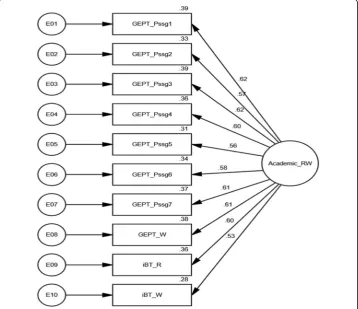
Several competing models were tested. As explained previously, Model 1, shown in Fig. 1, was based on the results of the one-factor EFA solution with the factor assumed to represent both academic reading and writing. All parameter estimates were significant.
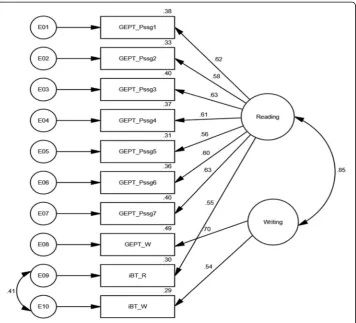
Model 2, shown in Fig. 2, featured all reading scores loading on one factor and both writing scores loading on a second factor with correlated errors. All parameter esti-mates were significant. As the iBT reading and writing scores were self-reported data with some missing data, thus, error terms for these two variables were correlated. This resulted in a noticeable improvement in model fit.
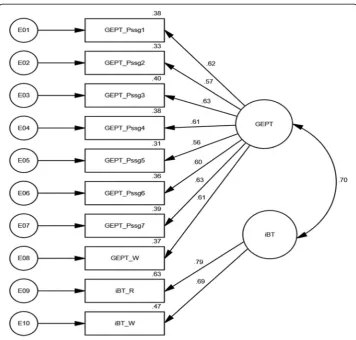
Model 3, shown in Fig. 3, featured all reading and writing scores on two factors, the GEPT-A and iBT. All parameter estimates were significant. However, there was mar-ginal difference with these estimates compared to Model 2. But, the big difference was in the factor correlations. In Model 2, the factor correlations between Academic Read-ing and Academic WritRead-ing was 0.85 while the factor correlations between GEPT-A and iBT was only 0.70.
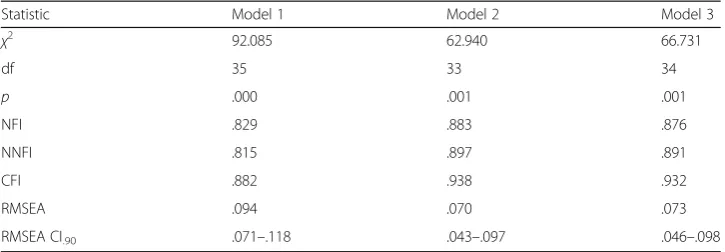
This difference, along with acceptable model fit indices, helped determine that Model 2 was the most acceptable model with the current data. Table 9 presents the Goodness-of-fit indices for all models.
Discussion
Research question 1: content, task, and response format analysis
Research question 1 asked“What is the content, task and response format of the read-ing and writread-ing tasks of the GEPT-A and the iBT in terms of the readread-ing passages, items, tasks?”
Table 7Correlations among GEPT section scores and iBT section scores
GEPT R1 GEPT R2 GEPT W iBT R iBT W
GEPT R1 1.000**
GEPT R2 .701** 1.000**
GEPT W .532** .410** 1.000**
iBT R .457** .414** .338** 1.000**
iBT W .425** .316** .385** .545** 1.000**
** is significant atp. 01
Table 8EFA results for GEPT-A and iBT reading and writing scores
Variables Factor loadings
GEPT_Pssg1 .628
GEPT_Pssg2 .563
GEPT_Pssg3 .616
GEPT_Pssg4 .597
GEPT_Pssg5 .557
GEPT_Pssg6 .576
GEPT_Pssg7 .615
GEPT W .609
iBT R .595
Content
There is a major difference between the two tests. The GEPT-A tasks included passages with a range of topical content but had only one passage dealing with the sciences (and none taken from the life sciences). In contrast, the iBT had a much heavier emphasis on the sciences. Interestingly, the only physical or Earth science topic covered by either the GEPT-A or iBT was geology. This difference perhaps reflects the customer bases of the two tests: the GEPT-A’s base is primarily in Taiwan and its test takers may have less interest in science-oriented topics; the iBT customer base, on the other hand, is world-wide and its test takers have a world-wider range of academic majors and their major disci-plines include science and engineering.
There are also many differences between the two tests. First, the GEPT-A had seven reading passages, four for careful reading and three for skimming and scanning; in contrast, the iBT had three reading passages, all for careful reading. Second, in terms of words per passage, the GEPT-A passages averaged nearly 50 words more than the iBT reading passages. Third, the reading passages differed in certain aspects involving vocabulary. The GEPT-A had a higher level of lexical diversity in its passages on two separate measures. The proportion of words from the K1 list was also higher for the GEPT-A. In terms of syntax, the iBT had on average significantly more modifiers per noun phrase. Finally, in terms of syntactic similarity across paragraphs—an indicator of cohesion and/or of ease of processing—the iBT measured higher than the GEPT-A. These differences likely contributed in making
the GEPT-A a more difficult test than the iBT. This finding was also shown in the percentage scores reported on the two tests.
Tasks
One salient difference between the two tests was GEPT-A’s inclusion of skimming/ scanning section with 20 items (the same number as on the Careful Reading section) with a 20-min time allocation. The iBT did not include any skimming or scanning items. However, as there is an overall time limit, it is possible that the iBT reading tasks have to be completed in an expeditious fashion, leading to skimming and scanning rather than careful reading.
Another difference was that the GEPT-A didnotinclude any items targeting vocabulary knowledge or the ability to infer the meaning of unfamiliar vocabulary from context, while the iBT made heavy use of vocabulary items (30% of all items). But, given the iBT re-sponse format used (multiple-choice glosses of the word or phrase in item), test takers who knew the word could possibly answer without even having to read the passage.
Third, both tests included items that required students to read for specific details, and both tests made use of paraphrasing rather than using identical language in an item and the passage. On the other hand, the careful reading section of the GEPT-A made extensive use of specific detail items (11 out of 20 items) but did not use inferencing or reading for the main idea items.
Both tests required paraphrasing and summarizing of material read, but they differed in their emphasis. The GEPT-A required both paraphrasing and summarizing but with a greater emphasis on summarizing. In contrast, the iBT straddled the boundary between the two to some extent and involved a much smaller degree of the information re-duction that is required in summarizing. In addition, the GEPT-A used short-answer tasks to address this portion of the reading construct, while the iBT used multiple choice.
Finally, the iBT appears to have abandoned main idea items in favor of major points. However, the GEPT-A only included one main idea item and no items related to major points. Also, the GEPT-A only included one author purpose item compared to many inference items and author purpose items in the iBT.
These differences in general show that while GEPT-A is focused on assessing general reading, iBT is focused on the more advanced assessing academic reading, that is, the tasks reflect more the tasks students at university are likely to be engaged in.
Scope
The reading comprehension items on the GEPT-A and iBT differed substantially in terms of scope. The overwhelming majority of iBT items (76%) had narrow or very nar-row scope, that is, the necessary information to answer items correctly was contained within several sentences or just one sentence, respectively. In marked contrast, 75% of
the GEPT-A reading items on the form analyzed had moderate, broad, or very broad scope, requiring test takers to extract the necessary information from most or all of a paragraph, more than one paragraph, or more than half the passage, respectively. This could be expected to make the GEPT-A items more challenging.
Response formats
The two tests differed markedly in terms of the response formats they employed. The majority of reading items on the GEPT-A were selected response but over a third were short answer items. The selected response items included a substantial portion that was not multiple choice—although about one third of all items were multiple choice or fixed-format multiple choice, the remaining 30% were matching. On the other hand, the iBT items analyzed relied overwhelmingly on traditional multiple choice, with eight multiple-response multiple-choice items and one categorization item. The limited use by the iBT of selected response task and the more even distribution of response for-mats on the GEPT-A clearly sets it apart and stands likely to reduce any impact from test method effects on the scores. Furthermore, the use of short-answer items on the GEPT-A clearly reflects more authentic academic tasks (Bachman & Palmer, 1996); such items seem likely to engage communicative language ability more thoroughly and could also do a better job of testing actual reading as opposed to testing mere recogni-tionof the correct answers in the options.
Research question 2: test performance
Research question 2 asked “What is the test performance of the study participants on the reading and writing tests of the GEPT-A and on the iBT?”
Descriptive statistics
Judging from the descriptive statistics for scores, the study participants received a higher proportion of items correct on the iBT than on the GEPT-A. Similarly, test takers performed better on the iBT writing section than on the GEPT-A writing task. Study participants performed similarly on the two sections of the GEPT-A reading, the careful reading and skimming and scanning sections, and test takers’ iBT scores were similar for reading and writing.
Table 9Goodness-of-fit summary for CFA models
Statistic Model 1 Model 2 Model 3
χ2
92.085 62.940 66.731
df 35 33 34
p .000 .001 .001
NFI .829 .883 .876
NNFI .815 .897 .891
CFI .882 .938 .932
RMSEA .094 .070 .073
Research question 3: comparability of the tests
Research question 3 asked “What is the comparability of the reading and writing tests of the GEPT-A and iBT?”
Correlations
The significant correlations among the GEPT-A and iBT reading and writing scores indicated that the two tests assessed similar constructs. The results of the EFA further indicated that the GEPT-A and iBT reading and writing tasks assessed substantially the same construct, since all observed variables (the seven passage-based GEPT-A testlets, GEPT-A writing score, and iBT reading and writing scores) loaded on the same common factor.
Factor analyses
The hypothesis that the two tests measure the same constructs was also supported by the results of the CFA, although not with the same factor structure as suggested by the EFA. The CFA found the best fit was a two-factor (Academic Reading and Academic Writing) rather than for a single-factor model (Table 9). The two-factor reading and writing model also fits better than one with separate factors for GEPT-A and iBT.
Summary
There are several areas where the two tests are not similar. The content analysis of the reading passages in terms of topics showed that the GEPT-A placed much less emphasis on the reading of scientific or technical topics than the iBT. This is one area in which the two tests seem tonotbe comparable. Further, in terms of construct coverage, the GEPT-A doesnotgive adequate coverage to aspects of careful reading such as reading for details and paraphrasing/summarizing and ignores inferencing and the ability to determine the meaning of unfamiliar vocabulary from context. At the same time, however, the iBT omits all coverage of skimming and scanning and has many items that function (or can func-tion) as assessments of vocabulary knowledge rather than reading ability.
The tests are also notcomparable in terms of the scope of their reading comprehen-sion items. The GEPT-A has a more even distribution in scope across its items than does the iBT, with a much lower proportion of narrow-scope items than the iBT. This seems appropriate for a test that purports to assess English at a high level of proficiency, whereas a greater emphasis on items of narrow and very narrow scope would be appropriate on tests targeting lower proficiency levels. The response formats used on the two tests are also not comparable, most notably due to the extensive use of short answer items on the GEPT-A in contrast to the iBT which only uses multiple-choice answer items. In addition, the score distributions of the two tests were not equivalent in this study, suggesting that the GEPT-A may have been more difficult than the iBT.
Limitations
There were several limitations to this study; we will list the main ones. First, the study only focused on one form of the GEPT-A and commercially published practice tests of the iBT reading and writing. In order to generalize about the two tests, several forms of the two tests should be examined in terms of test content and test performance. Second, the study sam-ple was a very small percentage of the test-taking populations for both tests. This study sample needs to be larger and more representative of the two populations. Third, the study participants were a convenience sample who were highly motivated to take part in the study. This is likely to be different from the test-taking populations and this may have had some effect on their performance.3Fourth, while the data from GEPT-A was collected dur-ing the project period (2015–16), data from iBT was anywhere from 2014. It would have been preferable to have data on both tests collected at the same time of the project. Fifth, this study examined the test content and test performance for all the study participants as one monolithic group, but it is likely that students in universities with different academic majors or disciplines may experience the tests differently and perform differently. Finally, another limitation was that while item-level data from the GEPT-A was collected from the study participants, only section-level from iBT was submitted by the study participants. This unevenness may have some effect on the factor structure solutions that were observed through the EFA and CFA analyses.
Future research in comparability studies will need to find ways to overcome these limitations so that findings can be more generalizable and valuable to the test-taking community as well as the various stakeholders.
Conclusions
This study examined the comparability of the GEPT-A and iBT using data from test takers in both Taiwan and the USA using one form of the GEPT-A reading and writing sections and commercially published forms of the iBT reading and writing. Three research questions were posed regarding the content of the GEPT-A and iBT reading and writing tests, performance on the two tests, and the comparability of the two tests. We conclude that the passages on the two tests are comparable in many ways, but reading passages differ in several key regards. Analyses of participant responses indi-cated that the two tests assess the same constructs but emphasize different aspectsof the reading construct. Overall, though, it is clear that there is more comparability than difference between these two tests in terms of reading and writing.
Endnotes
1
2
The actual essays of the study participants on the GEPT-A writing were not analyzed, only the scores for the writing were analyzed. Also, only the scores of the iBT writing were analyzed.
3
See Footnote 1 above for a more detailed explanation.
Acknowledgements
The authors would also like to thank Dr. Sun-Young Shin at Indiana University and Dr. Becky Huang at the University of Texas, San Antonio and student research assistants Carol Celestine and Elizabeth Lee Tien from Nanyang Technological University, Singapore. We also want to thank the study participants from California State University, Fullerton; Indiana University, Bloomington; and the University of Texas, San Antonio; and the study participants in Taiwan.
Funding
The authors acknowledge project funding from the Language Training and Testing Center in Taipei, Taiwan, awarded to the first author.
Authors’contributions
Both authors contributed equally to the research and research report. Both authors read and approved the final manuscript.
Competing interests
The authors declare that they have no competing interests.
Publisher’s Note
Springer Nature remains neutral with regard to jurisdictional claims in published maps and institutional affiliations.
Author details
1University of Macau, Taipa, Macau.2California State University, Fullerton, USA.
Received: 7 August 2017 Accepted: 10 October 2017
References
Bachman, LF, Davidson, F, Milanovic, M. (1996). The use of test methods in the content analysis and design of EFL proficiency tests.Language Testing,13, 125–150.
Bachman, LF, Davidson, F, Ryan, K, Choi, I-C (1995).An investigation of the comparability of the two tests of English as a foreign language: the Cambridge-TOEFL comparability study. Cambridge, U.K.: Cambridge University Press. Bachman, LF, & Palmer, AS (1996).Language testing in practice. Oxford, U.K.: Oxford University Press.
Bridgeman, B, & Cooper, R (1998).Comparability of scores on word-processed and handwritten essays on the graduate management admissions test. Princeton, NJ: Research report 143: Educational Testing Service.
Choi, I-C, Kim, KS, Boo, J. (2003). Comparability of a paper-based language test and a computer-based language test. Language Testing,20, 295–320.
Crossley, S. A., Dufty, D. F., McCarthy, P. M., & McNamara, D. S. (2007). Toward a new readability: a mixed model approach. InProceedings of the 29thannual conference of the Cognitive Science Society(pp. 197–202). Austin, TX: Cognitive Science Society.
Educational Testing Service. (2012). The official guide to the TOEFL test (4thEd.). New York: McGraw-Hill.
Educational Testing Service. (2015).Test and score data summary for TOEFL iBT Tests: January 2014–December 2014 test data. New York: Retrieved from https://www.ets.org/s/toefl_itp/pdf/toefl-itp-test-score-data-2014.pdf.
Geranpayeh, A. (1994). Are score comparisons across language proficiency test batteries justified? An IELTS-TOEFL comparability study.Edinb Working Pap Appl Linguist,5, 50–65.
Graesser, AC, McNamara, DS, Kulikowich, JM. (2011). Coh-Metrix: providing multilevel analyses of text characteristics. Educational Researcher,40, 223–234.
Hawkey, R (2009).Examining FCE and CAE. Cambridge, UK: Cambridge University Press.
Kunnan, AJ (1995).Test taker characteristics and test performance: a structural modeling study. Cambridge, UK: Cambridge University Press.
Kunnan, AJ. (1998). An introduction to structural equation modeling for language assessment research.Language Testing,15, 295–332.
Kunnan, AJ (2017).Evaluating language assessments. New York: Routledge.
O’Loughlin, K. (1997). The comparability of direct and semi-direct speaking tests: a case study. Unpublished Ph.D. thesis. Melbourne: University of Melbourne.
Sawaki, Y. (2001). Comparability of conventional and computerized tests of reading in a second language.Lang Learn Technol,5, 38–59.
Stansfield, C, & Kenyon, D. (1992). Research on the comparability of the oral proficiency interview and the simulated oral proficiency interview.System,20, 347–364.