R E S E A R C H
Open Access
Trajectories of eating behaviors in a
nationally representative cohort of U.S.
adolescents during the transition to young
adulthood
Leah M. Lipsky
1*, Denise L. Haynie
1, Danping Liu
1, Ashok Chaurasia
1, Benjamin Gee
1, Kaigang Li
2,
Ronald J. Iannotti
3and Bruce Simons-Morton
1Abstract
Background:Diets of U.S. adolescents and adults do not meet recommendations, increasing risk of chronic disease. This study examined trajectories and predictors of eating behaviors in U.S. youth from age 16–20 years, and evaluated longitudinal associations of eating behaviors with weight outcomes.
Methods:Data come from the first four waves (years) of the NEXT Generation Health Study, a nationally representative cohort of U.S. students in 10thgrade during the 2009–2010 school year (n= 2785). Annual surveys queried frequency of food group intake (times/day of fruit and vegetables, whole grains, sugar-sweetened soda, sweet and salty snacks), and meal practices (days/week of breakfast, family meals, fast food, and television during meals). Body mass index (BMI, kg/m2) was calculated from self-reported height and weight. Adjusted generalized estimating equations and linear mixed models with multiple imputation for missing data estimated eating behavior trajectories overall and by baseline weight status (normal weight = 5≤BMI%ile < 85, overweight = 85≤BMI%ile < 95, obese = BMI%ile≥95), accounting for the complex sampling design. Separate GEE models estimated longitudinal associations of food group frequencies with meal practices and of BMI with eating behaviors.
Results:Eating behaviors tracked strongly from wave 1–4 (residual intraclass correlation = 41 % - 51 %). Across all baseline weight categories, frequency of food group intake and meal practices decreased over time, except for fast food, which remained stable. Fruit/vegetable intake frequency was associated positively with family meals (β± SE = 0.33 ± 0.05) and breakfast (0.18 ± 0.03), and inversely with fast food (−0.31 ± 0.04), while whole grain intake frequency was associated positively with family meals (0.07 ± 0.02), television meals (0.02 ± 0.009) and breakfast (0.04 ± 0.01). Soda and snacks were positively associated with television meals (0.08 ± 0.008 and 0.07 ± 0.009, respectively) and fast food (0.24 ± 0.02 and 0.20 ± 0.03, respectively), while soda was inversely associated with breakfast frequency (−0.05 ± 0.01). Time-varying BMI was unrelated to eating behaviors other than an inverse association with time-varying snacks (−0.33 ± 0.12).
Conclusions:Strong tracking over time supports the importance of early establishment of health-promoting eating behaviors in U.S. adolescents. Findings suggest meal practices may be important intervention targets. Lack of evidence for hypothesized associations of BMI and eating behaviors indicates the need for research confirming these findings using more precise measures of dietary intake.
Keywords:Eating behaviors, Body mass index, Emerging adults, Prospective research
* Correspondence:leah.lipsky@nih.gov
1Division of Intramural Population Health Research, Eunice Kennedy Shriver
National Institute of Child Health and Human Development, 6100 Executive Blvd, North Bethesda, MD 20852, USA
Full list of author information is available at the end of the article
Background
U.S. adolescents consume less than recommended amounts of fruit, vegetables and whole grains, and ex-ceed recommended intake of empty calories [1]. The transition from adolescence to young adulthood is an understudied developmental period characterized by in-creased independence of behavioral decision-making and the establishment of life-long health behaviors [2]. Given the concomitant increase in obesity [3] and its as-sociated adverse health outcomes [4, 5], research is needed elucidating the variability and determinants of weight-related behaviors during this transition.
Prospective studies evaluating eating behaviors in emer-ging adults have been conducted primarily in international cohorts and geographically-limited U.S. studies. Findings suggest adolescent dietary behaviors such as intake of fruit and vegetables, sugary foods, and snacks persist somewhat into adulthood [6–9], although studies have reported an overall decrement in diet quality during this period [6, 10]. Evidence indicates that dietary quality is influenced by meal practices such as eating breakfast [11], family meals [12] and fast food [13], and that both dietary quality and meal practices are linked with sociodemo-graphic characteristics [14, 15]. However, prospective research using current, nationally representative sam-ples is needed to evaluate the relevance of these factors in contemporary U.S. adolescents. Furthermore, while excess weight is hypothesized to result from greater frequency of eating behaviors contributing to greater total energy intake [16], few consistent associations have emerged. Additionally, previous studies have not examined whether weight status, which may culminate from previously-established eating behaviors or precipi-tate modifications of eating behavior for the purpose of weight control, predicts differential eating behavior trajectories. An important limitation of previous studies is the absence of repeated assessments of body weight and eating behaviors in individuals over time, which would enable examining a range of time-specific weight measures for evaluating these pathways, including con-current weight as well as weight change that precedes a behavior (retrospective), or that follows a behavior (prospective).
Objectives of this study were to examine trends and changes in eating behaviors during the adolescent-adult transition in a contemporary, nationally representative U.S. cohort, and to examine whether these trends differ by sociodemographic factors or baseline weight status. We further sought to examine longitudinal associations among eating behaviors, and of eating behaviors with concurrent body mass index (BMI, kg/m2), retrospect-ive and prospectretrospect-ive BMI change in order to elucidate the dynamic relationship between eating behaviors and weight outcomes.
Methods
Study design and setting
Data come from the first four waves (years) of the NEXT Generation Health Study, an on-going seven-year observa-tional cohort study of multiple health indicators and behaviors in a nationally representative sample of U.S. ad-olescents followed prospectively. School districts were the primary sampling units, stratified by the nine major U.S. census divisions. Out of 137 schools with 10th grade se-lected, 81 (59 %) agreed to participate. Classrooms within schools were randomly selected for inclusion. Baseline data were collected during the 2009–2010 school year; however, due to timing of school approval for participa-tion, baseline assessments for 260 of the participants occurred during the second wave (2010–2011, 11thgrade). Participants completed self-administered surveys annually. Over the first four waves, survey data were collected from 2785 participants, with 78 % retention in wave 4. Schools with large percentages of African American students were oversampled to obtain reliable estimates for this subgroup; a sufficient number of Hispanic students were obtained to provide reliable subgroup estimates without oversampling. Parents provided informed consent for their child’s par-ticipation; youth provided assent (if <18 years of age) or consent (if ≥18 years). Procedures were approved by the institutional review board at the Eunice Kennedy Shriver National Institute of Child Health and Human Development.
Measures
Eating behaviors
home”, assessed waves 1–3), and fast food (“How often do you eat in a fast food restaurant”). Responses ranged from never to every day.
Body weight variables
Body mass index (BMI, kg/m2) was calculated at each wave from self-reported height and weight; sex- and age-specific Centers for Disease Control BMI percen-tiles (%ile) [20] were used to define baseline weight status (underweight = BMI%ile < 5, normal weight = 5≤ BMI%ile < 85, overweight = 85≤BMI%ile < 95, obese = BMI%ile≥95) [21]. Prospective 1-year BMI change (next year BMI–current BMI) was calculated for waves 1 through 3; similarly, retrospective 1-year BMI change (current BMI – previous year BMI) was calculated for waves 2 through 4.
Covariates
Covariates were selecteda prioribased on previous re-search on eating behaviors and body weight. Partici-pants reported sex and race/ethnicity at baseline. The previously-validated Family Affluence Scale was calcu-lated based on participant survey responses regarding household car and computer ownership, family vacations, and bedroom sharing [22], and ranges from 0 (low afflu-ence) to 7 (high affluafflu-ence). Parent-reported educational attainment, ascertained during the consent process, was categorized as less than high school graduate/high school graduate/some college/bachelor’s degree/graduate degree. Baseline school urbanicity was assigned and categorized as urban/suburban/rural. Self-reported previous-week vigor-ous physical activity (hours per week), assessed at each wave, was included as a covariate given its associations with dietary intake and body weight [23]. Participants were asked“How many hours a week do you usually engage in vigorous physical activity so much that you get out of breath or sweat”, with responses ranging from none to 7 h or more.
Statistical analysis
Multiple imputation by chained equations, assuming missing-at-random [24, 25] was used for missing ables. The algorithm iteratively imputes missing vari-ables by estimating its distribution conditional on other variables. Fifty imputed datasets were generated using the R package“mice”. Each dataset was analyzed separ-ately and the results were combined using Rubin’s rule in StataSE version 12 (College Station, TX).
Baseline sociodemographics and physical activity were summarized overall and by baseline weight status. Be-havioral variables at each wave were summarized, and
p-values for the unadjusted time trends were calculated using unadjusted linear generalized estimating equa-tions (GEE).
Linear GEE models were used to evaluate the primary re-search questions. This analytic method enables examining time-varying (variables that change over time, such as eat-ing behaviors) dependent variables in relation to both time-varying and time-constant (variables that do not change over time, such as sex) independent variables, while accounting for the correlation of repeated measures within subjects. Separate models estimated trends in food group intake frequency (fruit and vegetables, soda, whole grains and snacks) and meal practices (family meals, TV meals, breakfast, and eating at a fast food restaurant). Primary predictors included time (wave) and baseline weight status; covariates included baseline sociodemographics and time-varying height and vigorous physical activity. Differential trends by baseline weight status, race/ethnicity and sex were tested in separate models including a multiplicative interaction term of time with the hypothesized modifying variable (e.g., wave*baseline weight status). Tracking was measured by calculating the residual intraclass correlation (between-cluster variation divided by total variation), using linear mixed models with the same covariates as in the main trends analyses [26].
Associations of each time-varying food group intake fre-quency (dependent variable) with each time-varying meal practice (independent variable) were evaluated using linear GEE models adjusted for wave, time-varying BMI, height, and vigorous physical activity (hours/day), and baseline sociodemographic variables. Finally, associations of weight outcomes (time-varying BMI, prospective 1-y BMI change, and retrospective 1-y BMI change) with time-varying food group intake frequencies and meal practices were investi-gated using linear GEE models adjusted for wave, time-varying height and vigorous physical activity, and baseline sociodemographic characteristics. All models adjusted for the complex sampling design.
Results and discussion
Forty percent of participants were overweight (18.9 %) or obese (20.3 %) at baseline (Table 1). Approximately half of participants were non-Hispanic white, and par-ents of approximately two-thirds of studpar-ents reported at least some college education. On average, participants reported approximately 3 h/week of vigorous physical activity at baseline.
Eating behaviors
Table 1Baseline sample characteristics overall and by baseline weight statusa,b(N= 2785)
Body Mass Index Percentile (BMI%ile)
Overall <5 ≥5, <85 ≥85, <95 ≥95 1.51 % (0.004) 59.27 % (0.02) 18.87 % (0.01) 20.35 % (0.01) Age (years) 16.27 (0.03) 16.18 (0.19) 16.27 (0.03) 16.26 (0.04) 16.27 (0.05) Family Affluence Scalec 5.41 (0.11) 5.75 (0.41) 5.48 (0.11) 5.32 (0.12) 5.22 (0.13) Race/ethnicity (%)
Non-Hispanic White 55.70 (5.92) 64.37 (14.60) 58.12 (6.23) 56.61 (6.51) 47.16 (6.26) Non-Hispanic Black 20.29 (4.43) 16.60 (9.76) 19.27 (4.45) 17.73 (5.15) 25.41 (4.57) Hispanic 19.29 (3.71) 17.55 (9.63) 17.57 (3.86) 19.50 (5.70) 24.25 (4.15) Other 4.82 (1.00) 1.48 (1.33) 5.05 (0.77) 6.16 (3.10) 3.18 (1.10) Sex (%)
Male 45.48 (1.63) 80.34 (8.42) 43.30 (1.65) 43.86 (4.93) 50.77 (3.11) Female 54.52 (1.63) 19.66 (8.42) 56.70 (1.65) 56.14 (4.93) 49.23 (3.11) Parent education (%)
< High School 8.68 (2.06) 15.12 (7.88) 7.91 (1.94) 7.46 (3.43) 11.61 (2.44) High school graduate 24.91 (2.96) 12.51 (7.32) 22.71 (2.46) 27.51 (3.02) 29.83 (3.70) Some college 39.53 (1.74) 35.80 (15.33) 39.15 (2.29) 38.33 (3.17) 42.02 (2.97) Bachelor’s degree 14.58 (1.56) 31.79 (14.66) 17.12 (1.94) 10.27 (1.82) 9.91 (1.82) Graduate degree 12.30 (1.87) 4.77 (2.79) 13.12 (2.39) 16.43 (3.38) 6.64 (1.80) Urbanicity (%)
Urban 17.36 (7.65) 25.51 (12.56) 17.58 (7.70) 16.95 (7.66) 16.52 (7.58) Suburban 48.81 (9.80) 50.36 (16.28) 46.69 (10.00) 53.86 (9.89) 53.86 (10.19) Rural 33.83 (7.41) 24.12 (10.52) 35.73 (8.05) 33.16 (7.29) 29.62 (7.02) Vigorous physical activity (hours/week) 3.06 (0.11) 2.38 (0.32) 3.15 (0.12) 3.11 (0.16) 2.81 (0.17)
a
Weight status calculated according to BMI%ile cut-offs: <5 underweight;≥5, <85 normal weight;≥85, <95 overweight;≥95 obese b
Values are mean or % (SE) c
Ranging from 0 (low affluence) to 7 (high affluence)
Table 2Unadjusted mean (SE) body mass index (BMI, kg/m2), food group intake (times/day), meal behaviors (days/week), and prospective 1-year body mass index (BMI) change by wave
Wave
1 2 3 4 P-trenda
Food group intake frequency (times/day)
Fruit and vegetables 3.95 (0.16) 3.91 (0.12) 3.68 (0.12) 3.41 (0.15) 0.004
Whole grains – 1.24 (0.05) 1.19 (0.05) 1.00 (0.04) <0.001
Sugar-sweetened soda 1.10 (0.06) 1.02 (0.05) 0.98 (0.05) 0.82 (0.05) <0.001
Sweet and salty snacks – 1.26 (0.04) 1.15 (0.04) 0.89 (0.04) <0.001
Meal practices (days/week)
Family meals 2.54 (0.07) 2.27 (0.07) 2.02 (0.07) – <0.001
Breakfast 4.45 (0.11) 4.29 (0.11) 4.41 (0.10) 3.84 (0.11) <0.001
Television during meals 3.34 (0.15) 2.99 (0.14) 2.91 (0.11) – <0.001
Fast food 1.05 (0.06) 1.06 (0.06) 1.14 (0.07) 1.15 (0.07) 0.03
BMI (kg/m2) 23.74 (0.18) 24.32 (0.21) 24.76 (0.25) 25.27 (0.26) <0.001
Prospective 1-y BMI changeb 0.58 (0.11) 0.44 (0.11) 0.51 (0.09) – 0.66
Vigorous physical activity (hours/week) 3.06 (0.11) 2.78 (0.11) 2.69 (0.10) 2.65 (0.11) <0.001
a
Pfor unadjusted time-trend estimated from unadjusted linear generalized estimating equations b
food frequency was relatively stable throughout waves 1–4, increasing by approximately 0.1 days/week by wave 4.
BMI and vigorous physical activity
Mean BMI increased steadily (0.44-0.58 kg/m2) each wave, and was within the overweight category for adults at wave 4. Mean vigorous physical activity decreased by 25 min/week (0.42 h) from wave 1 to 4, with the great-est decline (~17 min/week) occurring between the first two waves.
Tracking and trends in eating behaviors
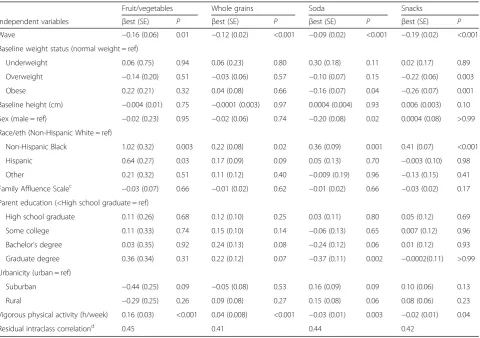
Within-person correlation accounted for 41 % - 50 % of the residual variance in time-varying eating behaviors in models estimating associations with baseline weight sta-tus (Tables 3 and 4). GEE model estimates indicate that, other than stable fast food, frequencies of food group intakes and meal practices decreased over time. Partici-pants with overweight baseline BMI consumed fewer snacks and less frequent breakfasts and family meals
overall as compared with those with normal weight baseline BMI, while participants with obese baseline BMI consumed less frequent soda and snacks. Trends were similar by baseline weight category, as evidenced by no statistically significant interactions of baseline weight category and wave (Additional file 1).
Covariates
GEE models indicate few consistent relationships between time-varying eating behaviors and baseline sociodemo-graphic variables (Tables 3 and 4). Non-Hispanic black participants reported higher intake frequency of all food groups, greater frequency of TV meals and fast food, and less frequent family meals versus non-Hispanic white par-ticipants. Greater family affluence was associated with more frequent family meals and fast food. Time-varying vigorous physical activity was associated with more fre-quent fruit and vegetables and whole grains, less frefre-quent soda and snacks, more frequent family meals and break-fast, and less frequent TV meals (Tables 3 and 4). The
Table 3Estimates (βest ± SE) from linear generalized estimating equations (GEE) evaluating associations of time-varying food group intake frequency (times/day) with baseline weight statusa,b
Fruit/vegetables Whole grains Soda Snacks
Independent variables βest (SE) P βest (SE) P βest (SE) P βest (SE) P Wave −0.16 (0.06) 0.01 −0.12 (0.02) <0.001 −0.09 (0.02) <0.001 −0.19 (0.02) <0.001 Baseline weight status (normal weight = ref)
Underweight 0.06 (0.75) 0.94 0.06 (0.23) 0.80 0.30 (0.18) 0.11 0.02 (0.17) 0.89 Overweight −0.14 (0.20) 0.51 −0.03 (0.06) 0.57 −0.10 (0.07) 0.15 −0.22 (0.06) 0.003 Obese 0.22 (0.21) 0.32 0.04 (0.08) 0.66 −0.16 (0.07) 0.04 −0.26 (0.07) 0.001 Baseline height (cm) −0.004 (0.01) 0.75 −0.0001 (0.003) 0.97 0.0004 (0.004) 0.93 0.006 (0.003) 0.10 Sex (male = ref) −0.02 (0.23) 0.95 −0.02 (0.06) 0.74 −0.20 (0.08) 0.02 0.0004 (0.08) >0.99 Race/eth (Non-Hispanic White = ref)
Non-Hispanic Black 1.02 (0.32) 0.003 0.22 (0.08) 0.02 0.36 (0.09) 0.001 0.41 (0.07) <0.001 Hispanic 0.64 (0.27) 0.03 0.17 (0.09) 0.09 0.05 (0.13) 0.70 −0.003 (0.10) 0.98 Other 0.21 (0.32) 0.51 0.11 (0.12) 0.40 −0.009 (0.19) 0.96 −0.13 (0.15) 0.41 Family Affluence Scalec −0.03 (0.07) 0.66 −0.01 (0.02) 0.62 −0.01 (0.02) 0.66 −0.03 (0.02) 0.17
Parent education (<High school graduate = ref)
High school graduate 0.11 (0.26) 0.68 0.12 (0.10) 0.25 0.03 (0.11) 0.80 0.05 (0.12) 0.69 Some college 0.11 (0.33) 0.74 0.15 (0.10) 0.14 −0.06 (0.13) 0.65 0.007 (0.12) 0.96 Bachelor’s degree 0.03 (0.35) 0.92 0.24 (0.13) 0.08 −0.24 (0.12) 0.06 0.01 (0.12) 0.93 Graduate degree 0.36 (0.34) 0.31 0.22 (0.12) 0.07 −0.37 (0.11) 0.002 −0.0002(0.11) >0.99 Urbanicity (urban = ref)
Suburban −0.44 (0.25) 0.09 −0.05 (0.08) 0.53 0.16 (0.09) 0.09 0.10 (0.06) 0.13 Rural −0.29 (0.25) 0.26 0.09 (0.08) 0.27 0.15 (0.08) 0.06 0.08 (0.06) 0.23 Vigorous physical activity (h/week) 0.16 (0.03) <0.001 0.04 (0.008) <0.001 −0.03 (0.01) 0.003 −0.02 (0.01) 0.04
Residual intraclass correlationd 0.45 0.41 0.44 0.42
a
Weight status calculated according to Body Mass Index percentile cut-offs: <5 underweight;≥5, <85 normal weight;≥85, <95 overweight;≥95 obese b
Separate models examining each eating behavior outcome, adjusted for all independent variables c
Ranging from 0 (low affluence) to 7 (high affluence) d
association of physical activity with fast food was not sta-tistically significant.
Eating behavior trends were mostly non-differential by baseline race/ethnicity and sex, except that breakfast fre-quency increased over time for females relative to males, and fast food frequency decreased over time for non-Hispanic black relative to non-non-Hispanic white partici-pants (Additional file 2).
Associations among eating behaviors
In GEE models examining associations of time-varying food group intake frequency with time-varying meal prac-tices, family meals and breakfast were positively associated with fruit/vegetables and whole grains (Table 5). More quent breakfast was additionally associated with less fre-quent soda intake, while more frefre-quent fast food was associated with less frequent fruit/vegetables and more fre-quent soda and snacks. More frefre-quent TV meals was asso-ciated with more frequent soda, whole grains and snacks.
Associations of BMI with eating behaviors
Time-varying BMI was unrelated to time-varying eating behaviors, other than an inverse relationship with snacks (Tables 6 and 7). Time-varying BMI of non-Hispanic black and Hispanic participants was between 1.97-2.69 kg/m2 and 1.27-1.54 kg/m2higher, respectively, than that of non-Hispanic white participants, and was not associated with other sociodemographic variables. BMI was inversely asso-ciated with vigorous physical activity; each additional hour of vigorous physical activity was associated with an ap-proximately 0.1 kg/m2lower BMI. Eating behaviors were not associated with prospective or retrospective 1-year BMI change (Additional file 3).
Conclusions
In this nationally representative cohort of U.S. adoles-cents, eating behaviors tracked strongly between 16–20 years of age, although small decreases were observed over this period in intake frequency of food groups
Table 4Estimates (βest ± SE) from linear generalized estimating equations examining associations of time-varying meal practices (days/week) with baseline weight statusa,b
Family meal Breakfast TV mealsc Fast food
Independent variables βest (SE) P βest (SE) P βest (SE) P βest (SE) P Wave −0.24 (0.03) <0.001 −0.18 (0.05) 0.001 −0.22 (0.04) <0.001 0.03 (0.02) 0.05 Baseline weight status (normal weight = reference)
Underweight −0.09 (0.36) 0.80 0.10 (0.63) 0.87 −0.56 (0.42) 0.20 0.03 (0.25) 0.91 Overweight −0.30 (0.12) 0.02 −0.42 (0.11) 0.001 0.10 (0.19) 0.60 0.04 (0.09) 0.69 Obese −0.28 (0.20) 0.17 −0.24 (0.12) 0.06 0.13 (0.19) 0.51 −0.10 (0.09) 0.26 Baseline height (cm) −0.008 (0.005) 0.17 0.006 (0.009) 0.48 −0.005 (0.008) 0.53 0.005 (0.004) 0.23 Sex (male = reference) −0.13 (0.10) 0.18 0.18 (0.14) 0.22 −0.23 (0.15) 0.13 −0.15 (0.05) 0.01 Race/ethnicity (Non-Hispanic White = reference)
Non-Hispanic Black −0.33 (0.15) 0.04 −0.30 (0.20) 0.13 1.47 (0.15) <0.001 0.54 (0.08) <0.001 Hispanic −0.16 (0.12) 0.20 0.05 (0.21) 0.80 0.26 (0.19) 0.19 0.13 (0.13) 0.33 Other 0.07 (0.21) 0.72 −0.13 (0.26) 0.63 −0.21 (0.37) 0.58 −0.02 (0.15) 0.88 Family Affluence Scored 0.07 (0.04) 0.046 0.01 (0.03) 0.68 −0.02 (0.04) 0.63 0.08 (0.02) 0.002 Parent education (<High school graduate = reference)
High school graduate 0.07 (0.17) 0.68 0.07 (0.25) 0.78 −0.12 (0.25) 0.64 0.05 (0.13) 0.68 Some college 0.10 (0.18) 0.60 −0.01 (0.28) 0.97 0.12 (0.29) 0.68 0.03 (0.12) 0.83 Bachelor’s degree 0.18 (0.23) 0.44 0.27 (0.29) 0.36 −0.26 (0.22) 0.25 −0.08 (0.11) 0.49 Graduate degree 0.29 (0.18) 0.13 0.50 (0.25) 0.07 −0.74 (0.21) 0.003 −0.17 (0.11) 0.16 Urbanicity (urban = reference)
Suburban 0.01 (0.15) 0.93 −0.03 (0.18) 0.88 0.03 (0.17) 0.86 0.02 (0.09) 0.81 Rural −0.05 (0.13) 0.70 0.07 (0.18) 0.71 0.01 (0.16) 0.95 −0.13 (0.11) 0.26 Vigorous physical activity (hours/week) 0.07 (0.02) <0.001 0.13 (0.02) <0.001 −0.05 (0.02) 0.03 −0.02 (0.01) 0.15
Residual intraclass correlatione 0.51 0.50 0.45 0.48
a
Weight status calculated according to Body Mass Index percentile cut-offs: <5 underweight;≥5, <85 normal weight;≥85, <95 overweight;≥95 obese b
Separate models examining each eating behavior outcome, adjusted for all independent variables c
Watching television during meals d
Ranging from 0 (low affluence) to 7 (high affluence) e
including fruit and vegetables, whole grains, sweet and salty snacks (snacks), sugar-sweetened carbonated bever-ages (soda), and of meal practices including family meals, watching television during meals (TV meals), and break-fast. In contrast, frequency of eating at a fast food restaur-ant (fast food) remained constrestaur-ant over follow-up. Trends were similar across baseline weight status, both sexes, and
all races/ethnicities. There was little evidence of associa-tions of these eating behaviors with weight outcomes.
This study provides unique findings regarding the consistency of eating behaviors in emerging adults in the United States assessed annually during the transition from adolescence to adulthood. Estimates of residual intraclass correlation coefficients suggest time-invariant
Table 6Estimates from linear generalized estimating equation models examining associations of time-varying body mass index (BMI, kg/m2) with time-varying food group intake frequencies (times/day)a
Model 1 Model 2 Model 3 Model 4
Independent variables βest (SE) P βest (SE) P βest (SE) P βest (SE) P
Fruit and vegetables (times/day) 0.09 (0.06) 0.16 – – –
Whole grains (times/day) – 0.14 (0.15) 0.35 – –
Soda (times/day) – – -0.15 (0.12) 0.23 –
Snacks (times/day) – – – -0.33 (0.12) 0.02
Wave (year) 0.49 (0.05) <0.001 0.47 (0.05) <0.001 0.48 (0.06) <0.001 0.40 (0.07) <0.001 Height (cm) 0.02 (0.02) 0.47 0.01 (0.02) 0.48 0.02 (0.02) 0.52 0.02 (0.02) 0.48 Sex (male=ref) 0.11 (0.52) 0.84 0.07 (0.54) 0.89 0.12 (0.58) 0.83 0.12 (0.58) 0.84 Race/ethnicity (Non-Hispanic White=ref)
Non=Hispanic Black 2.22 (0.82) 0.01 2.36 (0.86) 0.01 2.53 (0.94) 0.01 2.69 (0.95) 0.009 Hispanic 1.36 (0.57) 0.03 1.43 (0.59) 0.02 1.52 (0.60) 0.02 1.54 (0.61) 0.02 Other 0.46 (0.69) 0.51 0.48 (0.69) 0.49 0.87 (0.80) 0.29 0.84 (0.80) 0.30 Family Affluence Scoreb -0.22 (0.23) 0.33 -0.23 (0.23) 0.33 -0.24 (0.27) 0.37 -0.25 (0.26) 0.35
Parent education (<High school graduate=ref)
High school graduate 0.26 (0.66) 0.70 0.27 (0.65) 0.68 0.38 (0.68) 0.58 0.41 (0.68) 0.55 Some college 0.59 (0.65) 0.37 0.59 (0.65) 0.38 0.78 (0.71) 0.29 0.80 (0.70) 0.27 Bachelor’s degree -0.75 (0.83) 0.37 -0.78 (0.84) 0.36 -0.70 (0.88) 0.43 -0.65 (0.87) 0.46 Graduate degree 0.05 (0.96) 0.96 0.03 (0.99) 0.98 0.24 (1.02) 0.82 0.27 (1.02) 0.79 Urbanicity (urban=ref)
Suburban 1.27 (0.70) 0.08 1.26 (0.69) 0.08 1.46 (0.76) 0.07 1.48 (0.76) 0.06 Rural 1.07 (0.58) 0.08 1.07 (0.57) 0.07 1.24 (0.64) 0.06 1.28 (0.64) 0.06 Vigorous physical activity (hours/week) -0.13 (0.04) 0.006 -0.12 (0.04) 0.008 -0.15 (0.05) 0.006 -0.15 (0.05) 0.006
a
Each model examined associations of time-varying BMI outcome with a single food group, adjusted for wave, time-varying height and vigorous physical activity, and baseline sociodemographic characteristics
b
Ranging from 0 (low affluence) to 7 (high affluence)
Table 5Estimates from linear generalized estimating equations examining associations of time-varying food group intake frequencies (times/day) with time-varying meal practices (days/week)a
Food group intake frequency (times/day)
Fruit/vegetables Soda Whole grains Snacks
Independent variables βest (SE) P βest (SE) P βest (SE) P βest (SE) P Meal practice (days/week)
Family meals 0.33 (0.05) <0.001 −0.003 (0.02) 0.89 0.07 (0.02) <0.001 0.005 (0.02) 0.80 Breakfast 0.18 (0.03) <0.001 −0.05 (0.01) <0.001 0.04 (0.01) 0.001 −0.01 (0.009) 0.14 TV mealsb 0.001 (0.03) 0.96 0.08 (0.008) <0.001 0.02 (0.009) 0.02 0.07 (0.009) <0.001 Fast food −0.31 (0.04) <.001 0.24 (0.02) <0.001 −0.03 (0.02) 0.10 0.20 (0.03) <0.001
a
Estimates from separate models predicting time-varying intake frequency of fruit/vegetables, soda, whole grains, and sweet/salty snacks (times/day). Models adjusted for wave, time-varying body mass index, height, and vigorous physical activity (hours/day), and baseline sex, race/ethnicity, family affluence score (ranging from 0 = low affluence to 7 = high affluence), parent education, and urbanicity
b
subject-specific characteristics account for approximately 50 % of the variance of time-varying eating behaviors not explained by covariates [26]. Although estimates are some-what higher than previous reports, comparisons are diffi-cult given the differences in the assessed eating behaviors and the methods used to estimate tracking [9, 27]. In the ASH30 study of 198 participants in North East England, unadjusted Pearson correlation coefficients of baseline (mean age 11.6 years) and follow-up (mean age 32.5) intakes of fruit, vegetables, bread and starches ranged from r = 0.22 – 0.26 [9]. Similarly lower adjusted tracking coefficients were obtained by estimating associations of time-varying eating behaviors with baseline values for in-takes of fruit (β= 0.33, 95 % CI = 0.25, 0.41) and vegetables (β= 0.27, 95 % CI = 0.19, 0.36) in the Amsterdam Growth and Health Longitudinal Study, which followed partici-pants from age 13 to 36 years [27]. In addition to differ-ences in statistical methods for estimating tracking, the longer duration of follow-up (approximately 20 years), the younger and more developmentally distinct baseline age (11–13 years), and different environmental settings
of previous studies likely contribute to discrepancies with the current findings. The present study reports the first tracking estimates in emerging adults for meal practices including frequency of breakfast, family meals, TV meals and fast food, which were similar to those of food group intake frequencies. Taken together, the large amount of within-person correlation observed across a range of time-varying eating behaviors suggests the im-portance of early establishment of health-promoting eating behaviors.
Few prospective studies of U.S. adolescents have re-ported associations of eating behaviors with body weight in emerging adults. Despite modestly lower overall fre-quencies of snacks, breakfast and family meals in partici-pants with baseline overweight vs. normal weight, and of snacks and soda in obese participants, eating behavior trends during the transition to young adulthood did not vary by baseline weight status. Additionally, neither pro-spective nor retropro-spective 1-year BMI change was asso-ciated with any assessed eating behavior, indicating that BMI did not predict progression of eating behaviors, and
Table 7Estimates from linear generalized estimating equation models examining associations of time-varying body mass index (BMI, kg/m2) with time-varying meal practices (days/week)a
Model 5 Model 6 Model 7 Model 8
Independent variables βest (SE) P βest (SE) P βest (SE) P βest (SE) P
Family meals −0.12 (0.10) 0.24 – – –
Breakfast – −0.05 (0.05) 0.25 – –
Fast food restaurant – – −0.10 (0.11) 0.36 –
TV mealsb – – – 0.08 (0.05) 0.11
Wave (year) 0.45 (0.06) <0.001 0.48 (0.05) <0.001 0.49 (0.06) <0.001 0.47 (0.05) <0.001 Baseline height (cm) 0.01 (0.02) 0.58 0.02 (0.02) 0.47 0.01 (0.02) 0.54 0.02 (0.02) 0.47 Sex (male = ref) 0.01 (0.48) 0.98 0.09 (0.52) 0.87 0.05 (0.48) 0.92 0.11 (0.53) 0.83 Race/ethnicity (Non-Hispanic White = ref)
Non-Hispanic Black 2.04 (0.84) 0.02 2.36 (0.87) 0.01 1.97 (0.81) 0.02 2.30 (0.87) 0.02 Hispanic 1.27 (0.57) 0.04 1.43 (0.58) 0.02 1.27 (0.57) 0.04 1.42 (0.58) 0.02 Other 0.29 (0.65) 0.67 0.48 (0.68) 0.49 0.29 (0.66) 0.66 0.47 (0.68) 0.49 Family Affluence Scorec −0.20 (0.20) 0.32 −0.22 (0.23) 0.35 −0.21 (0.20) 0.31 −0.22 (0.23) 0.34 Parent education (<High school graduate = ref)
High school graduate 0.20 (0.65) 0.76 0.27 (0.65) 0.68 0.20 (0.65) 0.76 0.27 (0.65) 0.68 Some college 0.48 (0.65) 0.46 0.60 (0.65) 0.37 0.46 (0.65) 0.48 0.60 (0.66) 0.37 Bachelor’s degree −0.79 (0.79) 0.33 −0.75 (0.82) 0.37 −0.80 (0.80) 0.33 −0.73 (0.82) 0.38 Graduate degree 0.02 (0.95) 0.99 0.07 (0.97) 0.95 0.004 (0.97) >0.99 0.11 (0.96) 0.91 Urbanicity (urban = ref)
Suburban 1.10 (0.65) 0.10 1.23 (0.69) 0.08 1.10 (0.65) 0.10 1.23 (0.69) 0.09 Rural 0.93 (0.54) 0.10 1.03 (0.57) 0.08 0.93 (0.54) 0.10 1.05 (0.57) 0.08 Vigorous physical activity (hours/week) −0.11 (0.03) 0.002 −0.12 (0.04) 0.01 −0.12 (0.04) 0.003 −0.11 (0.04) 0.01
a
Separate models examined associations of time-varying BMI outcome with each meal practice, adjusted for wave, time-varying height and vigorous physical activity, and baseline sociodemographic characteristics
b
Watching television during meals c
that these eating behaviors did not predict BMI change. Results based on a similar eating behavior assessment from the multi-national Health Behaviour in School-Aged Children study indicated no cross-sectional associations of these eating behaviors with odds of being overweight in 11-, 13- and 15-year-olds other than an inverse association with breakfast frequency among males [28]. Other than an overall inverse association in the current study of time-varying BMI with time-time-varying snack frequency, eating behaviors were not related to time-varying BMI in longitu-dinal models, consistent with previously-reported null associations [8, 29–31]. The modest inverse association of BMI and snacks was opposite to the hypothesized direc-tion, given these snacks are energy dense foods [32] that would be hypothesized to contribute to positive energy balance [33]. Observational studies have produced mixed findings regarding associations of snacking with weight outcomes [34, 35], while limited experimental evidence suggests that altering snacking frequency has no noticeable impact on body weight [36]. It is unlikely that lower re-ported snack intake occurred as a behavioral response to high BMI, given the null association of snack intake with retrospective BMI change. Findings are also inconsistent with differential social desirability bias or underreporting by BMI, given that similar associations were not consist-ently observed for any other eating behavior. One consid-eration is whether the available metric for snacking (times/ day) was sufficient to capture energy intake from these foods, which would impact the ability to detect associa-tions with weight outcomes. Additional studies are needed to replicate this finding and explore mechanisms.
Despite the observed consistency of eating behaviors within participants, eating behaviors decreased modestly between late adolescence and young adulthood other than stable fast food frequency. The findings are somewhat dis-similar from others [6, 10], which have indicated an overall decrement in diet quality in the transition to young adult-hood. The decline in intake frequency of most food groups may reflect an overall decrease in food intake; however, this cannot be confirmed from these data. Trends observed in the present study do not suggest increased social desirabil-ity bias over time when considering that trends were simi-lar for both health-promoting and non-health-promoting eating behaviors as well as for vigorous physical activity. Additionally, the similar eating behavior trends observed by race/ethnicity and sex do not replicate previous findings [15, 37], and the more frequent intake of all food groups in non-Hispanic black versus non-Hispanic white participants does not reflect an overall discrepancy in diet quality, as previously reported [14, 15]. Vigorous physical activity, included as a covariate given its relationship with dietary intake and energy balance [23], was associated with more optimal eating behaviors, including more frequent fruit and vegetables and whole grains, less frequent soda and
snacks, more frequent breakfast and family meals, and fewer TV meals. Physical activity was similarly associated with lower soda and sugar-sweetened beverage intake in an international youth cohort [8]; however, the current find-ings represent the first reported associations of physical activity with a range of eating behaviors based on prospect-ive data from a nationally representatprospect-ive sample of U.S. adolescents. Although the magnitude of these associations appears small, the consistency of the association of vigor-ous physical activity with several more health-promoting eating behaviors warrants further investigation.
Findings indicate associations of greater frequency of family meals and breakfast with more optimal food group intake frequency (e.g., more fruit and vegetables and whole grains, less soda), and of increased fast food and TV meals with less optimal food group intake frequency (e.g., less fruit and vegetables, more soda and snacks). Similar associ-ations of fruit and vegetable intake with fast food intake, time watching television, and family meal frequency were observed in the Project EAT study, although these associa-tions were not statistically significant once models adjusted for baseline intake [38]. Similar associations have been observed of diet quality with TV meals [39, 40], breakfast [41, 42], fast food [43, 44] and family meals [12, 37] . These observations support findings from qualitative research indicating the importance of context-specific environmen-tal, social and situational influences on food choices [45], which are manifested by differences in dietary intake [46]. Experimental trials are needed to determine how modify-ing the food choices or frequency of specific eatmodify-ing con-texts could lead to improvements in overall diet quality.
observational design precludes inferences regarding caus-ation. Despite these limitations, this study has notable strengths, including a large, prospective, nationally repre-sentative sample assessed annually for four years, and suf-ficient sample size to obtain generalizable estimates for non-Hispanic white, non-Hispanic black and Hispanic American youth. The nearly 80 % retention rate at wave 4, the use of multiple imputation for missing data, and the ability to adjust for several hypothesized covariates support the internal validity of the findings. Finally, the prospective design enables examination of the tempor-ality of associations, an important advantage over cross-sectional designs.
The strong tracking of a range of eating behaviors from late adolescence to early adulthood observed in this nationally-representative sample suggests the potential for effective dietary interventions to have sus-tained impact during this critical developmental window. Other than stable fast food frequency, partici-pants reported modest decreases in a range of health-promoting and non-health-health-promoting eating behaviors, suggesting the need for additional research elucidating the intake patterns of emerging adults. Similar eating behavior trends regardless of baseline weight status and sociodemographic characteristics underscore the im-portance of supporting optimal eating behaviors in all subgroups. We found no support for hypothesized associ-ations of these eating behaviors with weight outcomes, in-dicating the need to investigate additional behavioral correlates in future research of weight outcomes in emer-ging adults. However, associations of meal practices (greater frequency of breakfast, family meals, and less fre-quent TV meals and fast food) with greater frequency of health-promoting food group intake suggest potential tar-get behaviors for intervention development. Additional studies are warranted using more precise measures of dietary intake to investigate to what extent these behaviors reflect overall diet quality.
Additional files
Additional file 1:“Estimates (β± SE) from linear generalized estimating equation models examining associations of eating behavior trends over time by baseline weight status”, contains results from models examining eating behavior trends by baseline weight status.(XLSX 10 kb)
Additional file 2:“Estimates (β± SE) from linear generalized estimating equation models examining associations of eating behavior trends over time by sex and race/ethnicity,”contains results from models examining eating behavior trends by sex and race/ethnicity.(XLSX 13 kb)
Additional file 3:“Estimates (β± SE) from linear generalized estimating equations predicting retrospective and prospective 1-year body mass index (BMI, kg/m2) change,”contains results from models examining longitudinal associations of eating behaviors with change in BMI.(XLSX 12 kb)
Abbreviations
BMI:Body mass index; Fast food: eating at a fast food restaurant; GEE: generalized estimating equations; Snacks: sweet and salty snacks; Soda: sugar-sweetened soda/pop; TV meals: watching television during meals.
Competing interests
The authors declare that they have no competing interests.
Authors’contributions
AC contributed to study design, created the multiple imputation datasets and participated in data interpretation. BG participated in study concept, data interpretation and helped draft the manuscript. DH participated in study design and conception, interpretation of results, and helped draft the manuscript. RI participated in study design and data interpretation. KL participated in study conception, data interpretation and helped draft the manuscript. DL contributed to study design and data interpretation. LL conceived the study, participated in study design, analyzed and interpreted the data and drafted the manuscript. BSM participated in study design, conception and data interpretation, and helped draft the manuscript. All authors critically reviewed the draft and approved the final manuscript.
Acknowledgments
This research (contract number HHSN267200800009C) was supported in part by the intramural research program of the Eunice Kennedy Shriver National Institute of Child Health and Human Development (NICHD), and the National Heart, Lung and Blood Institute (NHLBI), the National Institute on Alcohol Abuse and Alcoholism (NIAAA), and Maternal and Child Health Bureau (MCHB) of the Health Resources and Services Administration (HRSA), with supplemental support from the National Institute on Drug Abuse (NIDA). Intramural researchers were responsible for the design and conduct of the study; collection, management, analysis, and interpretation of the data; and preparation, review, or approval of the manuscript; and decision to submit the manuscript for publication.
Author details
1Division of Intramural Population Health Research, Eunice Kennedy Shriver
National Institute of Child Health and Human Development, 6100 Executive Blvd, North Bethesda, MD 20852, USA.2Department of Health and Exercise Science, Colorado State University, B 215E Moby Complex, Fort Collins, CO 80523, USA.3The CDM Group, 7500 Old Georgetown Road, North Bethesda,
MD 20814, USA.
Received: 1 July 2015 Accepted: 22 October 2015
References
1. Hiza H, Guenther PM, Rihane CI. Diet quality of children age 2–17 years as measured by the Healthy Eating Index-2010. Alexandria, VA: Nutrition Insight; 2013.
2. Nelson MC, Story M, Larson NI, Neumark‐Sztainer D, Lytle LA. Emerging adulthood and college‐aged youth: an overlooked age for weight‐related behavior change. Obesity. 2008;16(10):2205–11.
3. Gordon-Larsen P, Adair LS, Nelson MC, Popkin BM. Five-year obesity incidence in the transition period between adolescence and adulthood: the National Longitudinal Study of Adolescent Health. Am J Clin Nutr. 2004;80(3):569–75.
4. World Health Organization. Diet, nutrition and the prevention of chronic diseases. Report of a joint WHO/FAO expert consultation. Geneva 2003. Report No.: 916.
5. Srinivasan SR, Myers L, Berenson GS. Changes in metabolic syndrome variables since childhood in prehypertensive and hypertensive subjects: the Bogalusa Heart Study. Hypertension. 2006;48(1):33–9. doi:10.1161/01.HYP.0000226410.11198.f4.
6. Lien N, Lytle LA, Klepp K-I. Stability in consumption of fruit, vegetables, and sugary foods in a cohort from age 14 to age 21. Prev Med. 2001;33(3):217–26. 7. Kelder SH, Perry CL, Klepp KI, Lytle LL. Longitudinal tracking of adolescent
smoking, physical activity, and food choice behaviors. Am J Public Health. 1994;84(7):1121–6.
consumption of soft drinks and lifestyle factors and body weight. Public Health Nutr. 2005;8(02):149–57.
9. Lake AA, Adamson AJ, Craigie AM, Rugg-Gunn AJ, Mathers JC. Tracking of dietary intake and factors associated with dietary change from early adolescence to adulthood: the ASH30 study. Obes Facts. 2009;2(3):157–65. 10. Demory-Luce D, Morales M, Nicklas T, Baranowski T, Zakeri I, Berenson G.
Changes in food group consumption patterns from childhood to young adulthood: the Bogalusa Heart Study. J Am Diet Assoc. 2004;104(11):1684–91. 11. Deshmukh-Taskar PR, Radcliffe JD, Liu Y, Nicklas TA. Do breakfast skipping
and breakfast type affect energy intake, nutrient intake, nutrient adequacy, and diet quality in young adults? NHANES 1999–2002. J Am Coll Nutr. 2010;29(4):407–18.
12. Videon TM, Manning CK. Influences on adolescent eating patterns: the importance of family meals. J Adolesc Health. 2003;32(5):365–73. 13. French SA, Story M, Neumark-Sztainer D, Fulkerson JA, Hannan P. Fast food
restaurant use among adolescents: associations with nutrient intake, food choices and behavioral and psychosocial variables. Int J Obes.
2001;25:1823–33.
14. Mcnutt SW, Hu Y, Schreiber GB, Crawford PB, Obarzanek E, Mellin L. A longitudinal study of the dietary practices of black and white girls 9 and 10 years old at enrollment: the NHLBI Growth and Health Study. J Adolesc Health. 1997;20(1):27–37.
15. Sijtsma FP, Meyer KA, Steffen LM, Shikany JM, Van Horn L, Harnack L, et al. Longitudinal trends in diet and effects of sex, race, and education on dietary quality score change: the Coronary Artery Risk Development in Young Adults study. Am J Clin Nutr. 2012;95(3):580–6.
16. Nicklas TA, Baranowski T, Cullen KW, Berenson G. Eating patterns, dietary quality and obesity. J Am Coll Nutr. 2001;20(6):599–608.
17. Centers for Disease Control. YRBS Questionnaire Content - 1991–2015. 2014. http://www.cdc.gov/healthyyouth/yrbs/pdf/questionnaire/crosswalk_1991-2015.pdf. Accessed March 27 2015.
18. Vereecken CA, De Henauw S, Maes L. Adolescents’food habits: results of the Health Behaviour in School-aged Children survey. Br J Nutr. 2005;94(03):423–31.
19. Eaton DK, Olsen EOM, Brener ND, Scanlon KS, Kim SA, Demissie Z, et al. A comparison of fruit and vegetable intake estimates from three survey question sets to estimates from 24-h dietary recall interviews. J Acad Nutr Diet. 2013;113(9):1165–74.
20. Centers for Disease Control. A SAS Program for the 2000 CDC Growth Charts (ages 0 to <20 years). 2000. http://www.cdc.gov/nccdphp/dnpao/ growthcharts/resources/sas.htm. Accessed March 27 2015.
21. Barlow SE, Expert C. Expert committee recommendations regarding the prevention, assessment, and treatment of child and adolescent overweight and obesity: summary report. Pediatrics. 2007;120 Suppl 4:S164–92. doi:10.1542/peds.2007-2329C.
22. Currie C, Molcho M, Boyce W, Holstein B, Torsheim T, Richter M. Researching health inequalities in adolescents: the development of the Health Behaviour in School-Aged Children (HBSC) family affluence scale. Soc Sci Med. 2008;66(6):1429–36. doi:10.1016/j.socscimed.2007.11.024.
23. Westerterp KR. Physical activity, food intake, and body weight regulation: insights from doubly labeled water studies. Nutr Rev. 2010;68(3):148–54. 24. Little RK, Rubin DB. Statistical analysis with missing data. 2nd ed. Hoboken,
New Jersey: John Wiley & Sons; 2002.
25. Buuren S, Groothuis-Oudshoorn K. MICE: Multivariate imputation by chained equations. R Journal of Statistical Software. 2011;45:3.
26. Rabe-Hesketh S, Skrondal A. Multilevel and Longitudinal Modeling Using Stata. 2nd ed. College Station, TX: Stata Press; 2008.
27. te Velde SJ, Twisk JWR, Brug J. Tracking of fruit and vegetable consumption from adolescence into adulthood and its longitudinal association with overweight. Br J Nutr. 2007;98(2):431–8.
28. Haug E, Rasmussen M, Samdal O, Iannotti R, Kelly C, Borraccino A, et al. Overweight in school-aged children and its relationship with demographic and lifestyle factors: results from the WHO-Collaborative Health Behaviour in School-aged Children (HBSC) study. Int J Public Health. 2009;54 Suppl 2:167–79. doi:10.1007/s00038-009-5408-6.
29. Cutler GJ, Flood A, Hannan PJ, Slavin JL, Neumark-Sztainer D. Association between major patterns of dietary intake and weight status in adolescents. Br J Nutr. 2012;108(2):349–56.
30. Taveras EM, Rifas‐Shiman SL, Berkey CS, Rockett HR, Field AE, Frazier AL, et al. Family dinner and adolescent overweight. Obes Res. 2005;13(5):900–6.
31. Field AE, Gillman MW, Rosner B, Rockett HR, Colditz GA. Association between fruit and vegetable intake and change in body mass index among a large sample of children and adolescents in the United States. Int J Obes. 2003;27(7):821–6.
32. Piernas C, Popkin BM. Trends in snacking among US children. Health Aff (Millwood). 2010;29(3):398–404.
33. Rolls BJ. The relationship between dietary energy density and energy intake. Physiol Behav. 2009;97(5):609–15.
34. Field AE, Austin SB, Gillman MW, Rosner B, Rockett HR, Colditz GA. Snack food intake does not predict weight change among children and adolescents. Int J Obes. 2004;28(10):1210–6.
35. Bachman JL, Phelan S, Wing RR, Raynor HA. Eating frequency is higher in weight loss maintainers and normal-weight individuals than in overweight individuals. J Am Diet Assoc. 2011;111(11):1730–4. doi:10.1016/j.jada.2011.08.006. 36. Viskaal-van Dongen M, Kok FJ, de Graaf C. Effects of snack consumption for
8 weeks on energy intake and body weight. Int J Obes (Lond). 2010;34(2):319–26. doi:10.1038/ijo.2009.243.
37. Larson NI, Neumark-Sztainer D, Hannan PJ, Story M. Trends in adolescent fruit and vegetable consumption, 1999–2004: project EAT. Am J Prev Med. 2007;32(2):147–50.
38. Larson NI, Neumark-Sztainer DR, Harnack LJ, Wall MM, Story MT, Eisenberg ME. Fruit and vegetable intake correlates during the transition to young adulthood. Am J Prev Med. 2008;35(1):33–7. e3.
39. Falbe J, Willett WC, Rosner B, Gortmaker SL, Sonneville KR, Field AE. Longitudinal relations of television, electronic games, and digital versatile discs with changes in diet in adolescents. Am J Clin Nutr. 2014;100(4):1173–81. 40. Lipsky LM, Iannotti RJ. Associations of television viewing with eating
behaviors in the 2009 health behaviour in school-aged children study. Arch Pediatr Adolesc Med. 2012;166(5):465–72.
41. Lazzeri G, Pammolli A, Azzolini E, Simi R, Meoni V, de Wet DR, et al. Association between fruits and vegetables intake and frequency of breakfast and snacks consumption: a cross-sectional study. Nutr J. 2013;12(1):123.
42. Pedersen TP, Meilstrup C, Holstein BE, Rasmussen M. Fruit and vegetable intake is associated with frequency of breakfast, lunch and evening meal: cross-sectional study of 11-, 13-, and 15-year-olds. Int J Behav Nutr Phy. 2012;9(9):1–10. doi:Artn 9 10.1186/1479-5868-9-9.
43. Powell LM, Nguyen BT. Fast-food and full-service restaurant consumption among children and adolescents: Effect on energy, beverage, and nutrient intake. JAMA Pediatrics. 2013;167(1):14–20.
44. Schmidt M, Affenito SG, Striegel-Moore R, Khoury PR, Barton B, Crawford P, et al. Fast-food intake and diet quality in black and white girls: the National Heart, Lung, and Blood Institute Growth and Health Study. Arch Pediatr Adolesc Med. 2005;159(7):626–31.
45. Sobal J, Bisogni CA. Constructing food choice decisions. Ann Behav Med. 2009;38(1):37–46.
46. Kearney JM, Hulshof KF, Gibney MJ. Eating patterns–temporal distribution, converging and diverging foods, meals eaten inside and outside of the home–implications for developing FBDG. Public Health Nutr. 2001;4(2B):693–8.
47. Thompson FE, Subar AF. Dietary assessment methodology. In: Coulston AM, Boushey CJ, editors. Nutrition in the Prevention and Treatment of Disease. 2nd ed. Burlington, MA: Elsevier Academic Press; 2008. p. 3–39. 48. Goodman E, Hinden BR, Khandelwal S. Accuracy of teen and parental
reports of obesity and body mass index. Pediatrics. 2000;106(1):52–8. 49. Pietrobelli A, Faith MS, Allison DB, Gallagher D, Chiumello G, Heymsfield SB.
Body mass index as a measure of adiposity among children and adolescents: a validation study. J Pediatr. 1998;132(2):204–10.