VOLUME 36, ARTICLE 18, PAGES 557
−
588
PUBLISHED 10 FEBRUARY 2017
http://www.demographic-research.org/Volumes/Vol36/18/ DOI: 10.4054/DemRes.2017.36.18
Research Article
Domestic division of labour and fertility
preference in China, Japan, South Korea,
and Taiwan
Man-Yee Kan
Ekaterina Hertog
This publication is part of the Special Collection on “Domestic Division of Labour and Fertility Choice in East Asia,” organized by Guest Editors Ekaterina Hertog and Man-Yee Kan.
©2017 Man-Yee Kan & Ekaterina Hertog.
This open-access work is published under the terms of the Creative Commons Attribution NonCommercial License 2.0 Germany, which permits use, reproduction & distribution in any medium for non-commercial purposes, provided the original author(s) and source are given credit.
1 Background and motivation 558
2 Previous research and theoretical perspectives 559
2.1 New home economics 559
2.2 Gender revolution framework 560
2.3 Fathers’ participation in domestic work in East Asia and the link to fertility
562
3 Research hypotheses 563
4 Data and methods 564
5 Key variables and measures 565
5.1 Housework participation 566
5.2 Housework sharing 566
5.3 Fertility preference 566
6 Results 567
6.1 Descriptive findings 567
6.1.1 Housework participation 567
6.1.2 Actual and ideal numbers of children 569
6.2 Multivariate analyses 570
6.2.1 Is there a link between men’s housework participation and the current number of children in the family?
570
6.2.2 Are housework participation and sharing associated with aspiring for more children?
575
7 Discussion and conclusion 582
Domestic division of labour and fertility preference in China, Japan,
South Korea, and Taiwan
Man-Yee Kan1
Ekaterina Hertog2
Abstract
BACKGROUND
Research on Western countries suggests that how couples share housework responsibilities has a significant impact on their fertility choices. The gender revolution framework offers an explanation for this relationship, but so far its applicability has not been tested on non-Western cases.
OBJECTIVE
This paper investigates whether male housework participation is associated with the number of children married couples aspire to in China, Japan, South Korea, and Taiwan.
METHODS
Using data from the East Asian Social Survey 2006, we provide a descriptive account of housework participation by gender and country and actual and ideal numbers of children by country. This is followed by OLS regression models testing the associations between male and female housework contributions and the ideal numbers of children.
RESULTS
In all four countries, women do much more housework than men. For men, there is no consistent pattern across the four countries linking household participation and fertility preferences. The pattern for women, by contrast, is consistent across the cases: husbands’ greater involvement in housework is associated with wives’ desire for more children.
CONCLUSIONS
Theoretically, our findings suggest that low fertility in East Asia is linked to women’s heavy housework burden. Our findings suggest that the gender revolution framework offers the best explanation for East Asian childbearing trends and that low fertility trends in the region are likely to persist.
1
University of Oxford, United Kingdom. E-Mail:[email protected].
CONTRIBUTION
On a theoretical level this paper is the first to widen the framework for understanding current fertility trends in East Asia to include domestic work participation. On an empirical level this is the first paper to test the link between fathers’ housework contributions and fertility in East Asia.
1. Background and motivation
Below-replacement fertility levels have become a typical characteristic of the modern industrialised world (Billari and Kohler 2004; Frejka and Ross 2001; Kohler, Billari, and Ortega 2002; McDonald 2000a, 2000b, 2006). It has been noted, however, that at least in OECD countries two distinct patterns of fertility behaviour can be seen. A number of countries, especially in southern Europe and East Asia, have become characterised by very low fertility levels. This, in the absence of a large number of immigrants, will have a devastating effect on future labour supply, just as these societies are rapidly ageing, and may lead to a host of associated social problems. Another group of countries, after a period of fluctuation, have generally settled to fertility close to replacement levels (Goldscheider, Bernhardt, and Lappegard 2015; McDonald 2009; Sullivan, Billari, and Altintas 2014).
In recent years gender roles and relations have emerged as central factors behind these divergent patterns (Esping-Andersen and Billari 2015). Historically, growing female education and labour market participation were held responsible for falling fertility rates across the world (Brewster and Rindfuss 2000). This argument was supported by the documented negative correlation between a country’s fertility rate and rate of female labour force participation. This correlation, however, was reversed by the 1990s (Brewster and Rindfuss 2000: 277‒278). A growing body of literature is now documenting fertility turnaround in developed countries, where greater gender equality, both in the labour market and at home, is linked to the reversal of declining fertility (Goldscheider, Bernhardt, and Branden 2013; Goldscheider, Bernhardt, and Lappegård 2015; McDonald 2000a; Myrskylae, Kohler, and Billari 2009; Neyer, Lappegard, and Vignoli 2013; Sullivan et al. 2014). Increased fathers’ contributions to domestic work play an important role in achieving greater equality at home. Sullivan, Billari, and Altintas (2014) observe that in the European context the largest recent fertility increases have taken place in low fertility countries experiencing the biggest rise in fathers’ contributions to domestic work.
evidence about the effect of men’s contributions to domestic work on fertility outside the Western context, but a number of parallels can be drawn between the low fertility southern European countries, such as Italy, Spain, and Portugal, and East Asian countries. These include low public spending on family benefits, limited childcare provision (especially in early years), and statutory paid paternity leave that is either not available or available only for a few days (An and Peng 2016; Gauthier 2016; Koslowski, Blum, and Moss 2016). The similarities were even more pronounced in the early 2000s (Gauthier 2015). Such parallels make this an area ripe for research.
In this paper we will start by outlining theoretical perspectives on the association between gender roles in families and fertility rates. Then we will document public attitudes towards women’s and men’s family roles in China, Taiwan, Japan, and South Korea and describe the actual domestic division of labour practices in the four countries. Finally, we will test the association between a) housework participation of married men and women and actual number of children, and b) domestic division of labour and the ideal number of children.
2. Previous research and theoretical perspectives
Two theoretical perspectives offer predictions about the links between gender roles and fertility: Gary Becker’s new home economics (Becker 1993) and the gender revolution framework (Goldscheider et al. 2015).
2.1 New home economics
The new home economics theory (NHET) links women’s growing economic independence to lower fertility rates. Women’s earning power, it is argued, reduces the gains from marriage based on the traditional division of labour within families and increases the cost of childbearing via women’s forgone earning opportunities (Becker 1993; see also the discussion in Esping-Andersen and Billari 2015). At least until the 1990s the retreat from childbearing in the industrialised countries generally coincided with the rise in female labour force participation, lending credence to the hypothesis (Goldscheider, Bernhardt, and Lappegård 2015). Within the framework of the NHET the interest in men’s role within families was limited and narrowly focused on their success as breadwinners.
countries with greater women’s labour market participation tend to be characterised by higher fertility (Brewster and Rindfuss 2000; Esping-Andersen and Billari 2015). On a micro level, the causal link between low fertility and women’s labour market participation has never been firmly established (Brewster and Rindfuss 2000) and several new studies document at least a partial reversal in the association between women’s employment status and the number of children they have (e.g., Andersson and Scott 2005; Goldscheider, Bernhardt, and Brandén 2013; Hazan and Zoabi 2015).
It has been argued that the changing relationship between women’s employment and fertility is rooted in the changing relationships between genders at a time when women have largely caught up with or even surpassed men in educational achievement and their employment has become ubiquitous and expected (Goldscheider, Bernhardt, and Lappegård 2015). A number of scholars have concluded that the NHET cannot account for these new trends. Fertility research requires a new theoretical framework which takes into account the role of increasing normalisation of gender egalitarianism (e.g., Esping-Andersen and Billari 2015; Goldscheider, Bernhardt, and Lappegård 2015).
2.2 Gender revolution framework
willing to have more children. As is evident from the overview of empirical studies below, existing research finds evidence of both mechanisms at work.
So far, evidence supporting the gender revolution framework comes exclusively from Western countries, although its proponents expect broader applicability (Goldscheider, Bernhardt, and Lappegård 2015: 209). Such applicability, however, cannot be taken for granted, as regional, institutional, and cultural backgrounds can lead to different mechanisms governing family behaviours, including fertility decisions (Balbo, Billari, and Mills 2013). Scholars have long portrayed East Asian family patterns as significantly different from those observed in Europe and North America (for a summary see Raymo et al. 2015).
Until recently, on the micro level family trends in East Asia and the more conservative European countries have been generally consistent with the NHET (Ono 2003) or with the first stage of the gender revolution. In their 2014 study Sullivan, Billari, and Altintas (2014) documented a connection between fertility behaviour and fathers’ increasing participation in unpaid work in traditional European societies, such as Italy, Spain, and Germany, indicating that the gender revolution framework is likely to be more useful for understanding the future of fertility trends in these countries.
Determining which framework offers a better fit for understanding how fertility is affected by husbands’ contributions to domestic work and the way the overall burden of housework and childcare is divided within a couple is complicated by the fact that this relationship has proved to be complex and to vary across societies. Cooke (2004, 2009) documents a positive effect of greater equality in sharing childcare on fertility in Germany, Italy, and Spain, but finds no effect of the sharing of housework on fertility in these countries. In Australia and Finland the amount of housework women have to perform routinely negatively impacts fertility, while the extent of sharing within the family, or the hours fathers spend on housework, do not (Craig and Siminski 2010, 2011). A heavy burden of household-related work has also been shown to discourage women from having children in Italy and the Netherlands (Mills et al. 2008). Kaufman (2000) shows that more egalitarian men want to have more children. Aassve, Fuochi, Mencarini, and Mendola (2015) demonstrate that across Europe among couples with more egalitarian gender attitudes and more egalitarian gender division of domestic labour both men and women are more likely to have a second child. Using US data, Torr and Short (2004) find a U-shaped relationship, with the least and the most egalitarian couples being more likely to have a second child.
2014). This paper seeks to establish whether East Asian societies can be located within these wider trends.
Whether it is the NHET or the gender revolution framework that fits the evidence for a given society better has significant implications for a country’s immediate and long-term demographic outlook. The NHET is ultimately pessimistic about marriage prospects and about fertility as women continue to participate in the labour market and traditional divisions of labour within families becomes less viable. The gender revolution framework associates higher fertility rates with greater gender equality at work and in the domestic sphere, thus offering a more optimistic perspective. Understanding the gender division of labour in East Asia and the link between fathers’ contributions to domestic work and fertility is important both for testing the wider applicability of the gender revolution framework and for gaining a better insight into the near and longer-term demographic outlook for the region.
After reviewing trends of fathers’ participation in housework and childcare in contemporary East Asia, we propose hypotheses about how the balance of contributions to housework within the family affects fertility. We then turn to our data to provide a more detailed description of fathers’ involvement in housework than is currently available across the four East Asian countries. This descriptive account is followed by a statistical analysis of how the balance of housework contributions within a family affects the couples’ current number of children and their perceptions of the ideal number of children.
2.3 Fathers’ participation in domestic work in East Asia and the link to fertility
East Asia focuses on the Confucian family model and the gender inequality in East Asian societies as key contributors to their dim demographic outlook. Finally, McDonald (2009) suggests that the difficulties women face in balancing work and family in the environment of gender inequality and the difficulties young men and women face in achieving economic security are the key mechanisms behind the low fertility in East Asia.
As is evident from the above summary, the domestic role of East Asian husbands and fathers has attracted very limited attention in research on East Asian fertility trends. There is, however, ample descriptive evidence about the division of labour within families in East Asia. Women still perform the bulk of housework in Japan, South Korea, Hong Kong, China and Taiwan (Kan and He 2014; Kim 2013; Sechiyama 2013; Ting 2013; Tsuya et al. 2012; Yu and Xie 2012) and this has not changed much over the past two decades (Sechiyama 2013). In Japan and South Korea women seem to spend much more time on housework than women in Taiwan and China (Sechiyama 2013: 116). Women’s share of domestic labour is also very large: women contribute close to 90% (80% for working women) of all the time spent in Japan and Korea and around 80% (70% for working women) of the time in Taiwan (Kim 2013: 23). This huge inequality in gender roles is at odds with modern attitudes towards the appropriate division of labour in families. Two recent studies (Oshio, Nozaki, and Kobayashi 2013; Qian and Sayer 2016) suggest that this imbalance may impact marital satisfaction in East Asian families. Oshio, Nozaki, and Kobayashi (2013) argue that there is a negative relationship between wives’ marital satisfaction and the burden of housework they have to shoulder in Japan, South Korea, and China. Qian and Sayer (2016) document relatively higher levels of gender equality and marital satisfaction in Taiwan and China, compared to Japan and South Korea, but conclude that the specific association between marital satisfaction and equality in housework sharing is complex, varies by gender, and is mediated by the country context in these societies.
In sum, existing research documents persistently low fertility rates in China, Japan, South Korea, and Taiwan. It has also noted huge gender imbalances in domestic work and the (often negative) effect these imbalances have on marital satisfaction in these countries. The effects that the household division of labour may have on other family outcomes, especially the number of children or fertility intentions, however, are left mostly unexamined.
3. Research hypotheses
Hypothesis 1: Husbands in couples where men do more housework and the total housework load is more equally shared show higher fertility intentions.
Hypothesis 2: Wives in couples where women contribute less to housework and the housework is more equally shared show higher fertility intentions.
Hypothesis 3: Given that women bear the brunt of the conflicts between labour market work and domestic work, we expect that the association between domestic division of labour and fertility intentions is stronger for women than for men.
Support for these hypotheses would confirm the applicability of the gender revolution framework in East Asian cases. It would also suggest that as these countries move from the first to the second stage of the gender revolution the very low and currently falling fertility rates may stabilise and even reverse. Lack of support for these hypotheses would suggest that at least at the moment the countries observed here remain in the first stage of the gender revolution. In this case the NHET remains a useful framework for understanding fertility trends in East Asia, as suggested by previous research.
4. Data and methods
sample definition enabled us to focus on families where the difficulties of balancing paid and unpaid labour are likely to be felt most keenly. In addition, advances in medical technology mean that these families are still potentially able to have children.
As with many cross-sectional surveys in the developed countries these days, the EASS is characterised by a modest response rate. In the original sample the response rate was 38.5%, 59.8%, 65.7%, and 41.8% for China, Japan, Korea, and Taiwan respectively. Response rates in this range are typical for industrialised countries. Our confidence that the bias stemming from these low response rates is minimal is bolstered by the work of Rindfuss et al. (2015), which finds little evidence of bias from low response rates in a multivariate analysis.
We will start by describing patterns of housework participation, as well as actual and ideal numbers of children by gender and country. To test hypotheses 1 to 3, we will then first run OLS regressions to test the correlation between a) housework participation and sharing with the number of children, and b) housework participation and sharing with the ideal number of children. We will then test the robustness of our findings with ordered logit models. The first set of regression models on housework participation predicted by the current number of children aims to show whether child-rearing will put different levels of domestic burdens on men and women. The second set of regression models on the ideal number of children predicted by the domestic division of labour aims to test if fertility preference is associated to varying degrees with men’s and women’s domestic labour participation.
5. Key variables and measures
5.1 Housework participation
Respondents were asked about the frequency with which they undertook three household chores: meal preparation, doing the laundry, and domestic cleaning. They chose one of seven answers: “never”, “about once a year”, “several times a year”, “about once a month”, “about once a week”, “several times a week”, and “almost every day.” We recoded the answers into four categories and allocated scores between 1 and 4 respectively to “less than once a week,” “once a week,” “several times a week,” and “every day.” We then constructed a scale of housework participation (values ranging from 3 to 12), measured by the sum of the frequency in undertaking the three household chores.
5.2 Housework sharing
We define the sharing of housework as an individual’s own score of housework participation minus the spouse’s participation score. The sharing score ranges from –9 to 9, where higher values indicate a larger share of housework and 0 is an equal share.
5.3 Fertility preference
In EASS there is no direct measure of fertility preference. We instead use the respondents’ general perception of the ideal number of children to measure fertility plans and preferences. Past research has shown that preference measures are not ideal for predicting fertility behaviour, “as they are subject to downward or upward adjustments over the life course (Liefbroer 2009; Iacovou and Tavares 2011)” (Balbo, Billari, and Mills 2013: 5). As we are interested in the impact of the current domestic division of labour on fertility preferences at a particular point in time, this is less of a concern.
6. Results
6.1 Descriptive findings
6.1.1 Housework participation
As can been seen in Tables 1 and 2, Japanese men are the least involved in meal preparation: 80% report cooking less than once a week and only 2% say they cook every day. Of the rest, 60% of men in Korea, 59% in Taiwan, and 49% in China reported preparing meals less than once a week. As Japanese men rarely cook, Japanese women end up cooking more often than women from the other three countries: 91% of them reported cooking daily. In China and South Korea just over 80% of women prepare meals every day and just over 90% of them do it at least several times a week. Women in Taiwan cook the least often: 16% report doing it less than once a week and only 47% report doing it daily.
Table 1: Men’s participation in domestic work by country
China Japan South Korea Taiwan Meal preparation
Not often 48.5% 79.9% 60.1% 58.8%
Once a week 20.5% 16.3% 16.2% 12.2%
Several times a week 19.3% 7.8% 18.8% 19.0%
Every day 11.6% 2.0% 4.8% 10.0%
Laundry
Not often 48.5% 77.0% 64.4% 56.9%
Once a week 20.5% 7.8% 15.5% 13.2%
Several times a week 19.3% 10.8% 15.9% 17.4%
Every day 11.6% 4.4% 4.1% 12.5%
Domestic cleaning
Not often 37.8% 69.6% 38.4% 53.1%
Once a week 18.4% 20.1% 30.6% 20.9%
Several times a week 27.1% 6.9% 21.4% 15.8%
Every day 16.7% 3.4% 9.6% 10.3%
Table 2: Women’s participation in domestic work by country
China Japan South Korea Taiwan Meal preparation
Not often 3.9% 0.4% 1.9% 16.1%
Once a week 2.2% 1.6% 3.9% 13.8%
Several times a week 10.5% 7.1% 10.6% 23.4%
Every day 83.4% 90.9% 83.6% 46.7%
Laundry
Not often 2.9% 0.0% 1.7% 4.9%
Once a week 6.6% 2.0% 6.4% 5.3%
Several times a week 33.2% 11.0% 29.7% 26.3%
Every day 57.3% 87.1% 62.2% 63.5%
Domestic cleaning
Not often 2.2% 3.1% 1.9% 8.6%
Once a week 4.5% 17.6% 6.7% 24.3%
Several times a week 24.0% 32.2% 20.8% 25.3%
Every day 69.3% 47.1% 70.6% 41.8%
Data source: East Asian Social Survey 2006.
Laundry work is also mostly women’s responsibility. Again, Japanese men do the least: 77% report doing it “not often,” (i.e., less than once a week). In South Korea, the corresponding figure is 64%, in Taiwan 57%, and in China just under 50%. In China, Taiwan, and South Korea around 60% of women do laundry on a daily basis and over 90% of them do it several times a week or more often. Japanese women do the most laundry. Almost 90% of them do laundry on a daily basis and 98% do it several times a week.
In all the four countries, women undertake the bulk of the housework. The most gendered patterns of division of domestic labour are observed in Japan, where women do the major share of housework and men do very little.
6.1.2 Actual and ideal numbers of children
As shown in Table 3, there is a gap between the mean of the actual number of children and that of the ideal number of children. The gap is the highest in Japan and Korea (~0.6). The figures are similar for men and women. Chinese couples both have and desire fewer children than couples in other countries, probably because of the state-enforced one-child policy (formally abolished in 2016, long after the data used in this analysis was collected), which made it difficult for couples to choose to have more than one child.
Table 3: Men’s and women’s actual and ideal numbers of children by country
China (sd) Japan (sd) South Korea (sd) Taiwan (sd) Men
Number of children 1.45 (0.68) 1.97 (0.74) 1.91 (0.65) 2.05 (0.76)
Ideal number of children 1.71 (0.66) 2.54 (0.65) 2.62 (0.91) 2.29 (0.74)
Women
Number of children 1.47 (0.74) 2.01 (0.72) 1.93 (0.58) 2.15 (0.85)
Ideal number of children 1.70 (0.57) 2.65 (0.65) 2.55 (0.89) 2.32 (0.72)
Data source:East Asian Social Survey 2006.
Table 4: Men’s and women’s satisfaction with the current number of children by country
China Japan South Korea Taiwan Men
Want fewer 9.9% 5.8% 6.1% 14.9%
Satisfied 51.9% 39.5% 39.3% 46.3%
Want more 38.2% 54.7% 54.7% 38.8%
Women
Want fewer 10.2% 6.6% 9.5% 17.7%
Satisfied 52.3% 37.6% 36.9% 48.0%
Want more 37.5% 55.8% 53.6% 34.3%
Data source:East Asian Social Survey 2006.
6.2 Multivariate analyses
6.2.1 Is there a link between men’s housework participation and the current number of children in the family?
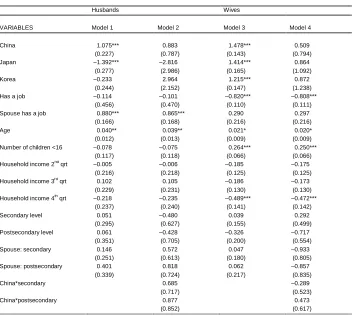
Table 5 presents OLS regression models that have housework participation of men and women as the dependent variable. In Model 1, compared with men in Taiwan, Chinese men do more housework and those in Japan do less (the coefficients are 1.08 and –1.39 respectively, indicating relative differences on the participation scale from 3 to 12). Men in South Korea also do less housework than Taiwanese men, but the coefficient is small and insignificant. On the other hand women in China, Japan, and South Korea undertake more housework than women in Taiwan, holding other variables constant (the coefficients are 1.48, 1.41, and 1.22 respectively: see Model 3).
In all four countries, both husbands’ and wives’ levels of housework participation are associated with wives’ employment status only. Women decrease their participation in housework if they have a job (the coefficient is ‒0.82) and their husbands increase their participation (the coefficient is 0.88). The coefficients of husbands’ employment status are small and insignificant in both partners’ models.
2 and 4 control for the interactions between individuals’ educational level and country. This does not change the association between the number of children and housework participation. However, somewhat unexpectedly, Korean men whose wives have postsecondary educational level partake in housework less frequently than men whose wives completed only secondary education or less. We also included interactions between country and the number of children in separate analyses (not shown), but no significant differences between the countries were found. These findings show that housework is primarily “women’s work” in all four countries. Having children increases the amount of domestic work for women but not for men, meaning that it is mostly women who have to balance the demands of employment and domestic work, in line with NHET and the first stage of the gender revolution.
Table 5: OLS regression models of housework participationa
Husbands Wives
VARIABLES Model 1 Model 2 Model 3 Model 4
China 1.075*** 0.883 1.478*** 0.509 (0.227) (0.787) (0.143) (0.794) Japan ‒1.392*** ‒2.816 1.414*** 0.864
(0.277) (2.986) (0.165) (1.092) Korea ‒0.233 2.964 1.215*** 0.872
(0.244) (2.152) (0.147) (1.238) Has a job ‒0.114 ‒0.101 ‒0.820*** ‒0.808***
(0.456) (0.470) (0.110) (0.111) Spouse has a job 0.880*** 0.865*** 0.290 0.297
(0.166) (0.168) (0.216) (0.216) Age 0.040** 0.039** 0.021* 0.020* (0.012) (0.013) (0.009) (0.009) Number of children <16 ‒0.078 ‒0.075 0.264*** 0.250***
(0.117) (0.118) (0.066) (0.066) Household income 2nd qrt ‒0.005 ‒0.006 ‒0.185 ‒0.175
(0.216) (0.218) (0.125) (0.125) Household income 3rd qrt 0.102 0.105 ‒0.186 ‒0.173
(0.229) (0.231) (0.130) (0.130) Household income 4th qrt ‒0.218 ‒0.235 ‒0.489*** ‒0.472***
(0.237) (0.240) (0.141) (0.142) Secondary level 0.051 ‒0.480 0.039 0.292
(0.295) (0.627) (0.155) (0.499) Postsecondary level 0.061 ‒0.428 ‒0.326 ‒0.717
(0.351) (0.705) (0.200) (0.554) Spouse: secondary 0.146 0.572 0.047 ‒0.933
(0.251) (0.613) (0.180) (0.805) Spouse: postsecondary 0.401 0.818 0.062 ‒0.857
(0.339) (0.724) (0.217) (0.835) China*secondary 0.685 ‒0.289
(0.717) (0.523) China*postsecondary 0.877 0.473
Table 5: (Continued)
Husbands Wives
VARIABLES Model 1 Model 2 Model 3 Model 4 Japan*secondary 0.810 ‒1.110 (1.380) (1.134) Japan*postsecondary 0.334 ‒0.008
(1.450) (1.186) Korea*secondary 1.654 0.708
(1.784) (1.095) Korea*postsecondary 1.652 1.467
(1.825) (1.138) China*spouse secondary ‒0.489 1.046
(0.675) (0.828) China*spouse postsecondary ‒0.645 0.998
(0.899) (0.886) Japan*spouse secondary 0.985 1.190
(2.710) (1.186) Japan*spouse postsecondary 0.743 1.277
(2.766) (1.223) Korea*spouse secondary ‒5.023* ‒0.554
(2.124) (1.584) Korea*sSpouse postsecondary ‒4.706* ‒0.704
(2.186) (1.618) Constant 3.366*** 3.479*** 8.881*** 9.810***
(0.762) (0.971) (0.456) (0.857)
Observations 1,214 1,214 1,473 1,473 R-squared 0.126 0.132 0.161 0.171 Adj. R-squared 0.115 0.113 0.153 0.156
Data source: East Asian Social Survey 2006. Standard errors in parentheses.
Notes: aThe dependent variable ranges from 3 to 12, which is added by the frequency of undertaking three household chores: meal preparation, doing the laundry, and domestic cleaning. Scores 1 to 4 are given respectively to “less than once a week,” “several times a week,” “once a week,” and “every day” to each item.
The reference categories are: Taiwan, Household income 1st qrt, Has a job, Spouse has a job, Below secondary educational level,
and Spouse below secondary educational level. *** p<0.001, ** p<0.01, * p<0.05, + p<0.1.
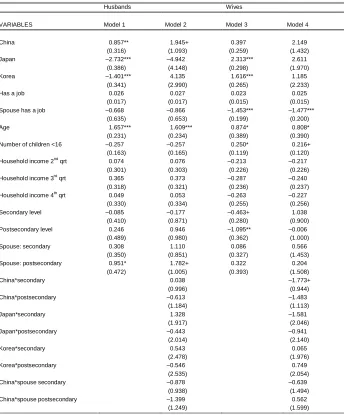
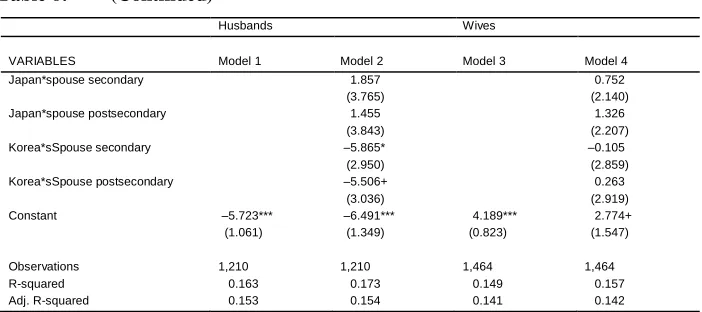
associated with a lower share of housework (‒0.46 and ‒1.10), while men share more housework if their wives have a postsecondary educational level (0.95).
Table 6: OLS regression models of degree of sharing in houseworka
Husbands Wives
VARIABLES Model 1 Model 2 Model 3 Model 4
China 0.857** 1.945+ 0.397 2.149 (0.316) (1.093) (0.259) (1.432) Japan ‒2.732*** ‒4.942 2.313*** 2.611
(0.386) (4.148) (0.298) (1.970) Korea ‒1.401*** 4.135 1.616*** 1.185
(0.341) (2.990) (0.265) (2.233) Has a job 0.026 0.027 0.023 0.025
(0.017) (0.017) (0.015) (0.015) Spouse has a job ‒0.668 ‒0.866 ‒1.453*** ‒1.477***
(0.635) (0.653) (0.199) (0.200) Age 1.657*** 1.609*** 0.874* 0.808* (0.231) (0.234) (0.389) (0.390) Number of children <16 ‒0.257 ‒0.257 0.250* 0.216+ (0.163) (0.165) (0.119) (0.120) Household income 2nd qrt 0.074 0.076 ‒0.213 ‒0.217
(0.301) (0.303) (0.226) (0.226) Household income 3rd qrt 0.365 0.373 ‒0.287 ‒0.240
(0.318) (0.321) (0.236) (0.237) Household income 4th qrt 0.049 0.053 ‒0.263 ‒0.227
(0.330) (0.334) (0.255) (0.256) Secondary level ‒0.085 ‒0.177 ‒0.463+ 1.038
(0.410) (0.871) (0.280) (0.900) Postsecondary level 0.246 0.946 ‒1.095** ‒0.006
(0.489) (0.980) (0.362) (1.000) Spouse: secondary 0.308 1.110 0.086 0.566
(0.350) (0.851) (0.327) (1.453) Spouse: postsecondary 0.951* 1.782+ 0.322 0.204
(0.472) (1.005) (0.393) (1.508) China*secondary 0.038 ‒1.773+ (0.996) (0.944) China*postsecondary ‒0.613 ‒1.483
(1.184) (1.113) Japan*secondary 1.328 ‒1.581
(1.917) (2.046) Japan*postsecondary ‒0.443 ‒0.941
(2.014) (2.140) Korea*secondary 0.543 0.065
(2.478) (1.976) Korea*postsecondary ‒0.546 0.749
(2.535) (2.054) China*spouse secondary ‒0.878 ‒0.639
(0.938) (1.494) China*spouse postsecondary ‒1.399 0.562
Table 6: (Continued)
Husbands Wives
VARIABLES Model 1 Model 2 Model 3 Model 4 Japan*spouse secondary 1.857 0.752 (3.765) (2.140) Japan*spouse postsecondary 1.455 1.326
(3.843) (2.207) Korea*sSpouse secondary ‒5.865* ‒0.105
(2.950) (2.859) Korea*sSpouse postsecondary ‒5.506+ 0.263
(3.036) (2.919) Constant ‒5.723*** ‒6.491*** 4.189*** 2.774+ (1.061) (1.349) (0.823) (1.547)
Observations 1,210 1,210 1,464 1,464 R-squared 0.163 0.173 0.149 0.157 Adj. R-squared 0.153 0.154 0.141 0.142
Data source: East Asian Social Survey 2006. Standard errors in parentheses.
a
The dependent variable is the degree of sharing in housework that ranges from –9 to 9, where higher values indicate a larger share of housework and 0 is an equal share with the spouse. Respondents were asked about their frequency of undertaking three household chores: meal preparation, doing the laundry, and domestic cleaning. Scores 1 to 4 are given respectively to “less than once a week,” “several times a week,” “once a week,” and “every day” to each item. The degree of sharing equals own domestic work score minus spouse’s domestic work score.
The reference categories are: Taiwan, Household income 1st qrt, Has a job, Spouse has a job, Below secondary educational level, and Spouse below secondary educational level.
*** p<0.001, ** p<0.01, * p<0.05, + p<0.1.
Models 2 and 4 in Table 6 include the interactions between country and both partners’ educational level. For Korean men, the pattern is the opposite of the general one: those with educated wives undertake a lower share of housework. The coefficients of the interactions between Korea and spouse’s educational levels are negative (‒5.87 and ‒5.51) and the sizes of these coefficients are bigger than the main effects of spouse’s educational levels. That is, in Korea wives’ higher education is associated with a lower share of housework for husbands.
6.2.2 Are housework participation and sharing associated with aspiring for more children?
Results in Tables 5 and 6 show that having more children increases primarily women’s domestic burden. Thus unequal domestic division of labour is likely to mostly affect women’s fertility preferences. We test this association in the following tables. Table 7 presents OLS regression models with the ideal number of children as the dependent variable.
Table 7: OLS regression models of the ideal number of children on the frequency of contributions to housework and other characteristics
Husbands Wives
VARIABLES Model 1 Model 2 Model 3 Model 4
China ‒0.425*** 0.055 ‒0.569*** ‒0.823** (0.059) (0.250) (0.059) (0.260) Japan 0.348*** 0.700 0.327*** 0.016
(0.073) (0.591) (0.067) (0.573) Korea 0.383*** 1.382*** 0.317*** 0.724* (0.064) (0.362) (0.060) (0.339) Has a job ‒0.004 ‒0.005 0.009** 0.009**
(0.003) (0.003) (0.003) (0.003) Spouse has a job ‒0.050 ‒0.040 0.103* 0.087+ (0.119) (0.119) (0.045) (0.046) Age 0.049 0.050 0.101 0.112
(0.044) (0.044) (0.085) (0.086) Number of children <16 0.309*** 0.299*** 0.161*** 0.164***
(0.030) (0.030) (0.026) (0.026) Household income 2nd qrt ‒0.006 0.002 0.003 0.006
(0.056) (0.056) (0.049) (0.050) Household income 3rd qrt 0.023 0.026 ‒0.066 ‒0.066
(0.059) (0.059) (0.052) (0.052) Household income 4th qrt 0.010 0.013 ‒0.009 ‒0.013
(0.061) (0.061) (0.056) (0.056) Secondary level 0.017 0.021 ‒0.162** ‒0.150* (0.076) (0.076) (0.061) (0.062) Postsecondary level 0.038 0.054 ‒0.187* ‒0.180* (0.090) (0.090) (0.080) (0.080) Spouse: secondary ‒0.116+ ‒0.128* ‒0.034 ‒0.034
(0.065) (0.065) (0.072) (0.072) Spouse: postsecondary ‒0.096 ‒0.103 ‒0.010 ‒0.011
(0.087) (0.087) (0.086) (0.086) Houseworka 0.012 0.033+ 0.010 ‒0.000
(0.008) (0.017) (0.010) (0.018) Spouse houseworka 0.003 0.036* 0.017* 0.023
(0.009) (0.018) (0.007) (0.018) China*housework ‒0.020 0.029
Table 7: (Continued)
Husbands Wives
VARIABLES Model 1 Model 2 Model 3 Model 4 China*spouse housework ‒0.039+ ‒0.007 (0.021) (0.020) Japan*housework 0.020 0.026
(0.038) (0.051) Japan*spouse housework ‒0.041 0.010
(0.051) (0.034) Korea*housework ‒0.066* ‒0.032
(0.026) (0.030) Korea*spouse housework ‒0.065* ‒0.008
(0.029) (0.025) Constant 1.821*** 1.427*** 1.507*** 1.548***
(0.215) (0.281) (0.205) (0.264)
Observations 1,208 1,208 1,464 1,464 R-squared 0.319 0.326 0.310 0.313 Adj. R-squared 0.310 0.313 0.303 0.303
Data source: East Asian Social Survey 2006. Standard errors in parentheses.
Notes: aThe dependent variable ranges from 3 to 12, which is added by the frequency of undertaking three household chores: meal preparation, doing the laundry, and domestic cleaning. Scores 1 to 4 are given respectively to “less than once a week,” “several times a week,” “once a week,” and “every day” to each item.
The reference categories are: Taiwan, Household income 1st qrt, Has a job, Spouse has a job, Below secondary educational level, and Spouse below secondary educational level.
*** p<0.001, ** p<0.01, * p<0.05, + p<0.1.
this association by country. In Taiwan, China, and Japan, the joint net effect of men’s higher housework participation (not always significant) is a preference for more children, which reflects a stronger commitment to family life. In South Korea this pattern is reversed. Few of the interactions are statistically significant, so they should be interpreted with caution.
In Table 8 we regress the ideal number of children over the sharing of housework, which measures the inequality in how household tasks are distributed. Consistent with our earlier findings, the models show that a larger housework share is associated with preference for having fewer children for women (‒0.01, p<0.1) and more children for men, though the coefficient is very small and insignificant in the latter case. For women, including interactions between country and housework sharing make the main effect insignificant, but the direction of the combined effects is in the expected direction for all four cases.
Table 8: OLS regression of the ideal number of children on the share of one’s contributions to housework and other characteristics
Husbands Wives
VARIABLES Model 1 Model 2 Model 3 Model 4
China ‒0.416*** ‒0.386*** ‒0.532*** ‒0.561*** (0.059) (0.079) (0.057) (0.088) Japan 0.351*** 0.577** 0.347*** 0.392* (0.073) (0.202) (0.067) (0.200) Korea 0.390*** 0.348** 0.338*** 0.403**
(0.063) (0.106) (0.059) (0.124) Age ‒0.003 ‒0.004 0.009** 0.009**
(0.003) (0.003) (0.003) (0.003) Has a job ‒0.046 ‒0.053 0.093* 0.084+ (0.119) (0.119) (0.044) (0.045) Spouse has a job 0.048 0.048 0.102 0.104
(0.044) (0.045) (0.086) (0.086) Number of children <16 0.310*** 0.309*** 0.166*** 0.168***
(0.030) (0.030) (0.026) (0.026) Household income 2nd qrt ‒0.007 ‒0.005 ‒0.000 0.001
(0.056) (0.056) (0.050) (0.050) Household income 3rd qrt 0.021 0.024 ‒0.069 ‒0.068
(0.059) (0.059) (0.052) (0.052) Household income 4th qrt 0.006 0.006 ‒0.020 ‒0.022
(0.061) (0.061) (0.056) (0.056) Secondary level 0.018 0.015 ‒0.157* ‒0.150* (0.076) (0.076) (0.061) (0.062) Postsecondary level 0.037 0.039 ‒0.187* ‒0.181* (0.090) (0.090) (0.080) (0.080) Spouse: secondary ‒0.117+ ‒0.119+ ‒0.033 ‒0.032
(0.065) (0.065) (0.072) (0.072) Spouse: postsecondary ‒0.098 ‒0.097 ‒0.010 ‒0.009
Table 8: (Continued)
Husbands Wives
VARIABLES Model 1 Model 2 Model 3 Model 4 Housework sharea 0.006 0.001 ‒0.010+ ‒0.012
(0.005) (0.012) (0.006) (0.013) China*housework share 0.008 0.007
(0.013) (0.015) Japan*housework share 0.035 ‒0.006
(0.029) (0.028) Korea*housework share ‒0.006 ‒0.009
(0.017) (0.019) Constant 1.920*** 1.917*** 1.713*** 1.712***
(0.200) (0.207) (0.182) (0.187)
Observations 1,208 1,208 1,464 1,464 R-squared 0.318 0.319 0.308 0.309 Adj. R-squared 0.310 0.309 0.301 0.300
Data source: East Asian Social Survey 2006. Standard errors in parentheses.
Notes: The reference categories are: Taiwan, Household income 1st qrt, Has a job, Spouse has a job, Below secondary educational level, and Spouse below secondary educational level.
aThe housework share variable ranges from –9 to 9, where higher values indicate a larger share of housework and 0 is an equal
share with the spouse. Respondents were asked about their frequency of undertaking three household chores: meal preparation, doing the laundry, and domestic cleaning. Scores 1 to 4 are given respectively to “less than once a week,” “several times a week,” “once a week,” and “every day” to each item. The degree of sharing equals own domestic work score minus spouse’s domestic work score.
*** p<0.001, ** p<0.01, * p<0.05, + p<0.1.
Table 9: Ordered logit models of the ideal number of children on the frequency of contributions to housework and other characteristics
Husbands Wives
VARIABLES Model 1 Model 2 Model 3 Model 4
China ‒1.790*** ‒0.419 ‒2.219*** ‒3.522*** (0.206) (0.788) (0.208) (0.814) Japan 1.037*** 1.897 0.977*** 0.079
(0.216) (1.768) (0.200) (1.688) Korea 1.014*** 3.806*** 0.872*** 1.916+ (0.196) (1.121) (0.185) (1.023) Age ‒0.014 ‒0.016 0.023* 0.024* (0.010) (0.010) (0.010) (0.010) Has a job ‒0.324 ‒0.276 0.321* 0.275* (0.354) (0.356) (0.135) (0.137) Spouse has a job 0.236+ 0.239+ 0.295 0.319
(0.131) (0.133) (0.256) (0.257) Number of children <16 1.016*** 0.992*** 0.564*** 0.575***
(0.098) (0.099) (0.083) (0.083) Household income 2nd qrt ‒0.024 0.003 0.028 0.032
(0.170) (0.171) (0.152) (0.153) Household income 3rd qrt 0.108 0.126 ‒0.227 ‒0.222
(0.179) (0.180) (0.158) (0.159) Household income 4th qrt 0.038 0.050 0.034 0.012
(0.185) (0.185) (0.171) (0.171) Secondary level ‒0.020 ‒0.012 ‒0.642** ‒0.610**
(0.237) (0.237) (0.196) (0.198) Postsecondary level 0.09572 0.132 ‒0.706** ‒0.693**
(0.277) (0.278) (0.246) (0.248) Spouse: secondary ‒0.461* ‒0.485* ‒0.150 ‒0.163
(0.204) (0.204) (0.227) (0.228) Spouse: postsecondary ‒0.429 ‒0.433 ‒0.08071 ‒0.087
(0.268) (0.268) (0.267) (0.268) Houseworka 0.028 0.061 0.034 ‒0.015
(0.023) (0.052) (0.032) (0.057) Spouse houseworka 0.002 0.110+ 0.055** 0.050
(0.027) (0.057) (0.021) (0.055) China*housework ‒0.031 0.123+ (0.059) (0.072) China*spouse housework ‒0.126+ 0.007
(0.066) (0.061) Japan*housework 0.078 0.084
(0.112) (0.147) Japan*spouse housework ‒0.115 0.006
(0.150) (0.010) Korea*housework ‒0.132+ ‒0.091
(0.080) (0.090) Korea*spouse housework ‒0.207* 0.001
Table 9: (Continued)
Husbands Wives
VARIABLES Model 1 Model 2 Model 3 Model 4 Constant cut1 ‒5.346*** ‒4.187*** ‒4.682*** ‒5.144***
(0.736) (0.937) (0.722) (0.893) Constant cut2 ‒1.944** ‒0.787 ‒0.773 ‒1.215
(0.671) (0.885) (0.637) (0.823) Constant cut3 1.986** 3.154*** 3.173*** 2.745***
(0.664) (0.886) (0.635) (0.819) Constant cut4 4.312*** 5.507*** 5.219*** 4.792***
(0.683) (0.905) (0.647) (0.829) Constant cut5 5.679*** 6.882*** 7.339*** 6.912***
(0.717) (0.931) (0.707) (0.876)
Observations 1,208 1,208 1,464 1,464 LR Chi-square 533.3 542.1 605.5 612.6
d.f. 16 22 16 22
Data source: East Asian Social Survey 2006. Standard errors in parentheses.
Notes: The reference categories are: Taiwan, Household income 1st qrt, Has a job, Spouse has a job, Below secondary educational level, and Spouse below secondary educational level.
a
The housework variable ranges from 3 to 12, which is added by the frequency of undertaking three household chores: meal preparation, doing the laundry, and domestic cleaning. Scores 1 to 4 are given respectively to “less than once a week,” “several times a week,” “once a week,” and “every day” to each item.
*** p<0.001, ** p<0.01, * p<0.05, + p<0.1.
Table 10: Ordered logit models of the ideal number of children on the share of one’s contributions to housework and other characteristics
Husbands Wives
VARIABLES Model 1 Model 2 Model 3 Model 4
China ‒1.775*** ‒1.612*** ‒2.091*** ‒2.162*** (0.205) (0.261) (0.200) (0.286) Japan 1.040*** 1.695** 1.042*** 0.968+ (0.216) (0.590) (0.198) (0.570) Korea 1.029*** 1.100*** 0.938*** 1.184**
(0.195) (0.318) (0.183) (0.371) Age ‒0.013 ‒0.014 0.024* 0.025* (0.010) (0.010) (0.010) (0.010) Has a job ‒0.319 ‒0.327 0.288* 0.270* (0.355) (0.355) (0.134) (0.136) Spouse has a job 0.235+ 0.235+ 0.296 0.297
(0.131) (0.133) (0.255) (0.255) Number of children <16 1.018*** 1.018*** 0.582*** 0.587***
(0.098) (0.098) (0.082) (0.083) Household income 2nd qrt ‒0.024 ‒0.014 0.012 0.018
(0.170) (0.171) (0.152) (0.152) Household income 3rd qrt 0.104 0.118 ‒0.239 ‒0.236
Table 10: (Continued)
Husbands Wives
VARIABLES Model 1 Model 2 Model 3 Model 4 Household income 4th qrt 0.031 0.035 ‒0.005 ‒0.010 (0.184) (0.184) (0.170) (0.170) Secondary level ‒0.019 ‒0.028 ‒0.629** ‒0.610**
(0.237) (0.237) (0.197) (0.198) Postsecondary level 0.0913 0.0973 ‒0.708** ‒0.691**
(0.277) (0.277) (0.247) (0.247) Spouse: secondary ‒0.463* ‒0.461* ‒0.148 ‒0.148
(0.204) (0.204) (0.227) (0.227) Spouse: postsecondary ‒0.433 ‒0.425 ‒0.082 ‒0.080
(0.268) (0.268) (0.267) (0.267) Housework sharea 0.015 ‒0.017 ‒0.030+ ‒0.034
(0.016) (0.036) (0.018) (0.040) China*housework share 0.041 0.017
(0.041) (0.046) Japan*housework share 0.107 0.012
(0.084) (0.080) Korea*housework share 0.022 ‒0.037
(0.052) (0.057) Constant cut1 ‒5.557*** ‒5.449*** ‒5.352*** ‒5.341***
(0.690) (0.709) (0.662) (0.674) Constant cut2 ‒2.156*** ‒2.047** ‒1.455* ‒1.445* (0.619) (0.640) (0.565) (0.579) Constant cut3 1.774** 1.885** 2.483*** 2.494***
(0.611) (0.633) (0.559) (0.574) Constant cut4 4.099*** 4.217*** 4.526*** 4.540***
(0.631) (0.653) (0.573) (0.587) Constant cut5 5.466*** 5.584*** 6.645*** 6.660***
(0.667) (0.688) (0.640) (0.653)
Observations 1,208 1,208 1,464 1,464 LR Chi-square 532.6 534.7 600 601.3
d.f. 15 18 15 18
Data source: East Asian Social Survey 2006. Standard errors in parentheses.
Notes: The reference categories are: Taiwan, Household income 1st qrt, Has a job, Spouse has a job, Below secondary educational level, and Spouse below secondary educational level.
aThe housework share variable ranges from –9 to 9, where higher values indicate a larger share of housework and 0 is an equal
share with the spouse. Respondents were asked about their frequency of undertaking three household chores: meal preparation, doing the laundry, and domestic cleaning. Scores 1 to 4 are given respectively to “less than once a week,” “several times a week,” “once a week,” and “every day” to each item. The degree of sharing equals own domestic work score minus spouse’s domestic work score.
*** p<0.001, ** p<0.01, * p<0.05, + p<0.1.
matter in predicting the ideal number of children. This turned out not to be a significant predictor.
7. Discussion and conclusion
This paper has documented variations in the domestic division of labour in the four countries. Housework is most stratified by gender in Japan: women do most of the cleaning, cooking, and laundry and few men regularly engage in these activities. We have also shown country-specific patterns of fertility preferences in the four countries. Couples in South Korea and Japan tend to prefer having more children than those in Taiwan and China.
Despite the aforementioned variations, in all four countries we found that women do the major share of housework and that having more children is associated with more housework for women but not for men. The evidence supporting Hypothesis 1 is mixed. In Taiwan, Japan, and (to a lesser extent) China men who participate more in housework prefer to have more children. South Korean husbands, by contrast, prefer to have fewer children if they themselves are more involved in housework. The relative share of both genders in household work has no systematic impact on men’s preferences.
Our findings support Hypothesis 2. Husbands’ participation in housework is positively associated with women’s preferred number of children in all four countries. Women also prefer having fewer children if their housework share increases.
Finally, our findings are consistent with Hypothesis 3. The association between domestic division of labour and fertility preference is observed in all four countries, but increases in husbands’ housework participation are more consistently associated with wives’ preference for more children. Women rather than men bear the brunt of conflicts between the demands of domestic work and labour market work, and therefore their fertility preference is more strongly linked with the extent of their housework responsibilities.
to assume on their own, while the latter expects fertility decline as a result of more women turning into breadwinners and choosing to delay or withdraw from family formation. Women’s willingness to have more children when they get help with their domestic burden points to the former explanation. The findings also indicate that East Asian countries are similar to conservative European countries, such as Italy, Spain, and Germany, which have the lowest low fertility in Europe. In these countries a traditional gender division of domestic labour is similarly associated with a lower fertility preference.
References
Aassve, A., Fuochi, G., Mencarini, L., and Mendola, D. (2015). What is your couple type? Gender ideology, housework sharing, and babies. Demographic Research 32(30): 835‒858.doi:10.4054/DemRes.2015.32.30.
An, M.Y. and Peng, I. (2016). Diverging paths? A comparative look at childcare policies in Japan, South Korea and Taiwan. Social Policy and Administration 50(5): 540‒558.doi:10.1111/spol.12128.
Andersson, G. and Scott, K. (2005). Labour market status and first-time parenthood: The experience of immigrant women in Sweden, 1981‒97.Population Studies ‒ A Journal of Demography59(1): 21‒38.doi:10.1080/0032472052000332683. Balbo, N., Billari, F.C., and Mills, M. (2013). Fertility in advanced societies: A review
of research: La fécondité dans les sociétés avancées: Un examen des recherches. European Journal of Population29(1): 1‒38.doi:10.1007/s10680-012-9277-y. Becker, G. (1993).A treatise on the family. Cambridge: Harvard University Press. Billari, F.C. and Kohler, H.-P. (2004). Patterns of low and lowest-low fertility in
Europe. Population Studies 58(2): 161‒176. doi:10.1080/0032472042000213
695.
Brewster, K.L. and Rindfuss, R.R. (2000). Fertility and women’s employment in industrialized nations. Annual Review of Sociology 26: 271‒296. doi:10.1146/
annurev.soc.26.1.271.
Chen, Y.-C.C. and Li, J.-C.A. (2014). Family change in East Asia. In Treas, J., Scott, J.L., and Richards, M. (eds.). The Wiley-Blackwell companion to the sociology of families. Chichester: Wiley-Blackwell.doi:10.1002/9781118374085.ch4. Cooke, L.P. (2004). The gendered division of labor and family outcomes in Germany.
Journal of Marriage and Family 66(5): 1246‒1259. doi:10.1111/j.0022-2445.
2004.00090.x.
Cooke, L.P. (2009). Gender equity and fertility in Italy and Spain. Journal of Social Policy 38(1): 123‒140.doi:10.1017/S0047279408002584.
Craig, L. and Siminski, P. (2010). Men’s housework, women’s housework and second births in Australia.Social Politics 17(2): 235‒266.doi:10.1093/sp/jxq004. Craig, L. and Siminski, P. (2011). If men do more housework, do their wives have more
babies? Social Indicators Research 101(2): 255‒258.
Esping-Andersen, G. and Billari, F.C. (2015). Re-theorizing family demographics. Population and Development Review 41(1): 1‒31. doi:10.1111/j.1728-4457.
2015.00024.x.
Frejka, T., Jones, G.W., and Sardon, J.-P. (2010). East Asian childbearing patterns and policy developments. Population and Development Review 36(3): 579–606.
doi:10.1111/j.1728-4457.2010.00347.x.
Frejka, T. and Ross, J. (2001). Paths to subreplacement fertility: The empirical evidence.Population and Development Review27 (Supplement): 213‒254. Gauthier, A.H. (2015). Social norms, institutions, and policies in low-fertility countries.
In Ogawa, N. and Shah, I.H. (eds.).Low fertility and reproductive health in East Asia. New York: Springer: 11‒30.doi:10.1007/978-94-017-9226-4_2.
Gauthier, A.H. (2016). Governmental Support for families and obstacles to fertility in East Asia and other industrialized regions. In Rindfuss, R.R. and Choe, M.K. (eds.). Low fertility, institutions, and their policies. New York: Springer: 283‒
303.doi:10.1007/978-3-319-32997-0_11.
Goldscheider, F., Bernhardt, E., and Branden, M. (2013). Domestic gender equality and childbearing in Sweden. Demographic Research 29(40): 1097‒1126.
doi:10.4054/DemRes.2013.29.40.
Goldscheider, F., Bernhardt, E., and Lappegård, T. (2015). The gender revolution: A framework for understanding changing family and demographic behavior. Population and Development Review41(2): 207–239.doi:10.1111/j.1728-4457.
2015.00045.x.
Goldscheider, F., Oláh, L.S., and Puur, A. (2010). Reconciling studies of men’s gender attitudes and fertility: Response to Westoff and Higgins.Demographic Research 22(8): 189‒198.doi:10.4054/DemRes.2010.22.8.
Hazan, M. and Zoabi, H. (2015). Do highly educated women choose smaller families? Economic Journal 125(587): 1191‒1226.doi:10.1111/ecoj.12148.
Kan, M.-Y. and He, G. (2014). Who does housework, who cares and when? The domestic division of labour in urban China. Paper presented at the International Sociological Association Conference, Yokohama, Japan, July 16.
Kaufman, G. (2000). Do gender role attitudes matter? Family formation and dissolution among traditional and egalitarian men and women. Journal of Family Issues 21(1): 128‒144.doi:10.1177/019251300021001006.
Kim, Y.M. (2013). Dependence on family ties and household division of labor in Korea, Japan, and Taiwan. Asian Journal of Women’s Studies 19(2): 7‒35.
doi:10.1080/12259276.2013.11666147.
Kohler, H.-P., Billari, F.C., and Ortega, J.A. (2002). The emergence of lowest-low fertility in Europe during the 1990s.Population and Development Review 28(4): 641–680.doi:10.1111/j.1728-4457.2002.00641.x.
Koslowski, A., Blum, S., and Moss, P. (2016). International review of leave policies and research 2016. Retrieved from http://www.leavenetwork.org/lp_and_ r_reports/
McDonald, P. (2000a). Gender equity in theories of fertility transition.Population and Development Review 26(3): 427–439.doi:10.1111/j.1728-4457.2000.00427.x. McDonald, P. (2000b). Gender equity, social institutions and the future of fertility.
Journal of the Australian Population Association17(1): 1‒16.doi:10.1007/BF03
029445.
McDonald, P. (2006). Low fertility and the state: The efficacy of policy. Population and Development Review 32(3): 485–510. doi:10.1111/j.1728-4457.2006.00
134.x.
McDonald, P. (2009). Explanations of low fertility in East Asia: A comparative perspective. In Jones, G.W., Straughan, P.T., and Chan, A.W.M. (eds.). Ultra-low fertility in Pacific Asia: Trends, causes and policy issues. New York: Routledge: 23‒39.
Mills, M., Mencarini, L., Tanturri, M.L., and Begall, K. (2008). Gender equity and fertility intentions in Italy and the Netherlands.Demographic Research18(1):1‒
26.doi:10.4054/DemRes.2008.18.1.
Myrskylae, M., Kohler, H.-P., and Billari, F.C. (2009). Advances in development reverse fertility declines.Nature460(7256): 741‒743.doi:10.1038/nature08230. Neyer, G., Lappegard, T., and Vignoli, D. (2013). Gender equality and fertility: Which
Ono, H. (2003). Women’s economic standing, marriage timing, and cross-national contexts of gender. Journal of Marriage and Family 65(2): 275‒286.
doi:10.1111/j.1741-3737.2003.00275.x.
Oshio, T., Nozaki, K., and Kobayashi, M. (2013). Division of household labor and marital satisfaction in China, Japan, and Korea.Journal of Family and Economic Issues34(2): 211‒223.doi:10.1007/s10834-012-9321-4.
Qian, Y. and Sayer, L.C. (2016). Division of labor, gender ideology, and marital satisfaction in East Asia. Journal of Marriage and Family 78(2): 383‒400.
doi:10.1111/jomf.12274.
Raymo, J.M., Park, H., Xie, Y., and Yeung, W.-j.J. (2015). Marriage and family in East Asia: Continuity and change. Annual Review of Sociology 41: 471‒492.
doi:10.1146/annurev-soc-073014-112428.
Rindfuss, R.R., Choe, M.K., Tsuya, N.O., Bumpass, L.L., and Tamaki, E. (2015). Do low survey response rates bias results? Evidence from Japan. Demographic Research 32(26): 797‒828.doi:10.4054/DemRes.2015.32.26.
Sechiyama, K. (2013).Patriarchy in East Asia: Boston: Brill.
Sullivan, O., Billari, F.C., and Altintas, E. (2014). Fathers’ changing contributions to child care and domestic work in very low-fertility countries: The effect of education. Journal of Family Issues 35(8): 1048‒1065. doi:10.1177/0192513x
14522241.
Suzuki, T. (2013). Low fertility and population aging in Japan and Eastern Asia. Berlin: Springer.doi:10.1007/978-4-431-54780-8.
Ting, K.F. (2013).Division of domestic labor and marital intimacy. Paper presented in the 2013 Taiwan – Hong Kong Sociology and Social Image Conference, Hong Kong: CUHK, April 12‒13, 2013.
Torr, B.M. and Short, S.E. (2004). Second births and the second shift: A research note on gender equity and fertility.Population and Development Review 30(1): 109‒
130.doi:10.1111/j.1728-4457.2004.00005.x.
Tsuya, N.O., Bumpass, L.L., Choe, M.K., and Rindfuss, R.R. (2012). Employment and household tasks of Japanese couples, 1994‒2009. Demographic Research 27(24): 705‒717.doi:10.4054/DemRes.2012.27.24.
Yu, J. and Xie, Y. (2012). The varying display of gender display: A comparative study of mainland China and Taiwan. Chinese Sociological Review 44(2): 5‒30.