Open Access
Research article
Expression of
PEG11
and
PEG11AS
transcripts in normal and
callipyge sheep
Christopher A Bidwell*
1, Lauren N Kramer
1, Allison C Perkins
1,
Tracy S Hadfield
2, Diane E Moody
1and Noelle E Cockett
2Address: 1Department of Animal Sciences, Purdue University, 125 South Russell Street, West Lafayette, IN 47907-2042 USA and 2Department of
Animal, Dairy and Veterinary Sciences, College of Agriculture, Utah State University, 4800 Old Main Hill, Logan UT 84322-4800 USA
Email: Christopher A Bidwell* - [email protected]; Lauren N Kramer - [email protected]; Allison C Perkins - [email protected]; Tracy S Hadfield - [email protected]; Diane E Moody - [email protected]; Noelle E Cockett - [email protected] * Corresponding author
Abstract
Background: The callipyge mutation is located within an imprinted gene cluster on ovine chromosome 18. The callipyge trait exhibits polar overdominant inheritance due to the fact that only heterozygotes inheriting a mutant paternal allele (paternal heterozygotes) have a phenotype of muscle hypertrophy, reduced fat and a more compact skeleton. The mutation is a single A to G transition in an intergenic region that results in the increased expression of several genes within the imprinted cluster without changing their parent-of-origin allele-specific expression.
Results: There was a significant effect of genotype (p < 0.0001) on the transcript abundance of
DLK1, PEG11, and MEG8 in the muscles of lambs with the callipyge allele. DLK1 and PEG11 transcript levels were elevated in the hypertrophied muscles of paternal heterozygous animals relative to animals of the other three genotypes. The PEG11 locus produces a single 6.5 kb transcript and two smaller antisense strand transcripts, referred to as PEG11AS, in skeletal muscle. PEG11AS
transcripts were detectable over a 5.5 kb region beginning 1.2 kb upstream of the PEG11 start codon and spanning the entire open reading frame. Analysis of PEG11 expression by quantitative PCR shows a 200-fold induction in the hypertrophied muscles of paternal heterozygous animals and a 13-fold induction in homozygous callipyge animals. PEG11 transcripts were 14-fold more abundant than PEG11AS transcripts in the gluteus medius of paternal heterozygous animals.
PEG11AS transcripts were expressed at higher levels than PEG11 transcripts in the gluteus medius of animals of the other three genotypes.
Conclusions: The effect of the callipyge mutation has been to alter the expression of DLK1, GTL2,
PEG11 and MEG8 in the hypertrophied skeletal muscles. Transcript abundance of DLK1 and PEG11
was highest in paternal heterozygous animals and exhibited polar overdominant gene expression patterns; therefore, both genes are candidates for causing skeletal muscle hypertrophy. There was unique relationship of PEG11 and PEG11AS transcript abundance in the paternal heterozygous animals that suggests a RNA interference mechanism may have a role in PEG11 gene regulation and polar overdominance in callipyge sheep.
Published: 06 August 2004
BMC Biology 2004, 2:17 doi:10.1186/1741-7007-2-17
Received: 17 March 2004 Accepted: 06 August 2004
This article is available from: http://www.biomedcentral.com/1741-7007/2/17 © 2004 Bidwell et al; licensee BioMed Central Ltd.
Background
The mutation responsible for the callipyge trait is located within an imprinted gene cluster on the distal end of ovine chromosome 18 [1-3]. The callipyge phenotype is associated with an altered carcass composition including a 30–40% increase in muscle mass, a 6–7% decrease in carcass fat, decreased organ weights, and a more compact skeleton, all without a net affect on animal growth [4-7]. There is a pronounced hypertrophy of muscles in the loin and pelvic limbs and a lesser degree of hypertrophy in muscles of the thoracic limbs [6-8]. The callipyge pheno-type is inherited in a non-Mendelian mode termed polar overdominance [9,10] in which only animals that inherit a normal allele (wild type; +) from the dam and the mutant callipyge allele from the sire (CLPGPat) exhibit the
callipyge phenotype. Maternal heterozygotes (CLPGMat/
+Pat) and callipyge allele homozygotes (CLPGMat/CLPGPat)
have muscling and carcass compositions that are similar to normal sheep (wild type homozygotes; +/+).
A physical contig spanning the region containing the cal-lipyge mutation was constructed using overlapping ovine bacterial artificial chromosomes [11] and 215 kb of sequence was obtained from the contig [3]. Comparisons of the ovine sequence to the human genome sequence and to expressed sequence databases indicated the pres-ence of at least six transcribed genes with allele-specific expression [3] (Figure 1). The gene order along the contig was found to be Delta-like 1 (DLK1), DLK associated tran-script (DAT), gene-trap locus 2 (GTL2), paternal expressed gene 11 (PEG11 / PEG11AS) and maternal expressed gene 8
(MEG8). The same conserved gene order was also found as an imprinted domain on human chromosome 14 and mouse chromosome 12 [12-15]. The DLK1 locus (also referred to as PREF-1, Zog-1 and pG2) encodes a trans-membrane protein that contains epidermal-growth factor repeats [16-19]. Cleavage of the extracellular domain of
DLK1 produces the circulating protein fetal antigen-1 [20]. DAT is a short non-coding RNA that has been pro-posed to be a cleavage product of extended DLK1 tran-scripts [21]. Both DLK1and DAT are expressed from the paternal allele [3,13-15]. GTL2 (also referred to as MEG3) and MEG8 genes express non-coding RNA from the mater-nal allele [3,13-15]. The PEG11 gene contains an intron-less open reading frame of 1333 amino acids in sheep [3]. The human and mouse orthologues known as retrotrans-poson-like 1 (RTL1/rtl1) encode 1358 and 1745 amino acids, respectively. RNA transcripts were detected from the opposite strand of the same gene, referred to as PEG11AS
(formerly known as antiPEG11) [3]. In the mouse, two maternally expressed microRNAs have been identified with perfect complementarity to mouse Rtl1 [22].
The causative mutation for callipyge is a single base tran-sition of A (wild type; +) to G (CLPG) in the intergenic
region located between DLK1 and GTL2 [23] (Figure 1). This mutation has been shown to be 100% concordant with all animals of the +Mat/CLPGPat genotype based on
haplotype analysis [23]. Analysis of sheep from 19 differ-ent breeds as well as 13 mammalian species revealed a highly conserved 12 base sequence that includes the sin-gle nucleotide polymorphism [24]. The G polymorphism is unique to direct descendents of the first known cal-lipyge animal, a ram named "Solid Gold". This animal was mosaic for the mutation [24], providing strong evi-dence that this single nucleotide polymorphism is the causative mutation. Initial results indicate that the muta-tion alters the expression of several of the genes within the imprinted cluster [25,26] when they are inherited in cis
without altering their parent-of-origin-specific expression [25].
In this study, we analyzed the expression of five genes within the callipyge cluster in the muscles of lambs of all four genotypes. Quantitative analysis of gene expression using a series of orthogonal contrasts showed that DLK1,
PEG11 and MEG8 exhibited a polar overdominant pattern of gene expression. The expression of PEG11 and
PEG11AS transcripts in the muscles of paternal hetero-zygous callipyge lambs (+Mat/CLPGPat) was different from
the other three genotypes. A sense/antisense interaction of
PEG11 and PEG11AS, such as an RNA interference mech-anism, would be consistent with a trans interaction between reciprocally imprinted genes that has been previ-ously proposed as a mechanism for polar overdominance [27,28].
Results
Northern blot analysis
Muscle samples were collected from 12- and 8-week-old lambs, when muscle hypertrophy is well established in animals with the callipyge phenotype. Total RNA was extracted from three muscles that undergo hypertrophy including longissimus dorsi (loin), semimembranosus, and gluteus medius (pelvic limb), and one muscle that does not undergo hypertrophy, the supraspinatus, (tho-racic limb). Strand specific probes were used to analyze
PEG11 and PEG11AS expression. Hybridization of longis-simus dorsi, semimembranosus and gluteus medius northern blots with a PEG11 probe indicated expression of a 6.5 kb PEG11 transcript in paternal heterozygotes (+Mat/CLPGPat) that was not readily detectable in the other
three genotypes (Figure 2). Two smaller PEG11AS tran-scripts of 1.7 kb and 0.8 kb were detected in the two gen-otypes with maternally inherited callipyge alleles (CLPGMat/+Pat and CLPGMat/CLPGPat) by a probe from the
complementary strand. PEG11 and PEG11AS transcripts were not detected in the supraspinatus. The expression of
to be up-regulated in the loin and pelvic limb muscles of +Mat/CLPGPat and CLPGMat/CLPGPat animals (Figure 2).
GTL2 transcripts of around 2.4 kb were evident in the
CLPGMat/+Pat and CLPGMat/CLPGPat genotypes. A distinct
1.9 kb GTL2 transcript was consistently detected in the +Mat/CLPGPat genotype and no GTL2 transcripts were
detected in the +/+ genotype. A 1.8 kb MEG8 transcript was expressed to a lesser degree than GTL2 in the CLPG -Mat/+Pat and CLPGMat/CLPGPat genotypes and was also
detectable in the +Mat/CLPGPat genotype. The expression
pattern of MEG8 was the least consistent in the northern blot analysis of individuals of the four genotypes.
PEG11/PEG11AS
Ribonuclease protection assays were performed using five riboprobes to map the PEG11 and PEG11AS transcripts to the contig sequence (Figure 3A). The results for riboprobe P confirm the expression of PEG11 transcripts in the glu-teus medius of +Mat/CLPGPat animals and showed a very
low level of PEG11 in the gluteus medius of CLPGMat/
CLPGPat animals. PEG11AS transcripts were readily
detect-able in animals of the +/+, CLPGMat/+Pat and CLPGMat/
CLPGPat genotypes but were slightly above background
levels in the +Mat/CLPGPat animals (Figure 3B). Two other
PEG11 probes from the open reading frame (E) and from the 3'UTR (C) showed equivalent results to riboprobe P in the gluteus medius (Figure 3B). The same expression pat-tern was seen for PEG11 and PEG11AS transcripts in the supraspinatus, but signal from the protected riboprobes was just above background level.
Two probes from upstream of the PEG11 coding sequence (riboprobes F and G) did not detect any PEG11 tran-scripts, indicating that transcription of the 6.5 kb PEG11
was initiated within 350 bp of the start codon of the open reading frame. Riboprobe F detected PEG11AS transcripts in the gluteus medius and supraspinatus of all four geno-types, with the lowest expression in the paternal hetero-zygous (+Mat/CLPGPat) animals. The PEG11AS riboprobe
G shows three protected fragments, suggesting variable splice junctions or transcription termination sites for
PEG11AS transcripts.
Quantitative analysis of the effect of genotype on gene expression
Gene expression was measured in the gluteus medius and supraspinatus of 8 week-old animals (Figure 4) using quantitative PCR. The expression of glyceraldehyde-3-phosphate dehydrogenase was not significantly different across the four genotypes in the gluteus medius and supraspinatus (Table 1), indicating that equivalent amounts of RNA were used for cDNA synthesis and quan-titative PCR. The effect of the callipyge mutation on geno-type-specific expression of DLK1 and PEG11 in gluteus medius was the same (Table 1) although the magnitude of the response was greater for PEG11 than DLK1 (Figure 4A and 4B). The paternal heterozygous (+Mat/CLPGPat)
ani-mals had the highest transcript abundance (p < 0.05), fol-lowed by CLPGMat/CLPGPat animals, which had
significantly greater transcript abundance (p < 0.05) than
CLPGMat/+Pat or +/+ animals. The mRNA abundance of
DLK1 in the gluteus medius was 6-fold and 2.5-fold The callipyge region of ovine chromosome 18
Figure 1
The callipyge region of ovine chromosome 18. A diagram of the callipyge region [3] based on GenBank accession No. AF345168 is shown. Six known transcripts are indicated along with the direction of transcription (arrows). Transcripts expressed from the paternal allele are shown as orange arrows and those expressed from the maternal allele are shown as black arrows [3]. A blue line indicates the position of the causative mutation. Alleles with an A are wild type (+) and the mutant callipyge allele (CLPG) has a G at this position [23, 24].
DLK1/DAT
GTL2 PEG11AS MEG8
A to G
PEG11
greater in +Mat/CLPGPat lambs and CLPGMat/CLPGPat lambs
respectively, relative to normal lambs (+/+; Figure 4A).
PEG11 mRNA abundance in the gluteus medius was 200-fold and 13-200-fold greater in +Mat/CLPGPat lambs and CLPG -Mat/CLPGPat lambs respectively, relative to normal lambs
(+/+; Figure 4B).
The effect of the callipyge mutation on DLK1 and PEG11
expression in the supraspinatus was different (Table 1). No differences in DLK1 transcript abundance in the supraspinatus were found among the four genotypes (Fig-ure 4C). Although not statistically analyzed, the level of
DLK1 expression was similar between the gluteus medius
and supraspinatus (Figure 4A and 4C). PEG11 expression in the supraspinatus had a different genotype-specific pat-tern than in the gluteus medius. PEG11 expression was elevated 150-fold in +Mat/CLPGPat animals (p < 0.05) but
was not significantly changed in the other three genotypes (Figure 4D). The transcript abundance of PEG11 in supraspinatus was generally much lower than in gluteus medius of the same genotype. PEG11 expression in the supraspinatus was 12-fold lower than in the gluteus medius of paternal heterozygous animals (Figure 4B and 4D).
Northern blot analysis of skeletal muscle RNA from 12-week-old lambs
Figure 2
Northern blot analysis of skeletal muscle RNA from 12-week-old lambs. Expression of five genes from the callipyge region is shown for the four possible genotypes in 12-week-old lambs. Each lane contains total RNA from an individual animal. The genotypes are given with the maternal allele first followed by the paternal allele. The callipyge allele (CLPG) has been abbre-viated to C and the paternal heterozygote that has the callipyge phenotype is indicated with an asterisk (*). Strand specific probes are indicated on the left and transcript sizes are indicated on the right. The skeletal muscles shown are the longissimus dorsi (LD), semimembranosus (SM), gluteus medius (GM) and the supraspinatus (SP). The blots were hybridized with an 18S RNA probe to show the equivalence of RNA loading and transfer.
LD SM GM
SP
PEG11
PEG11AS
DLK1
MEG8
GTL2
18S
M / P
+ /
+
C / +
+ / C*
C / C
+ /
+
C / +
+ / C*
C / C
+ /
+
C / +
+ / C*
C / C
+ /
+
C / +
+ / C*
C / C
-2.4
-1.9
-1.8
Mapping of PEG11 and PEG11AS transcripts by ribonuclease protection assay
Figure 3
Mapping of PEG11 and PEG11AS transcripts by ribonuclease protection assay. A) A diagram of the PEG11 open reading frame (black arrow) and the position of the five riboprobes are shown. The PEG11 open reading frame extends from base 191859 to 187858 on the complementary strand of AF354168. B) Ribonuclease protection assays using PEG11AS (left col-umn) and PEG11 (right column) are shown using total RNA from the gluteus medius (GM) and the supraspinatus (SP) muscles for each of the four possible genotypes. The genotypes are given with the maternal allele first followed by the paternal allele. The CLPG allele has been abbreviated to C and the paternal heterozygote that demonstrates the callipyge phenotype is indi-cated with an asterisk (*). Yeast RNA with RNase treatment (Y+) and without RNase treatment (Y-) are shown as controls. A black arrow indicates the RNA fragments protected by each of the five RNA probes. Some full-length probes for C and E that could not be completely eliminated by RNase digestion are present in both muscle RNA samples and the yeast RNA control (Y+).
GM SP GM
SP
PEG11AS PEG11
B
F
G
+/+
C/+
+/C*
C/C
+/+
C/+
+/C*
C/C
Y+
Y-
+/+
C/+
+/C*
C/C
+/+
C/+
+/C*
C/C
Y+
Y-+/+
C/+
+/C*
C/C
Y+
Y-
+/+
C/+
+/C*
C/C
Y+
Y-GM Y-GM
P
P
E
C
+/+
C/+
+/C*
C/C
+/+
C/+
+/C*
C/C
Y+
Y-
+/+
C/+
+/C*
C/C
+/+
C/+
+/C*
C/C
Y-
Y+
CEN C E P F G TEL
A
Maternal inheritance of the callipyge allele significantly altered the expression of MEG8 but not PEG11AS in the gluteus medius (Table 1). Transcript abundance of MEG8
in gluteus medius was 6-fold greater (p < 0.05) in the
CLPGMat/+Pat and CLPGMat/CLPGPat animals relative to the
+Mat/CLPGPat and +/+ animals (Figure 4A). Expression of
MEG8 in the supraspinatus was also affected by the cal-lipyge mutation but to a lesser degree (Figure 4C). The homozygous callipyge animals had significantly higher
MEG8 transcript abundance than paternal heterozygotes, but those two genotypes were not significantly different
from maternal heterozygotes and homozygous wild type lambs.
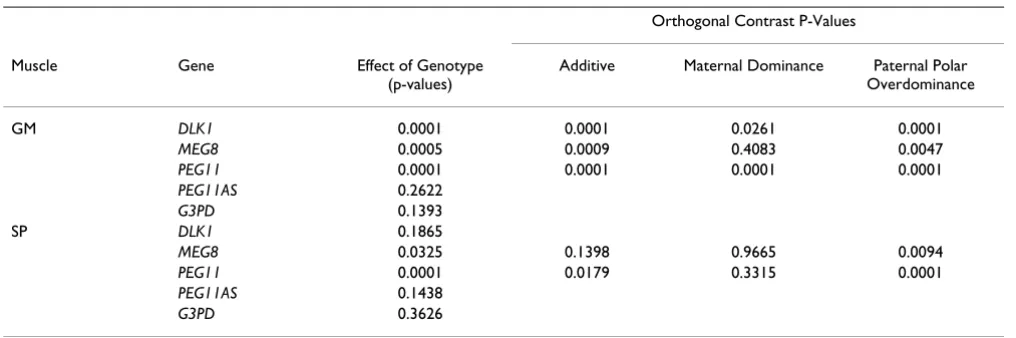
Orthogonal contrasts were used to analyze different mod-els of gene action for the genes that had a significant effect for genotype (Table 1). The polar overdominance contrast was significant for transcript abundances of DLK1, PEG11
and MEG8 in gluteus medius and for PEG11 and MEG8 in the supraspinatus. The additive contrasts were also signif-icant for DLK1, PEG11 and MEG8 in gluteus medius but were only significant for PEG11 in supraspinatus. The Quantitative reverse transcriptase PCR analysis of transcript abundance in the gluteus medius and supraspinatus muscles
Figure 4
Quantitative reverse transcriptase PCR analysis of transcript abundance in the gluteus medius and supraspina-tus muscles. Least square means and standard errors for transcript abundance by genotype are shown for the gluteus medius (GM), and supraspinatus (SP). The genotypes are given with the maternal allele first followed by the paternal allele and the
CLPG allele has been abbreviated to C. Quantification of DLK1 and MEG8 transcripts (A, C) was based on random primed cDNA synthesis using 213 ng of total RNA. Quantification of PEG11 and PEG11AS (B, D) transcripts was based on gene-specific priming of cDNA synthesis using 400 ng of total RNA. Different superscripts indicate significant differences (p < 0.05) between genotypic means for a given mRNA transcript and muscle. Numerical values for the log starting abundance are given for each mRNA transcript in a table below the genotypes.
2.0 3.0 4.0 5.0 6.0
Genotype
Log S
tart
ing A
bundanc
e
DLK1 4.839 4.884 5.633 5.241 MEG8 3.779 4.388 3.746 4.651 +/+ C/+ +/C C/C
a a
b
c
d d
e e
A GM B GM
2.0 3.0 4.0 5.0 6.0
Genotype
Log
S
tar
ti
n
g A
b
u
ndanc
e
PEG11 3.176 2.805 5.490 4.304 PEG11AS 4.431 4.818 4.330 5.081 +/+ C/+ +/C C/C a
a
b
c
C SP D SP
2.0 3.0 4.0 5.0 6.0
Genotype
Lo
g S
tar
ti
ng
A
bu
nda
nc
e
DLK1 4.994 4.908 5.005 5.089 MEG8 3.682 3.789 3.481 3.907 +/+ C/+ +/C C/C
a, b a, b a b
2.0 3.0 4.0 5.0 6.0
Genotype
Log
S
ta
rt
ing
A
bun
dan
c
e
PEG11 2.230 2.388 4.405 3.110 PEG11AS 3.892 4.043 3.817 4.420 +/+ C/+ +/C C/C
a a
b
maternal dominance contrast was significant for DLK1
and PEG11 gluteus medius.
Discussion
Our results show a clear pattern of increased expression for genes within the imprinted callipyge cluster in muscles that become hypertrophied, whereas expression of these genes was either reduced or absent in a muscle that does not become hypertrophied. The increased gene expression occurred when the mutation was inherited in cis and was dependent on each gene's imprinting status, consistent with previous reports [25,26]. These results support the hypothesis that the mutation has disrupted a long range control element [27]. Two paternally expressed genes,
DLK1 and PEG11, had significantly increased transcript abundance when a callipyge allele was inherited from the sire. One maternally expressed gene, MEG8, showed sig-nificantly increased transcript abundance when the cal-lipyge allele was inherited from the dam. The changes in gene expression were sustained until 12 weeks of age, when the differences in growth and body composition between callipyge and normal lamb are established and are subsequently maintained [7].
Northern blot analysis suggests that expression of GTL2
and PEG11AS was increased by maternal inheritance of the callipyge allele. Quantitative analysis was not done for
GTL2 in this study due to the expression of numerous alternatively spliced transcripts that have been reported for mice and sheep [26,29]. The 2.4 kb GTL2 mRNA seen in this study consisted of a heterogeneous population of alternatively spliced mRNAs. Similarly, two PEG11AS
transcripts were detected over a 5.6 kb area extending from beyond the 5' end of the PEG11 transcript to the 3'UTR. The 1.7 and 0.8 kb PEG11AS transcripts detected by northern blot analysis using probe P would not be
pro-tected by probes C or G unless the PEG11AS transcripts undergo intron splicing or there are other transcripts that were not detected in the northern blots. Therefore, the effect of the callipyge mutation on GTL2 and PEG11AS
will require a more extensive analysis to fully elucidate their expression patterns in the four genotypes and deter-mine their role in the callipyge model.
Due to their paternal allele-specific expression, the DLK1
and PEG11 genes are both candidates for an effector gene that is responsible for the skeletal muscle hypertrophy exhibited by paternal heterozygous (+Mat/CLPGPat)
ani-mals. In this study, both genes showed a polar overdomi-nant expression pattern in that paternal heterozygotes had significantly higher levels of gene expression than the other three genotypes. The major differences between
DLK1 and PEG11 were the magnitude and the muscle spe-cificity of the up-regulation. DLK1 was readily detectable in all muscles and genotypes by northern blot, but the up-regulation in paternal heterozygous animals was restricted to muscles of the loin and pelvic limb. The quantitative results showed a 6-fold increase in DLK1 transcript abun-dance in the gluteus medius and no change of DLK1
abundance in the supraspinatus. This pattern of gene expression is consistent with studies on individual muscle growth that show significant muscle hypertrophy in the gluteus medius but not in the supraspinatus [6,8]. DLK1
transcripts were significantly increased (2.5-fold) in the gluteus medius of CLPGMat/CLPGPat animals, which do
not exhibit muscle hypertrophy. The lack of a phenotype in CLPGMat/CLPGPat animals could be due to a threshold
effect that requires more than a 2.5-fold increase in DLK1
transcript abundance to change muscle growth.
The expression of PEG11 was very low in the gluteus medius and supraspinatus of normal sheep and was
Table 1: Statistical analysis of gene expression by quantitative PCR
Orthogonal Contrast P-Values
Muscle Gene Effect of Genotype
(p-values)
Additive Maternal Dominance Paternal Polar Overdominance
GM DLK1 0.0001 0.0001 0.0261 0.0001
MEG8 0.0005 0.0009 0.4083 0.0047
PEG11 0.0001 0.0001 0.0001 0.0001
PEG11AS 0.2622
G3PD 0.1393
SP DLK1 0.1865
MEG8 0.0325 0.1398 0.9665 0.0094
PEG11 0.0001 0.0179 0.3315 0.0001
PEG11AS 0.1438
induced in both muscles of callipyge lambs. Northern blot analysis, ribonuclease protection assay and quantita-tive PCR results all show that the expression of PEG11 and
PEG11AS transcripts was much lower in the supraspinatus than the other muscles. The high level of expression of
PEG11 in the gluteus medius relative to the supraspinatus of callipyge lambs indicates that PEG11 could also be the gene responsible for muscle hypertrophy if there is a threshold level required to change muscle growth. The
PEG11 gene has a long intronless open reading frame but it is not known if a protein is produced or what function it may have.
The overdominant nature of the callipyge phenotype through the lack of muscle hypertrophy in animals with the CLPGMat/CLPGPat genotype is one of the more
intriguing aspects of the trait and has led to a hypothesis of trans effects by other reciprocally imprinted genes in the callipyge region [25,27]. If the PEG11 gene has a direct role in muscle hypertrophy, either alone or in concert with DLK1, then PEG11AS may have a role in a trans effect on PEG11 expression. In +Mat/CLPGPat animals, PEG11
transcripts were 14-fold and 4-fold more abundant than
PEG11AS transcripts in the gluteus medius and suprasp-inatus respectively. PEG11AS transcripts were more abun-dant than PEG11 transcripts in the other three genotypes for both muscles. Therefore, the relative abundance of
PEG11 transcripts to PEG11AS transcripts was unique in paternal heterozygous animals. MicroRNAs are a central component of RNA interference mechanisms. In the mouse, two antisense microRNA have been identified for the orthologous rtl1 locus [22]. RNA interference mecha-nisms have been shown both to repress transcription by inducing heterochromatin formation [30-32] and to cause post-transcriptional silencing through nuclear retention or targeted degradation [33-35]. MicroRNAs may be produced from post-transcriptional processing of
PEG11AS RNA and be involved in normal regulation of the locus and in generating overdominance [28]. Expres-sion of PEG11AS may normally cause repression of the paternal PEG11 locus since very little PEG11 mRNA was detectable in the muscles of normal animals. In the ani-mals with a paternally inherited callipyge allele, (+Mat/
CLPGPat and CLPGMat/CLPGPat), the normal repression of
the PEG11 locus has been disrupted by the mutation in a putative long range control element [27]. PEG11 tran-scripts only accumulate in significant excess of PEG11AS
in the paternal heterozygous animals, whereas in the
CLPGMat/CLPGPat animals the PEG11AS transcripts remain
in excess and may prevent the accumulation of the thresh-old level of PEG11 mRNA required to produce a muscle hypertrophy phenotype. Although the expression of
PEG11AS was not affected by genotype in quantitative PCR, the northern blots and transcript mapping indicate there are multiple transcripts that are likely to undergo
different intron splicing. Further analysis of PEG11AS
expression will be necessary to determine its role in the
PEG11 locus regulation.
Conclusions
The effect of the callipyge mutation has been to increase transcript abundance of four genes, DLK1, GTL2, PEG11
and MEG8, within the imprinted cluster in skeletal mus-cles that become hypertrophied. The increase in transcript abundance was consistent with each gene's parental allele-specific expression. The DLK1 and PEG11 genes were both expressed at their highest levels in paternal het-erozygous animals and exhibited polar overdominant gene expression patterns. Therefore, both genes are candi-dates for causing muscle hypertrophy. DLK1 expression was only elevated in muscles that undergo hypertrophy, so its muscle-specific increase was consistent with the cal-lipyge phenotype. PEG11 was 12-fold more abundant in hypertrophied muscle than non-hypertrophied muscle and only paternal heterozygous animals had PEG11 tran-script levels in excess of PEG11AS transcript levels. The unique relationship of PEG11 and PEG11AS in paternal heterozygous animals suggests that an RNA interference mechanism may have a role in regulating the PEG11 locus and polar overdominance in callipyge sheep.
Methods
Sample collectionA series of planned matings were conducted to produce the four possible callipyge genotypes. The genotypes of all lambs were verified using the single nucleotide polymorphism [23,24] and several markers that flank the callipyge region on chromosome 18. Lambs were slaugh-tered in accordance with humane practices approved by the Utah State University Institutional Animal Care and Use Committee. Samples were collected from the longis-simus dorsi, semimembranosus, gluteus medius and supraspinatus, and preserved in RNAlater (Ambion Inc., Woodlands, TX USA). The tissue samples were homoge-nized in 4 M guanidinium thiocyanate, 25 mM sodium citrate, 50 mM EDTA, 1% sodium-N-lauroyl-sarcosine and total RNA was sedimented by ultracentrifugation of the homogenate on a cushion of 5.7 M CsCl, 50 mM EDTA [36]. Purified RNA was quantified by spectropho-tometry and the use of a constant mass of RNA for each quantitative assay was based on absorbance at 260 nm. Total RNA was treated with DNase I using DNA free™ rea-gents (Ambion Inc.) to remove trace genomic DNA prior to use in the ribonuclease protection assay and quantita-tive PCR.
Northern blot analysis
nylon membranes using standard methods [37]. Primer sequences used to amplify probes from the callipyge region are given in Charlier et al. [25], and the PCR products were verified by DNA sequencing. Strand specific DNA probes were synthesized by 40 cycles of asymmetric PCR with Strip-EZ™ nucleotides (Ambion Inc.) and 50 µCi of α-[32P]-dATP (Amersham-Pharmacia, Piscataway, NJ
USA). Unincorporated nucleotides were removed by spin column chromatography (BioSpin P30; Bio-Rad Inc., Her-cules, CA USA). The probes were hybridized to the mem-branes without denaturation using Ultrahyb™ (Ambion Inc.) at 42°C overnight. After hybridization, the mem-branes were washed in 2X SSC (0.3 M sodium chloride, 0.03 M sodium citrate)/0.5% SDS followed by 3 washes in 1X SSC/ 0.1% SDS at 65°C for 30 min and a final high stringency wash in 0.1X SSC/ 0.1%SDS at 65°C for 30 min. The northern blots were exposed to Kodak XAR auto-radiography film for 18 to 72 h at -80°C. After autoradi-ography, the probe was degraded and removed from the membranes using Strip-EZ™ reagents (Ambion Inc.).
Ribonuclease protection assay
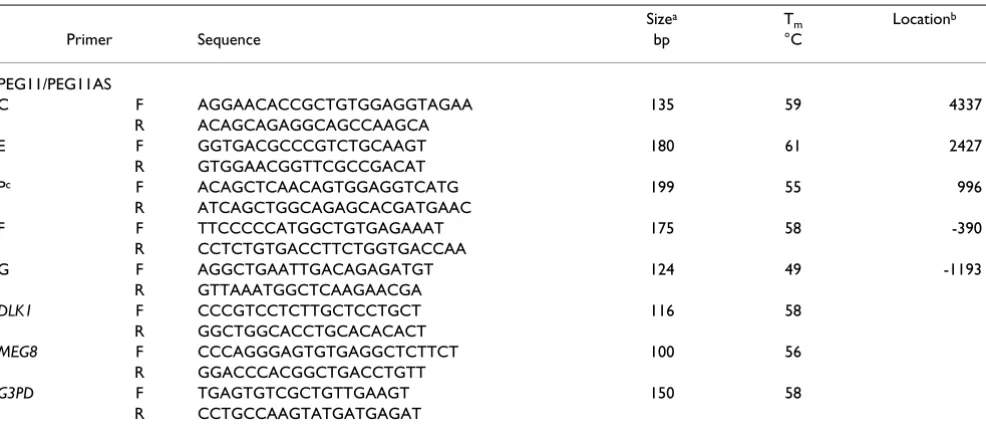
Templates for synthesizing strand specific RNA probes for the ribonuclease protection assay (RPA) were generated from PCR products (Table 2) by ligation of double stranded oligonucleotides containing T7 or SP6 promoter sequences and re-amplification with an adapter and gene specific primer (Lig'n Scribe™, Ambion Inc.). Labeled RNA probes were synthesized using MAXIscript™ reagents (Ambion, Inc.) and 50 µCi of α-[32P]-UTP
(Amersham-Pharmacia). The RPA were conducted using RPA III™
rea-gents (Ambion Inc.) and standard urea/acrylamide gel electrophoresis methods [37]. Dried gels were exposed to phosphorimaging screens and images were collected using a Cyclone Storage Phosphorimager (Packard Instru-ment Co., Meriden, CT USA).
Quantitative PCR
Complementary DNA was synthesized from 3.2 µg of total RNA using random hexamer priming and MMLV reverse transcriptase reagents (Invitrogen, Carlsbad, CA USA) with RNase inhibitor supplementation (Superase Inhibitor, Ambion Inc). The cDNA samples were diluted with water and aliquoted so that the quantification was based on 213 ng of total RNA for analysis of glyceralde-hyde-3-phosphate dehydrogenase, DLK1 and MEG8 tran-scripts. PEG11 and PEG11AS transcripts were measured using gene-specific priming of cDNA synthesis from 1.6
µg of total RNA. The cDNA was diluted with water and aliquoted for quantification based on 400 ng of total RNA. Each cDNA sample was amplified in triplicate using the SYBR Green Jump Start™ system (Sigma-Aldridge, St. Louis, MO USA). Quantification standards were com-posed of aliquots of plasmids containing target PCR prod-ucts in 10-fold serial dilutions ranging from 108 to 102
molecules. The standards were used to calculate a regres-sion of threshold cycle on molecule copy number to deter-mine a log value of starting abundance for each of the cDNA samples based on their threshold cycle. The PCR reactions were run for 40 cycles in an iCycler Real-Time PCR Detection System (Bio-Rad Inc.). The log value of starting abundance for each gene was analyzed by analysis
Table 2: Primer sequences for ribonuclease protection assay probes and quantitative PCR
Sizea T
m Locationb
Primer Sequence bp °C
PEG11/PEG11AS
C F AGGAACACCGCTGTGGAGGTAGAA 135 59 4337
R ACAGCAGAGGCAGCCAAGCA
E F GGTGACGCCCGTCTGCAAGT 180 61 2427
R GTGGAACGGTTCGCCGACAT
Pc F ACAGCTCAACAGTGGAGGTCATG 199 55 996
R ATCAGCTGGCAGAGCACGATGAAC
F F TTCCCCCATGGCTGTGAGAAAT 175 58 -390
R CCTCTGTGACCTTCTGGTGACCAA
G F AGGCTGAATTGACAGAGATGT 124 49 -1193
R GTTAAATGGCTCAAGAACGA
DLK1 F CCCGTCCTCTTGCTCCTGCT 116 58
R GGCTGGCACCTGCACACACT
MEG8 F CCCAGGGAGTGTGAGGCTCTTCT 100 56
R GGACCCACGGCTGACCTGTT
G3PD F TGAGTGTCGCTGTTGAAGT 150 58
R CCTGCCAAGTATGATGAGAT
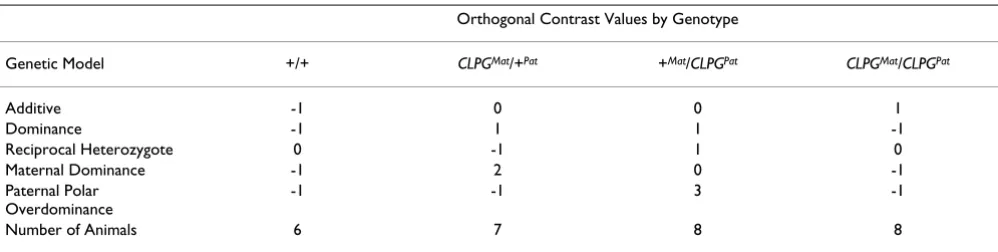
of variance using the PROC MIXED procedure of SAS [38]. The analysis model included genotype as a fixed effect and animal within genotype as a random effect. The number of animals representing each genotype (6 to 8) is given in Table 3. Orthogonal contrasts were used to evaluate differ-ent models of gene action if the effect of genotype on log value of starting abundance was significant. Initially, tra-ditional additive, dominance and reciprocal heterozygote effects were evaluated (see Table 3 for contrasts). If the reciprocal heterozygote effect was significant (p < 0.05), a second set of orthogonal contrasts was used to test addi-tive, maternal dominance and polar overdominance effects as previously described by Freking et al. [10] (Table 3).
Authors' contributions
CB participated in planning the study and developing the experimental design, conducted the northern blot analy-sis and ribonuclease protection assays, and wrote the drafts of the manuscript. LK and AP isolated RNA and per-formed the quantitative PCR assays. TH collected the mus-cle samples and genotyped the animals used in this study. DM participated in experimental design and performed the statistical analysis. NC participated in planning the study, set up a series of matings to generate all four geno-types and provided the experimental animals. All authors read and approved the final manuscript.
Acknowledgements
This project was supported by funds from the USDA/NRI (2002-35205-11602) and the Purdue University Agricultural Research Program (paper No. 17430). The authors acknowledge Michel Georges and Carole Char-lier, University of Liège, Belgium, for providing DNA sequence and PCR primer data and thank Christine Bynum, Anne Danielsson and David For-rester for their assistance with this experiment.
References
1. Cockett NE, Jackson SP, Shay TL, Nielsen D, Moore SS, Steele MR,
Barendse W, Green RD, Georges M: Chromosomal localization
of the callipyge gene in sheep (Ovis aries) using bovine DNA markers.Proc Natl Acad Sci USA 1994, 91(8):3019-3023.
2. Fahrenkrug SC, Freking BA, Rexroad CE III, Leymaster KA, Kappes
SM, Smith TPL: Comparative mapping of the ovine clpg locus.
Mamm Genome 2000, 11:871-876.
3. Charlier C, Segers K, Wagenaar D, Karim L, Berghmans S, Jaillon O,
Shay T, Weissenbach J, Cockett N, Gyapay G, Georges M:
Human-ovine comparative sequencing of a 250-kb imprinted domain encompassing the callipyge (clpg) locus and identification of six imprinted transcripts: DLK1, DAT, GTL2, PEG11, antiPEG11, and MEG8.Genome Res 2001, 11(5):850-862.
4. Jackson SP, Green RD, Miller MF: Phenotypic characterization of
rambouillet sheep expressing the callipyge gene: I. Inherit-ance of the condition and production characteristics.J Anim
Sci 1997, 75(1):14-18.
5. Jackson SP, Miller MF, Green RD: Phenotypic characterization of
rambouillet sheep expressing the callipyge gene: II. Carcass characteristics and retail yield.J Anim Sci 1997, 75(1):125-132.
6. Jackson SP, Miller MF, Green RD: Phenotypic characterization of
rambouillet sheep expression the callipyge gene: III. Muscle weights and muscle weight distribution. J Anim Sci 1997, 75(1):133-138.
7. Freking BA, Keele JW, Nielsen MK, Leymaster KA: Evaluation of
the ovine callipyge locus: II. Genotypic effects on growth, slaughter, and carcass traits.J Anim Sci 1998, 76(10):2549-2559.
8. Koohmaraie M, Shackelford SD, Wheeler TL, Lonergan SM, Doumit
ME: A muscle hypertrophy condition in lamb (callipyge): characterization of effects on muscle growth and meat qual-ity traits.J Anim Sci 1995, 73(12):3596-3607.
9. Cockett NE, Jackson SP, Shay TL, Farnir F, Berghmans S, Snowder
GD, Nielsen DM, Georges M: Polar overdominance at the ovine
callipyge locus.Science 1996, 273(5272):236-238.
10. Freking BA, Keele JW, Beattie CW, Kappes SM, Smith TP, Sonstegard
TS, Nielsen MK, Leymaster KA: Evaluation of the ovine callipyge
locus: I. Relative chromosomal position and gene action.J Anim Sci 1998, 76(8):2062-2071.
11. Segers K, Vaiman D, Berghmans S, Shay T, Meyers S, Beever J,
Cock-ett N, Georges M, Charlier C: Construction and
characteriza-tion of an ovine BAC contig spanning the callipyge locus.Anim Genet 2000, 31(6):352-359.
12. Miyoshi N, Wagatsuma H, Wakana S, Shiroishi T, Nomura M, Aisaka
K, Kohda T, Surani MA, Kaneko-Ishino T, Ishino F: Identification of
an imprinted gene, Meg3/Gtl2 and its human homologue MEG3, first mapped on mouse distal chromosome 12 and human chromosome 14q.Genes Cells 2000, 5(3):211-220.
13. Schmidt JV, Matteson PG, Jones BK, Guan XJ, Tilghman SM: The
Dlk1 and Gtl2 genes are linked and reciprocally imprinted.
Genes Dev 2000, 14(16):1997-2002.
14. Takada S, Tevendale M, Baker J, Georgiades P, Campbell E, Freeman
T, Johnson MH, Paulsen M, Ferguson-Smith AC: Delta-like and Gtl2
are reciprocally expressed, differentially methylated linked imprinted genes on mouse chromosome 12.Curr Biol 2000, 10(18):1135-1138.
15. Wylie AA, Murphy SK, Orton TC, Jirtle RL: Novel imprinted
DLK1/GTL2 domain on human chromosome 14 contains motifs that mimic those implicated in IGF2/H19 regulation.
Genome Res 2000, 10(11):1711-1718. Table 3: Statistical methods for genetic models
Orthogonal Contrast Values by Genotype
Genetic Model +/+ CLPGMat/+Pat +Mat/CLPGPat CLPGMat/CLPGPat
Additive -1 0 0 1
Dominance -1 1 1 -1
Reciprocal Heterozygote 0 -1 1 0
Maternal Dominance -1 2 0 -1
Paternal Polar Overdominance
-1 -1 3 -1
Publish with BioMed Central and every scientist can read your work free of charge "BioMed Central will be the most significant development for disseminating the results of biomedical researc h in our lifetime."
Sir Paul Nurse, Cancer Research UK
Your research papers will be:
available free of charge to the entire biomedical community
peer reviewed and published immediately upon acceptance
cited in PubMed and archived on PubMed Central
yours — you keep the copyright
Submit your manuscript here:
http://www.biomedcentral.com/info/publishing_adv.asp
BioMedcentral
16. Laborda J, Sausville E, Hoffman T, Notario V: Dlk, a putative
mam-malian homeotic gene differentially expressed in small cell lung carcinoma and neuroendocrine tumor cell line. J Biol
Chem 1993, 268(6):3817-3820.
17. Smas CM, Sul HS: Pref-1, a protein containing EGF-like
repeats, inhibits adipocyte differentiation. Cell 1993,
73:725-734.
18. Okamoto M, Takemori H, Halder SK, Nonaka Y, Osamu H:
Implica-tion of Zog protein (zona glomerulosa-specific protein) in zone development of the adrenal cortex. Endocr Res 1998, 24(3&4):515-520.
19. Helman LJ, Sack N, Plon SE, Israel MA: The sequence of an adrenal
specific human cDNA, pG2.Nucleic Acids Res 1990, 18:685.
20. Jensen C, Krogh T, Hojrup P, Clausen P, Skjodt K, Larsson L, Enghild
J, Teisner B: Protein structure of fetal antigen 1 (FA1). A novel
circulating human epidermal-growth-factor-like protein expressed in neuroendocrine tumors and its relation to the gene products of dlk and pG2.Eur J Biochem 1994, 225(1):83-92.
21. Paulsen M, Takada S, Youngson NA, Benchaib M, Charlier C, Segers
K, Georges M, Ferguson-Smith AC: Comparative sequence
anal-ysis of the imprinted Dlk1-Gtl2 locus in three mammalian species reveals highly conserved genomic elements and refines comparison with the Igf2-H19 region.Genome Res 2001, 11(12):2085-2094.
22. Seitz H, Youngson N, Lin S-P, Dalbert S, Paulsen M, Bachellerie J-P,
Ferguson-Smith AC, Cavaillé J: Imprinted microRNA genes
tran-scribed antisense to a reciprocally imprinted retrotranspo-son-like gene.Nat Genet 2003, 34(3):261-262.
23. Freking BA, Murphy SK, Wylie AA, Rhodes SJ, Keele JW, Leymaster
KA, Jirtle RL, Smith TPL: Identification of the single base change
causing the callipyge muscle hypertrophy phenotype, the only known example of polar overdominance in mammals.
Genome Res 2002, 12(10):1496-1506.
24. Smit M, Segers K, Carrascosa LG, Shay T, Baraldi F, Gyapay G,
Snow-der G, Georges M, Cockett N, Charlier C: Mosaicism of Solid
Gold supports the causality of a noncoding A-to-G transition in the determinism of the callipyge phenotype.Genetics 2003, 163(1):453-456.
25. Charlier C, Segers K, Karim L, Shay T, Gyapay G, Cockett N, Georges
M: The callipyge mutation enhances the expression of coreg-ulated imprinted genes in cis without affecting their imprint-ing status.Nat Genet 2001, 27(4):367-369.
26. Bidwell CA, Shay TL, Georges M, Beever JE, Berghmans S, Cockett
NE: Differential expression of the GTL2 gene within the cal-lipyge region of ovine chromosome 18. Anim Genet 2001, 32(5):248-256.
27. Georges M, Charlier C, Cockett N: The callipyge locus: evidence
for the trans interaction of reciprocally imprinted genes.
Trends Genet 2003, 19(5):248-252.
28. Lin S-P, Youngson N, Takada S, Seitz A, Reik W, Paulsen M, Cavaille
J, Ferguson-Smith AC: Asymmetric regulation of imprinting on
the maternal and paternal chromosomes at the Dlk1-Gtl2 imprinted cluster on mouse chromosome 2.Nat Genet 2003, 35(1):97-102.
29. Schuster-Gossler K, Bilinski P, Sado T, Ferguson-Smith A, Gossler A:
The mouse Gtl2 gene is differentially expressed during embryonic development, encodes multiple alternatively spliced transcripts, and may act as an RNA.Dev Dyn 1998, 212(2):214-228.
30. Volpe TA, Kidner C, Hall IM, Teng G, Grewal SIS, Martienssen RA:
Regulation of heterochromatic silencing and histone H3 lysine-9 methylation by RNAi. Science 2002, 297(5588):1833-1837.
31. Hall IM, Shankaranarayana GD, Noma K-i, Ayoub N, Cohen A,
Gre-wal SIS: Establishment and maintenance of a
heterochroma-tin domain.Science 2002, 297(5590):2232-2237.
32. Verdel A, Jia S, Gerber S, Sugiyama T, Gygi S, Grewal SIS, Moazed D:
RNAi-mediated targeting of heterochromatin by the RITS complex.Science 2004, 303(5658):672-676.
33. Hannon GJ: RNA interference.Nature 2002, 481:246-251.
34. Cerutti H: RNA interference: traveling in the cell and gaining
functions?Trends Genet 2003, 19(1):39-46.
35. Shi Y: Mammalian RNAi for the masses. Trends Genet 2003,
19(1):9-12.
36. Chirgwin JM, Przybyla AE, MacDonald RJ, Rutter WJ: Isolation of
biologically active ribonucleic acid from sources enriched in ribonuclease.Biochemistry 1979, 24:5294-5299.
37. Sambrook J, Russell DW: Molecular cloning: a laboratory
man-ual,. 3rd edition. Cold Spring Harbor: Cold Spring Harbor Labora-tory Press; 2001.