Telephone: +44 (0)1582 763133 Web: http://www.rothamsted.ac.uk/
Rothamsted Research is a Company Limited by Guarantee Registered Office: as above. Registered in England No. 2393175. Registered Charity No. 802038. VAT No. 197 4201 51. Founded in 1843 by John Bennet Lawes.
Rothamsted Repository Download
A - Papers appearing in refereed journals
Prins, A., Mukubi, J. M., Pellny, T. K., Verrier, P. J., Beyene, G., Lopes,
M. S., Emami, K., Treumann, A., Lelarge-Trouverie, C., Noctor, G.,
Kunert, K. J., Kerchev, P. and Foyer, C. H. 2011. Acclimation to high
CO2 in maize is related to water status and dependent on leaf rank.
Plant, Cell & Environment. 34 (2), pp. 314-331.
The publisher's version can be accessed at:
•
https://dx.doi.org/10.1111/j.1365-3040.2010.02245.x
The output can be accessed at:
https://repository.rothamsted.ac.uk/item/8q7q0
.
© Please contact [email protected] for copyright queries.
Acclimation to high CO
2in maize is related to water status
and dependent on leaf rank
pce_2245314..331ANNEKE PRINS1, JOSEPHINE MUCHWESI MUKUBI1, TILL K. PELLNY2, PAUL J. VERRIER3, GETU BEYENE1,
MARTA SILVA LOPES4, KAVEH EMAMI5, ACHIM TREUMANN5, CAROLINE LELARGE-TROUVERIE6,
GRAHAM NOCTOR6, KARL J. KUNERT1, PAVEL KERCHEV7& CHRISTINE H. FOYER7
1Forestry and Agricultural Biotechnology Institute, Plant Science Department, University of Pretoria, Pretoria 0002, South
Africa,2Centre for Crop Genetic Improvement, Department of Plant Sciences and,3Centre for Mathematical and
Computational Biology, Department of Biomathematics and Bioinformatics, Rothamsted Research, Harpenden,
Hertfordshire, UK,4CIMMYT, Apdo. Postal 6-641, 06600 México, D.F., Mexico,5NEPAF Proteome Analysis Facility,
Newcastle University, Newcastle upon Tyne, NE1 7RU, UK,6Institut de Biologie des Plantes, Université de Paris sud XI,
91405 Orsay cedex, France and7Centre for Plant Sciences, Institute of Integrative and Comparative Biology, Faculty of
Biological Sciences, University of Leeds, Leeds, LS2 9JT, UK
ABSTRACT
The responses of C3plants to rising atmospheric CO2levels
are considered to be largely dependent on effects exerted through altered photosynthesis. In contrast, the nature of the responses of C4plants to high CO2remains
controver-sial because of the absence of CO2-dependent effects on
photosynthesis. In this study, the effects of atmospheric CO2
availability on the transcriptome, proteome and metabo-lome profiles of two ranks of source leaves in maize (Zea maysL.) were studied in plants grown under ambient CO2
conditions (350+/-20mL L-1CO
2) or with CO2enrichment
(700+/-20mL L-1CO
2). Growth at high CO2had no effect
on photosynthesis, photorespiration, leaf C/N ratios or anthocyanin contents. However, leaf transpiration rates, car-bohydrate metabolism and protein carbonyl accumulation were altered at high CO2 in a leaf-rank specific manner.
Although no significant CO2-dependent changes in the leaf
transcriptome were observed, qPCR analysis revealed that the abundance of transcripts encoding a Bowman–Birk pro-tease inhibitor and a serpin were changed by the growth CO2level in a leaf rank specific manner. Moreover, CO2
-dependent changes in the leaf proteome were most evident in the oldest source leaves. Small changes in water status may be responsible for the observed responses to high CO2,
particularly in the older leaf ranks.
Key-words: CO2 assimilation; CO2 enrichment; protease
inhibitors; redox regulation; sugar signalling.
INTRODUCTION
Global atmospheric CO2 concentrations have risen from
about 270mL L-1in pre-industrial times to the present level
of over 380mL L-1. Values are predicted to reach between
530 and 970mL L-1by the end of this century. Moreover, the
capacity of the earth’s oceans to absorb CO2from the
atmo-sphere is considered to be reaching saturation point (Khati-wala, Primeau & Hall 2009). Average global temperatures have increased by about 0.76 °C over the last 150 years and they are likely to increase by another 1.7 to 3.9 °C during this century. In theory, plants could mitigate these changes
through photosynthetic conversion of atmospheric CO2into
carbohydrates and other organic compounds. However, the potential for this mitigation remains uncertain and the
impact of predicted increases in atmospheric CO2and global
temperatures on plant productivity is a growing concern for
agriculture and food security worldwide (Longet al. 2004;
Longet al. 2006). In plants that use the C3pathway of
pho-tosynthesis, the predicted changes in atmospheric CO2
con-centrations and the temperature of the earth will directly influence the balance between photosynthetic carbon fixa-tion and photorespirafixa-tion, and also plant C/N relafixa-tionships
as atmospheric CO2enrichment inhibits the assimilation of
nitrate into organic nitrogen compounds (Foyeret al. 2009).
The anticipated changes in the Earth’s environment will therefore influence partitioning between these pathways, and as a consequence influence the distribution of plants
with different carbon fixation pathways (Wand et al. 1999;
Ward et al. 1999; Zhu, Goldstein & Bartholomew 1999).
In the C3 pathway of photosynthesis, CO2 enters the
Benson-Calvin cycle directly by the action of ribulose 1, 5-bisphosphate carboxylase oxygenase (Rubisco). In
con-trast, the C4 pathway of photosynthesis incorporates an
endogenous CO2-concentrating mechanism where CO2 is
first incorporated into organic acids in the mesophyll cells.
By virtue of this CO2-concentrating mechanism CO2
-limitations at the Rubisco active site in the bundle sheath
cells are diminished. Hence, increasing atmospheric CO2is
predicted to have less impact on plants with the C4pathway
of photosynthesis than their C3counterparts.
Elevated CO2concentrations decrease photorespiration
and initially enhance photosynthesis and growth as much as
35% in most C3plants (Longet al. 2004; Longet al. 2006).
The high CO2-dependent enhancement of photosynthesis,
however, diminishes over time (days to years), a
phenom-enon known as CO2acclimation (Paul & Foyer 2001). This
process, which involves loss of Rubisco protein and activity,
is largely absent from C4plants, where these enzymes have
already acclimated to functioning under high CO2
condi-tions. However, there is considerable variation in the
responses of different C4species to enhanced CO2(Maroco,
Edwards & Ku 1999; Wardet al. 1999; Ziska & Bunce 1999;
Cousins et al. 2001). Some C4 plants show acclimation to
high CO2(Soareset al. 2007) this is generally not related to
effects on photosynthesis, which is largely unchanged (Sage
1994; Ghannoumet al. 1997, 2001; Wand, Midgley & Stock
2001; Leakeyet al. 2006).
Atmospheric CO2 availability exerts a strong influence
on stomatal density and patterning (Taylor et al. 1994,
2008; Larkin et al. 1997; Croxdale 1998; Masle 2000; Lake
et al. 2001; Lake, Woodward & Quick 2002; Poorter & Navas 2003; Martin & Glover 2007). Signals concerning
CO2 availability appear to be transmitted from older to
developing leaves in C3 plants (Lake et al. 2001, 2002;
Woodward 2002). Growth at enhanced atmospheric CO2
concentrations often leads to a decrease in stomatal density (Woodward, Lake & Quick 2002). However, this acclimation response varies considerably between species
(Woodward & Kelly 1995). High CO2-dependent increases
in stomatal index have been observed in two
monocoty-ledonous C4 species, maize and Paspalum dilatatum
(Driscoll et al. 2006; Soares et al. 2007; Soares-Cordeiro
et al. 2009). The CO2-signalling pathways that orchestrate
such changes in epidermal patterning and leaf structure, function and composition remain poorly characterized
(Gray et al. 2000; Ferris et al. 2002), but it is generally
accepted that the signals that regulate such responses are
systemic in nature (Coupe et al. 2006; Miyazawa,
Living-ston & Turpin 2006). Carbonic anhydrases have recently been considered to be important components of plant
CO2-signalling pathways (Hu et al. 2010). Arabidopsis
thaliana double-mutants lacking two B-carbonic
anhy-drases (B-CA1 and B-CA4) higher stomatal densities but impaired stomatal movements in response to changing
CO2levels (Huet al. 2010).
The stability of internal CO2 (Ci) with changing CO2
fixation rates suggests that leaves are able to sense and
signal information concerning Ci (Warren 2008), rather
than atmospheric CO2 (Mott 1988). The guard cells of
stomata are able to sense an array of endogenous and
envi-ronmental signals including CO2availability. Atmospheric
CO2can induce either stomatal opening or closure
depend-ing on concentration by influencdepend-ing the patterns of repeti-tive calcium transients within the guard cells that are linked to changes in ion channel activities and potassium efflux.
Like abscisic acid (ABA), high CO2 participates in a
complex network of signalling events that cause an
inhibi-tion of K+inward rectifying channels and an activation of K+
outward rectifying channels that enhances potassium efflux and consequently results in stomatal closure (Acharya & Assmann 2009).
The regulation of stomatal closure in relation to Ci is
complex (von Caemmerer et al. 2004; Baroli et al. 2008;
Mott, Sibbernsen & Shope 2008), and probably involves signals in the vapor phase that transmit information con-cerning the redox state of the chloroplast. However, com-pared with the extensive literature on systemic light
signalling responses (Karpinski et al. 1999; Rossel et al.
2007; Muhlenbock et al. 2008), little information is
avail-able concerning systemic CO2 signalling pathways in
plants (Baroli et al. 2008; Mott et al. 2008) and very few
CO2 signalling components have been identified (Gray
et al. 2000). Systemic light signalling is triggered by the photosynthetic electron transport chain in the high-light-exposed leaves and involves salicylic acid (SA)-, jasmonic
acid (JA)- and ethylene (ET)-dependent pathways
(Karpinskiet al. 1999; Fryeret al. 2003; Rosselet al. 2007;
Muhlenbock et al. 2008). Here, we have studied how the
leaves of maize, an economically important C4 species,
respond to enhanced atmospheric CO2availability. Maize
plants were grown for up to 8 weeks either under the
ambient CO2 conditions of our laboratories (350 +/
-20mL L-1CO
2) or with CO2enrichment (700+/-20mL L-1
CO2). We have combined classic whole plant physiology
and -omics approaches to characterize the acclimation of
two ranks of maize source leaves to high CO2and to use
this information to provide information on possible CO2
signalling mechanisms.
MATERIALS AND METHODS
Plant material and growth conditions
Zea mays L. hybrid H99 plants were grown for up to
8 weeks in compost (Driscollet al. 2006) in duplicate
con-trolled environment cabinets (Sanyo 970, Sanyo, Osaka,
Japan) where the atmospheric CO2 was maintained at
either 350mL L-1 or at 700mL L-1. In total six controlled
environment cabinets were used in these experiments. Each cabinet contained plants grown under one of the conditions
earlier, i.e. either ‘ambient’ conditions or ‘high CO2’. In
total, three cabinets were set at the ambient CO2 levels
whereas the other three were maintained at the high CO2
level. The data or harvests obtained from plants in each cabinet were pooled so that there is a one-to-one match of cabinets and pools.
In all cases, the plants were grown with a 16 h
photope-riod (700mmol m-2s-1) and the temperature was
main-tained at 25 °C (day) and 19 °C (night) with 80% relative
humidity. The CO2 was supplied from a bulk container,
transmitted via a Vaisala GMT220 CO2 transmitter
(Vaisala Oyj, Helsinki, Finland), and maintained by a Eurotherm 2704 controller (Eurotherm Ltd., Worthing,
UK), which kept CO2 levels at 350⫾20mL L-1 or
700⫾20mL L-1. All plants were watered daily throughout
Leaf parameters, water use efficiencies and photosynthesis measurements
The whole leaf weight and leaf area measurements were performed on each leaf rank at the 13-leaf stage. Leaf area
measurements were performed using a DT area meter
(Delta-T Devices Ltd., Cambridge, England). Intrinsic water use efficiencies were determined according to
Soares-Cordeiro et al. (2009). Photosynthetic gas exchange
mea-surements were performed as described previously
(Driscollet al. 2006).
Anthocyanin, chlorophyll and pheophytin determinations
Fresh weight and dry weight measurements were per-formed on each leaf rank at the 13-leaf stage. Leaf discs
(8 cm2) were cut from the centre of each leaf. Leaf mass was
measured before and after the tissue was dried in an oven for 3 d at 60°C. Leaf anthocyanins were extracted and assayed in separate maize discs harvested as earlier, accord-ing to Sims & Gamon (2002). Chlorophyll was measured in the same tissues according to Wintermans & De Mots (1965) and the pheophytin content was determined accord-ing to Vernon (1960).
Metabolome and amino acid analyses
Samples from leaf rank 5 on 9-week-old plants were harvested and frozen immediately in liquid nitrogen. Four independent extracts per plant were analyzed by gas chro-matography time-of-flight mass spectrometry (GC-TOF
MS), using a method adapted from Noctor et al. (2007).
Ninety-four derivatives corresponding to 88 unique metabolites were identified by reference to their mass spectra. Peak intensities were normalized to an internal standard (ribitol) and then to leaf chlorophyll contents, and metabolites showing a statistically significant difference
between the two conditions were identified by t-test
(P<0.05).
Leaf temperature and total C and N contents
Leaf temperature was measured on all leaf ranks of 3-week-old plants. Whole leaves were then harvested and frozen immediately in liquid nitrogen. Total C and N contents were measured by elemental analysis (EA1108, Series 1, Carlo Erba Istrumentazione, Milan, Italy).
Measurements of leaf sucrose, hexoses and starch
Leaf sucrose, hexoses and starch measurements were per-formed on each leaf rank at 13-leaf stage. Whole leaves were harvested and immediately frozen in liquid nitrogen in the growth cabinets. Leaf sucrose and hexose were extracted and assayed according to Jones, Outlaw & Lowry
(1977). Starch was extracted and assayed in the same samples according to the method of Paul & Stitt (1993).
Measurement of the extent of leaf protein carbonylation
Protein carbonylation assays were performed on each leaf rank at 13-leaf stage. Whole leaves were harvested and immediately frozen in liquid nitrogen in the growth cabi-nets. The composition and extent of protein carbonyl group formation was measured using the OxyBlot™ Oxidized Protein Detection Kit (Chemicon International, Harrow, UK).
RNA extraction methods
Micro-analyses were performed on samples (in triplicate) of rank 3 and rank 12 leaves from separate plants at 13-leaf stage. Three separate sets of leaf samples were prepared per leaf rank and per treatment. Each individual sample was made up of three whole pooled leaves taken from three separate plants. The samples were as follows: (1) leaf rank 3
under ambient CO2 conditions; (2) leaf rank 12 under
ambient CO2 conditions; (3) leaf rank 3 under high CO2
conditions; and (4) leaf rank 12 under high CO2conditions.
Total RNA was extracted using Trizol reagent (Invitrogen, Paisley, UK).
For qPCR, RNA was extracted from pooled samples of
three biological replicates grown in either air or with CO2
enrichment, representing each leaf on the stem. For the feeding study, total RNA was extracted from 400 mg of frozen tissue obtained from pooled tissue of 10 biological replicates. Total RNA was purified with RNeasy Mini Spin Columns (Qiagen GmbH, Hilden, Germany).
Microarray hybridization techniques
Purified RNA samples were sent to ArosAB, Aarhus, Denmark, where they were converted to cDNA and used to synthesize biotin-labelled cRNA (BioArray High Yield RNA Transcript Labeling Kit, Enzo, Farmingdale, NY, USA). Labelled cRNA was hybridized to maize microarray chips (Affymetrix, Santa Clara, CA, USA) for samples iso-lated from air-grown plants giving rise to 12 microarray chips representing three biological replicates of the young
and old plants grown in air and high CO2levels. The corn
microarrays cover approximately 14 k probesets, which represent less than 10 k genes. Each chip was washed and scanned in a GeneChip Scanner 3000 (Affymetrix). Microarray data are available in the ArrayExpress database (http://www.ebi.ac.uk/arrayexpress) under acces-sion number E-MEXP-1222.
Microarray analysis
Gene expression profiles were then compared using
asymptotic unpairedt-test and subjected to multiple testing correction (Benjamini Hochberg FDR). A cut-off with
P-value<0.05 and log2 expression ratio⫾1 was adopted.
The probe targets were as defined by Affymetrix (https:// www.affymetrix.com/analysis/netaffx/index.affx) and these targets were used to guide annotation of the genes through the use of BLAST against the TAIR (http:// www.arabidopsis.org/) database. Transcripts were identified according to Unigene cluster (http://www.ncbi.nlm.nih.gov/ UniGene; Pontius, Wagner & Schuler 2003) and translated homology search (tblastx) on the NCBI protein refseq data-base and on the trembl (EBI) data set with the criteria of
minimum score of 50% and e-value ofⱕ10–7 for selecting
potentially significant homology to the Affymetrix supplied target sequences as the subjects for comparison.
Sugar and pro-oxidant treatments
Ten leaves from plants grown in ambient CO2were cut into
sections (1 cm2) under 10 mM Hepes buffer (pH 7.0). The
leaf sections (30 per treatment) were incubated in 10 mM Hepes buffer (pH 7.0) alone or buffer containing 50 mM
fructose, 50 mM glucose, 50 mM sucrose, 20 mM H2O2 or
1 mM methyl viologen. Leaf sections were incubated for 16 h in the dark in the above solutions, after which time the leaf sections were harvested for real-time (qPCR) analysis.
Real-time (qPCR) analysis
Purified total RNA was first treated with DNAse I (ampli-fication grade; Invitrogen). The first strand cDNA was then prepared using SuperScript II (Invitrogen). Quantitative PCR was performed using this template. Sequences for ubiquitin, thioredoxin and cyclophilin were selected as endogenous controls based on their equal expression values on microarray analysis. Primers were designed to amplify 50–53 bp amplicons present in the probesets on the microarray chips. Quantitative PCR was performed at least in triplicate using the Applied Biosystems 7500 Real-time PCR System (Applied Biosystems, Cheshire, UK) and SYBR green as intercalating dye (Sigma, Dorset, UK) with
the following cycling profile: 1¥50 °C (2 min), 1¥95 °C
(10 min), 40¥[95 °C (15 s), 60 °C (1 min)]. Relative
quan-titative analysis of transcripts was performed using the Applied Biosystems Detection Software (SDS) v1.2.1. Relative expression values were confirmed in each case by at least two endogenous controls.
Isolation of full-length serine-type protease inhibitors
Total RNA was extracted from leaf three pooled samples from six maize seedlings at the five-leaf stage using the TriPure total RNA isolation kit with contaminant genomic
DNA digested by RNase-free DNase. Total RNA (2mg
per sample) that had been subjected to reverse transcrip-tion using superscript III™ Reverse Transcriptase (RT) (Invitrogen, Carlsbad, CA, USA) was used as a template
in the PCR reaction. Full-length cDNA clones for the
Zea mays serine-type endopeptidase inhibitor (accession
numbers EF406275) and Bowman–Birk-type serine
pro-tease inhibitor (accession number EF406276) were
obtained by performing 5′ and 3′ rapid amplification of
cDNA ends (RACE) using the GeneRacer™ kit (Invitro-gen) together with gene-specific primers. Gene-specific
primers (forward 5′-tactcagctcaaggttgaaggcatgg-3′ and
reverse 5′-cgaatcacgcacactttggttcagag-3′) were used for
iso-lation of a full-length serine-type endopeptidase inhibitor
and primers (forward 5′-cctcagctgatactcgtcggcact-3′ and
reverse 5′-gaacgtcgtcacagcggtaggtga-3′) were used for
iso-lation of a full-length Bowman–Birk-type serine proteinase
inhibitor. The 5′RACE, 5′nested, 3′RACE and 3′nested
primers were provided with the GeneRacer™ kit (Invitro-gen) that were used together with the gene specific primers. All amplified PCR products were T/A cloned into PCR4-TOPO (which was also provided with GeneRacer Kit) and sequenced in both direction using M13 forward and reverse
primers. Inserts were sequenced using the BigDye®
Termi-nator Cycle Sequencing FS Ready Reaction Kit, v 3.1 on
ABI PRISM® 3100 automatic DNA-Sequencer (Applied
Biosystems, Foster City, CA, USA). The BLASTn and
BLASTp programs (Altschulet al. 1990) were used for gene
sequence homology search.
Analysis of putative serpin and BBI sequence isolated from maize
The cDNA sequences of EF406275 (putative serpin) and EF406276 (putative BBI) were analysed using online tools:
BLASTx at GenBank (Altschul et al. 1990), WU-blastn
V2.0 (http://blast.wustl.edu/; Gish & States 1993) on the EMBL database, ORF finder (http://www.ncbi.nlm.nih. gov/gorf/gorf.html), ProtParam and TargetP (http://www.
cbs.dtu.dk/services/TargetP/; Emanuelssonet al. 2000).
Phylogenetic analysis of putative serpin and BBI sequences
After identification of their coding sequences, protein homologs of the putative serpin and putative BBI genes were identified by translated homology search (BLASTx) at GenBank. Translated gene sequences were compared with protein homologs by phylogenetic comparison, the alignments being determined by ClustalW (as implemented in the VectorNTI package), and the best unrooted tree was generated with PAUP4* in default parameter configuration and the resultant trees were displayed using the PhyloDraw package. Sequence data from this article can be found in the EMBL/GenBank data libraries under accession number EF406275 and EF406276
Proteomic analysis
electrophoresis according to instructions in the handbook
2-D Electrophoresis: Principles and Methods(GE
Health-care, Piscataway, NJ, USA). Three technical replicates were prepared from each extraction. Proteins were precipitated after grinding leaf material in liquid nitrogen. Ground leaf material (200–250 mg) was incubated overnight at –20°C in precipitation buffer (1 mL) containing TCA (10%, w/v) andb-mercaptoethanol (0.07% v/v) in acetone (100%, v/v). Precipitated protein was pelleted by centrifuging for
25 min at 4°C at 20 000g and washed six times with ice
cold washing buffer containing acetone (90%, v/v) and b-mercaptoethanol (0.07% v/v) in Milli-Q water. Proteins were solubilized in sample buffer (1 mL) containing urea (8 M), CHAPS (2%, w/v), dithiothreitol (DTT; 60 mM), and IPG buffer pH 4–7 (0.5%, v/v) (GE Healthcare), by sonica-tion in an ultrasonic water bath for 1 h, with vortexing at 15 min intervals. Samples were then incubated in a heating block for 1.5 h at 30 °C with vortexing at 15 min intervals before overnight incubation at room temperature for optimal protein solubilization. Cell debris was removed by
centrifugation for 25 min at 20 000g. Solubilized proteins
were quantified using the Bradford assay (Bradford 1976) and ovalbumin (Sigma) as standard (Ramagli 1999). Four hundred fifty micrograms of the protein extracts were
diluted in 250mL rehydration buffer (7 M urea, 2 M
thio-urea, 0.75% (w/v) CHAPS, 0.75% (v/v) Triton X 100, 100 mM DTT, a trace of bromophenol blue, 2% (v/v) IPG buffer pH 4–7; GE Healthcare). Samples were then loaded onto 13 cm immobiline DryStrip gels pH 4–7 (GE Health-care) and run on an Ettan IPGphor II (GE Healthcare; rehydration, 20 h at 20 °C; 500 V for 1 h; 500 to 1000 V in 1 h; 1000 to 8000 V in 2:30 h; and hold at 8000 V for 55 min). IPG strips were then equilibrated first for 20 min in 50 mM Tris-HCl (pH 8.8), 6 M urea, 30% (w/v) glycerol, 2.3% (w/v) SDS, 1% (w/v) DTT, followed by 20 min in the same solution with DTT replaced with 4% (w/v) iodoacetamide. The IPG strips were then applied to 12.5% resolving gels and were run in an
SE 600 Ruby™, gel unit (GE Healthcare) at 25 mA gel-1for
5 h at 10 °C.The running buffer was 25 mM Trisbase, 192 mM glycine, 0.1% SDS. Finally the gels were stained in a 0.1% solution of Phastgel-blue R-350 (GE Healthcare) in 40% methanol and 7% acetic acid overnight and destained in 40% methanol, 7% acetic acid, at room temperature on an orbital shaker.The stained gels were scanned on a calibrated Ettan Gel Imager (GE Healthcare) before being subjected to image analysis.
Image analysis
Progenesis SameSpots software (Nonlinear Dynamics, Durham, NC, USA) was used for gel analysis. The spots were matched between all the gels by using the SameSpots approach. Background subtraction and volume normaliza-tion were carried out. Artefacts and non-protein spots were removed by editing the template image and were expanded to all gels using the SameSpots option. The gels were also
subjected to detailed Progenesis statistical analysis (t-test).
Protein spots of interest were excised using Harris spot
cutters (Sigma) before being subjected to in-gel digestion with trypsin and nano-liquid chromatography mass spec-trometry (LC MS)/MS analysis.
In-gel trypsin digest
Excised spots were washed with 25% (v/v) methanol and 7% (v/v) acetic acid for 12 h at room temperature, and
de-stained with 50 mM NH4HCO3in 50% (v/v) methanol
for 1 h at 40 °C. The gel pieces were then incubated in
10 mM DTT, 100 mM NH4HCO3for 1 h at 60 °C followed
by 40 mM iodoacetamide, 100 mM NH4HCO3for 30 min at
room temperature. The gel pieces were minced, dried,
rehy-drated in 100 mM NH4HCO3containing 1 pmol of trypsin
(Promega, Madison, WI, USA) and incubated at 37 °C over-night. The digested peptides were extracted from the gel slices with 0.1% TFA in 50% (v/v) acetonitrile/water three times. The peptide solution was dried, re-suspended in 30mL of 0.1% TFA/5% acetonitrile/water.
LC-MS/MS
LC-MS/MS analysis was performed at NEPAF, Cels Ltd., Newcastle, UK. Using an Ultimate 3000 nano-HPLC system (Dionex LC Packings, Camberley, UK), 10% of the digest
was injected at 20mL/min onto a 300mm¥50 mm PepMap
trap column (Dionex). After washing with 60mL of 0.1%
formic acid at 20mL/min, peptides were eluted through a
150 mm¥75mm PepMap column (Dionex) at 200 nL/min.
MS spectra were acquired on an HCT Proteome Discovery system (Bruker Daltonics, Bremen, Germany). A survey scan was conducted in standard enhanced mode (8100 Da/s) from m/z 400 to m/z 1600. The three most intense ions were fragmented and MS/MS scans were acquired in ultrascan mode (26 000 Da/s) from 50 to 2100 Da. Parent ions were dynamically excluded for 90 s after two MS/MS acquisitions. Up to 300 000 ions were accumulated in the linear trap with a maximum accumulation time of 120 s. Up to 750 spectra per LC/MS experiment were extracted from the data using Bruker DataAnalysis 3.4 software. MS/MS spectra were de-convoluted, converted to line spectra and exported as
mgf files for homology searches.The translatedOryza sativa
genome (as on 1 September 2008), the translated
Arabidop-sis thalianagenome (as on 1 September 2008) and a collec-tion of frequently occurring contaminating proteins [common Repository of Adventitious Proteins (cRAP)] and their reverse counterparts were searched using X!Tandem allowing for single amino acid substitutions and the gpm web interface at http://www.thegpm.org (Craig & Beavis, 2004). Search parameters and results were submitted to the gpm database and can be accessed through the hyperlinked Iden-tifier codes in the Supporting Information.
Statistical analysis
variance (anova). Data for all other physiological
param-eters was analyzed by the Student’st-test or least significant
difference (LSD) test.
Accession numbers
Putative serine proteinase inhibitor sequence was sub-mitted to GenBank (http://www.ncbi.nlm.nih.org) with accession number EF406275. Putative Bowman–Birk inhibitor sequence was submitted to GenBanks with accession number EF406276. Microarray data are avail-able in the ArrayExpress database (http://www.ebi.ac.uk/ arrayexpress) under accession number E-MEXP-1222.
RESULTS
High CO2effects on whole plant morphology and photosynthesis
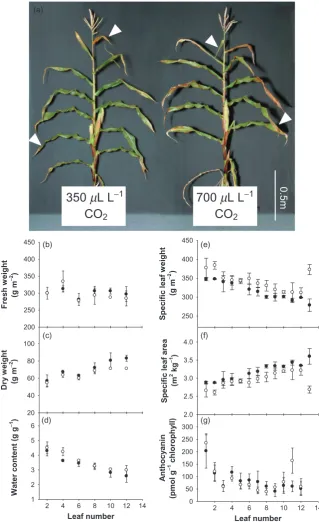
Maize plants were grown for up to 8 weeks (Fig. 1a) in
either ambient CO2conditions (350+/-20mL L-1CO2) or
with CO2enrichment (700+/-20mL L-1CO2). The plants
grown with CO2enrichment exhibited a similar overall
mor-phology to those grown under ambient CO2 conditions
(Fig. 1a). In an earlier study we reported that the maize
plants grown with CO2enrichment were taller than those
grown in air although they had the same number of leaves
(Driscollet al. 2006). However, the more systematic analysis
reported here revealed that there were small variations in the specifications of the controlled environment growth chambers used previously and that these had led to
differ-ences in overall plant height (Driscoll et al. 2006). These
small but important variations were eliminated in the present study by randomization of chamber usage. The data
presented here shows that growth with CO2enrichment has
no effect on the height of the maize plants.
There were no significant differences in the fresh weights (Fig. 1b), the dry weights (Fig. 1c), or tissue water contents (Fig. 1d) of leaves at equivalent positions on the stem. The leaf fresh weight values were similar regardless of ontogeny, but the dry weight values were greatest in the young leaves and decreased with leaf position on the stem (1 to 12). The leaves in ranks 1–5 had the lowest dry weight values (Fig. 1c). Similarly, the tissue water content was greatest in leaf ranks 1–5 and decreased gradually with the leaf posi-tion on the stem, the young leaves having the lowest tissue water contents (Fig. 1d). Specific leaf weight and specific leaf area values were similar under both ambient and high
CO2conditions in all except the youngest leaves (Fig. 1e, f).
Leaf total anthocyanin contents were highest in leaf ranks 1–4, but values were similar in plants grown in ambient
conditions or with CO2enrichment (Fig. 1g).
Transpiration rates were similar at leaf rank 12 under
both CO2conditions but they were decreased in the rank 5
leaves at high CO2 (Fig. 2a). Stomatal conductance rates
were higher at rank 12 than rank 5, the difference being
most marked in plants grown at high CO2 (Fig. 2b).
Sto-matal conductance was significantly higher at both leaf
ranks under ambient CO2conditions compared with high
CO2(Fig. 2b). In line with the lower stomatal conductance
rates at high CO2, leaf temperatures were higher (Table 1).
The leaves at rank 12 had significantly higher (about 30%) rates of photosynthesis than those at leaf rank 5
under both CO2conditions (Fig. 2c). However,
photosyn-thesis rates were high at both leaf ranks and thus leaves at both ranks are denoted as ‘source leaves’. Although
photo-synthesis rates appeared to be lower at high CO2 as
observed previously (Driscoll et al. 2006), the differences
between the two CO2 conditions were not significant
(Fig. 2c). Photosynthesis rates were not significantly
changed by the growth CO2 environment (Fig. 2c). Water
use efficiency values were higher in leaves at rank 12 than
rank 5 under ambient CO2 conditions (Fig. 2d). Growth
with CO2enrichment significantly enhanced the water use
efficiencies at both leaf ranks (Fig. 2d). There were no significant differences in total C or total N contents or
C/N ratios in leaves grown under ambient or high CO2
conditions (Table 1).
The maize leaf transcriptome
The transcript profiles of leaf ranks 12 and 3 from plants
grown under ambient and high CO2conditions were
analy-sed. In each case, three plants were used for each RNA extraction pool (in line with the sample source being des-ignated as 2–3 plants per sample per chip in microarray submission: E-MEXP-1222). The transcriptome profiles
were similar under ambient and high CO2conditions and
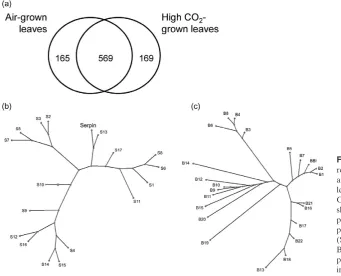
there were no significantly changed transcripts. In contrast, there were significant differences in transcriptomes of leaf ranks 3 and 12. This analysis revealed significant differences
in 734 transcripts under ambient CO2conditions
(Support-ing Information Table S1) and significant differences in 738
transcripts in plants grown under conditions of CO2
enrich-ment (Supporting Information Table S2). Of these tran-scripts that were specifically changed by leaf ontogeny
irrespective of the CO2enrichment, 569 transcripts were the
same under both CO2 treatments (Fig. 3a). Leaf
rank-dependent changes were observed in transcripts encoding proteins involved in nitrogen metabolism such as nitrate reductase, nitrate reductase and glutamine synthetase, which were higher in leaf rank 12 than 3. While mRNAs
encoding sucrose phosphate synthetase (SPS), phosphoenol
pyruvate carboxylase andbamylase (Supporting
databases (Figs 3b, c & 4 Table 4). The putative serine pro-tease inhibitor EF406275 (serpin) was identified through
homology to an Arabidopsis serine-type endopeptidase
inhibitor (NP_177351.1; bit score 86.3; E=6e–16). The BBI
sequence has a high sequence similarity to a patented maize
sequence, which is described as a maize proteinase inhibitor-like polynucleotide (AR494954; patent number US6720480-A/1, 13-APR-2004).
Although no significant effects of atmospheric growth
CO2 on the leaf transcript profile were found in the
Leaf number
2 4 6 8 10 12 14
A
nthocy
anin
(pmol g
-1 chlorophy
ll)
0 50 100 150 200 250 300
Leaf number 2 4 6 8 10 12 14
Water content (g g
-1 )
1 2 3 4 5 6
S
pecific leaf area
(m
2 kg
-1 )
2.0 2.5 3.0 3.5 4.0
Dry
w
eight
(g m
-2 )
20 40 60 80 100
Fresh w
eight
(g m
-2 )
200 250 300 350 400 450
S
pecific leaf w
eight
(g m
-2 )
250 300 350 400 450
0.5m
350
m
L L
−1CO
2700
m
L L
−1CO
2(a)
(b)
(c)
(d)
(e)
(f)
(g)
Figure 1. A comparison of the morphologies of 8-week-old maize plants grown under either ambient CO2conditions (350mL L-1) or
with CO2enrichment (700mL L-1). Whole plant phenotype (a) showing the ranking of all leaves on the stem. Samples were harvested
from plants grown under either ambient CO2conditions (closed circles) or with CO2enrichment (open circles). Fresh weight (b) and dry
transcriptome analysis, the effects of growth CO2 on the
abundance of certain transcripts were also examined using qPCR. For this analysis we compared the transcripts encod-ing the two serine protease inhibitors and four invertase and sucrose synthase sequences associated with carbohy-drate metabolism (cell wall invertase, acid invertase, two sucrose synthase forms, and sucrose phosphate synthase) in
leaves of plants grown either under ambient CO2conditions
or with CO2enrichment. Under ambient CO2conditions the
abundance of the serpin transcripts was dependent on leaf rank, with the highest levels in leaf ranks 1–3 (Fig. 5a). The abundance of the BBI transcripts was also dependent on the position of the leaf on the stem (Fig. 5a, b). While serpin
transcripts were increased as a result of growth with CO2
enrichment in the youngest source leaves (Fig. 5a), BBI
transcripts showed a CO2-dependent change in abundance
only in the oldest source leaves (Fig. 5b). Although growth
with CO2enrichment had no effect on the abundance of cell
wall invertase, sucrose synthase and sucrose phosphate syn-thase transcripts (Fig. 5c–g), the abundance of acid
inver-tase was higher in leaves of plants grown at high CO2
(Fig. 5c). The abundance of SPS transcripts was dependent
on leaf rank with the highest levels measured in the young-est source leaves (Fig. 5g). Less marked effects of leaf rank were found for transcripts encoding cell wall invertase, acid invertase, and the two sucrose synthase forms.
CO2-dependent effects on the leaf proteome
Leaf proteins extracted from leaf ranks 3 and 12 of ambient
and high CO2–grown maize plants were separated using 2D
gel electrophoresis (Supporting Information Table S4). Pro-genesis SameSpot 2D gel analysis software revealed the presence of about 900 spots in the leaf extracts. Relatively few spots were changed in abundance in rank 12 source
leaves as a result of CO2enrichment. Growth with high CO2
exerted the most pronounced effects on the proteome of rank 3 source leaves but the differences between differen-tially expressed proteins were generally less than twofold (Supporting Information Table S4). Sixty differentially-expressed spots were excised from the gels containing pro-teins of leaf rank 3 leaves and subjected to LCMS/MS analysis as outlined in the materials and methods section. In total, 69 proteins were identified from 35 protein spots (Supporting Information Table S4). Of these, 10 were increased in intensity and 25 spots were decreased in
inten-sity in response to high CO2 (Table 2). It is important to
note that only 14 spot analyses resulted in the identification of a single protein, whereas the remaining 21 spots yielded between 2 and 7 different protein identifications per spot, making it difficult to determine precisely which protein was responsible for the increase or decrease in intensity of the respective spot. However, the FtSH protease was identified in three different spots (23, 24 and 34), all of which showed an approximately twofold decrease in response to high
CO2. Many of the other identified proteins are involved in
primary metabolism, particularly photosynthesis and
respiration. The third largest functional group amongst the
Figure 2. Comparison of transpiration
rates (a), stomatal conductance (b) photosynthesis (c) and water use efficiencies (WUE, D) in source leaves at ranks 5 and 12 on plants that had been grown for 8 weeks under either ambient CO2conditions (350+/-20mL L-1) or
with CO2enrichment (700+/-20mL L-1).
Values represent mean⫾SE;n=4. Data were analysed by two-factorial analysis of variance and significant differences between treatments are displayed (* at 10%, ** at 5%, *** at 1%).
T
ranspi
rat
ion
(m
m
o
l m
−
2 s
−
1)
1 2 3 4 5
Phot
osy
n
thesis
(
m
mo
l C
O2
m
−
2 s
−
1)
0 10 20 30
Stom
a
ta
l conductance
(m
m
o
l m
−
2
s
−
1
)
50 100 150 200
WU
E
(
m
mo
l C
O
2 mo
l H
2O
−
1
)
0 50 100 150 200 250 300
(a) (b)
(c) (d)
CO2 level Leaf position
Leaf position CO2 level
350 350
350 700
700 700
5 12
5 12 5 12
* ***
** **
Table 1. A comparison of leaf C and N contents (% of dry
weight), leaf C/N ratios and leaf temperatures (Tleafin °C) in
3-week-old maize plants grown either under ambient CO2
conditions or with CO2enrichment. Values represent mean⫾SE;
n=4. Superscript letters are significantly different (P<0.05)
Ambient CO2 CO2enrichment
C (%) 41.72⫾0.41a 41.64⫾0.05a
N (%) 3.23⫾0.09a 3.06⫾0.30a
C/N 12.94⫾0.23a 13.72⫾1.40a
Tleafat 700mL L-1 27.77⫾0.41b 28.80⫾0.17a
proteins altered in response to high CO2 were enzymes
involved in protein metabolism (Table 2).
Effects of sugars and cellular redox modulators on the abundance of maize leaf transcripts
The data shown in Fig. 5a, b, indicated that the abundance of transcripts encoding the serpin and BBI inhibitors were
changed by the growth CO2 level in a leaf rank specific
manner. To determine whether the expression of serpin and BBI was influenced by sugars or subject to redox regulation, maize leaf pieces were incubated in solutions containing either sugars (sucrose, glucose or fructose) or pro-oxidants [hydrogen peroxide or methyl viologen (MV)]. Although the sugars had very little effect on the abundance of the transcripts associated with sugar
Figure 3. A comparison of transcripts
responsive to leaf ontogeny under either ambient CO2conditions (Air-grown
leaves) or with CO2enrichment (High
CO2-grown leaves; a). Phylogenetic trees
showing the relationships between putative serpin and known serine proteinase inhibitor protein sequences (S1–S17; b) and putative BBI and known Bowman–Birk serine protease inhibitor protein sequences (B1–B22, c) listed in Table 4.
(a)
(b)
Consensus symbols:
* all residues in the column are identical in all sequences in the alignment : conserved substitutions are observed
. semi-conserved substitution are observed
Figure 4. Multiple alignment of the identified serine proteinase inhibitor protein sequences with those of known serine proteinase
metabolism, incubation with sucrose, fructose or glucose increased the abundance of serpin transcripts and decreased the levels of BBI transcripts (Table 3).
Treat-ment with H2O2and methyl viologen increased the levels
of both serpin and BBI transcripts but caused a small decrease the abundance of transcripts associated with sugar metabolism (Table 3).
The effect of growth CO2levels on the leaf metabolome
Growth with high CO2had very little effect on maize leaf
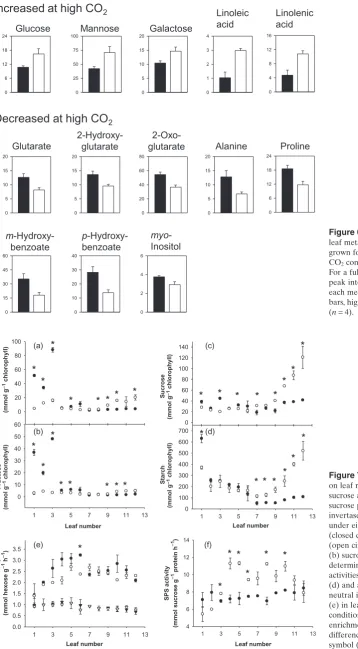
metabolite profiles (Supporting Information Table S5). Sig-nificant differences were found in only 13 metabolites in leaf rank 5 of 9-week-old plants. No significant changes in photorespiratory metabolites such as glycolate, glycerate, glycine or serine were found. The levels of leaf glucose, mannose and galactose were enhanced as a result of growth
with CO2 enrichment as were the levels of linoleic and
linolenic acids (Fig. 6). Significant decreases were observed
only in glutarate, 2-hydroxyglutarate, 2-oxoglutarate,
alanine, proline, myo-inositol and two isomers of hydroxy-benzoate (Fig. 6).
The effect of growth CO2levels on the
leaf-rank-specific accumulation of carbohydrate and on associated enzymes
High CO2 had a marked effect on the leaf rank-specific
profile of carbohydrates but there was little effect on the activities of key enzymes involved in carbohydrate metabo-lism (Fig. 7). Glucose and fructose were much higher in the leaf ranks 1–5 compared with all other leaves on the stem, which had very low hexose contents when plants were
grown under ambient CO2conditions (Fig. 7a, b). Growth
with CO2enrichment completely suppressed this leaf
rank-dependent change in leaf hexoses such that all the leaves had similar low amounts of glucose and fructose in this condition (Fig. 7a). Leaf sucrose (Fig. 7c) and starch (Fig. 7d) were not greatly changed as a result of leaf rank in
plants grown under ambient CO2 conditions. However,
Figure 5. The effects of CO2enrichment
on leaf rank-specific transcript levels measured by qPCR. Plants were grown for 8 weeks under either ambient CO2
conditions (closed circles) or with CO2
enrichment (open circles). The abundance of transcripts encoding seprin (a) BBI (b) cell wall invertase (c), invertase (d), sucrose synthase 3 (e), sucrose synthase (f), and sucrose phosphate synthase (g) was determined in all the leaves. Values⫾max/min are normalized to leaf 1 grown under ambient CO2conditions
(RQ=1) and expressed relative to endogenous controls.
1 3 5 7 9 11 13
RQ
0 2 4 6 8
10 1 3 5 7 9 11 13
RQ
0.0 0.5 1.0 1.5 2.0 2.5 3.0 3.5
RQ
0 1 2 3 4
RQ
0 1 2 3 4 5
RQ
0.0 0.5 1.0 1.5 2.0
RQ
0 1 2 3
RQ
0.00 0.25 0.50 0.75 1.00 1.25 1.50 (a)
(c)
(b)
(d)
(e) (f)
(g)
Serpin
Incw4
SuSy3
SPS
BBI
Inv
SuSy
Leaf number
Table 3. Effects of sugars and pro-oxidants on the abundance of serpin and BBI transcripts and on selected transcripts encoding enzymes involved in sugar metabolism
Treatment
Sucrose Fructose Glucose H2O2 MV
Transcript Serpin 1.83 (1.64–2.04) 1.59 (1.19–2.12) 1.44 (1.34–1.54) 2.91 (2.51–3.38) 7.56 (6.05–9.47) BBI 0.54 (0.48–0.61) 0.52 (0.32–0.85) 0.44 (0.38–0.51) 1.97 (1.71–2.27) 1.32 (1.15–1.52) Incw4 0.96 (0.86–1.07) 0.95 (0.79–1.13) 0.72 (0.67–0.78) 0.78 (0.66–0.92) 0.91 (0.76–1.10) Inv 0.82 (0.54–1.24) 1.31 (0.96–1.80) 1.04 (0.89–1.21) 0.32 (0.24–0.42) 0.66 (0.56–0.78) SuSy3 1.12 (0.94–1.33) 1.29 (1.07–1.55) 1.17 (1.03–1.34) 0.45 (0.32–0.64) 1.70 (1.52–1.89) SuSy 1.22 (0.99–1.49) 1.07 (0.72–1.60) 0.72 (0.67–0.77) 1.81 (1.44–2.28) 0.78 (0.62–0.98) SS 0.91 (0.74–1.11) 1.18 (1.00–1.40) 0.76 (0.72–0.81) 0.30 (0.25–0.35) 0.77 (0.67–0.87)
Data represent relative minimum–maximum values calculated from at least three technical replicates normalized to values obtained from leaves incubated with buffer alone and relative to cyclophilin and ubiquitin as endogenous controls.
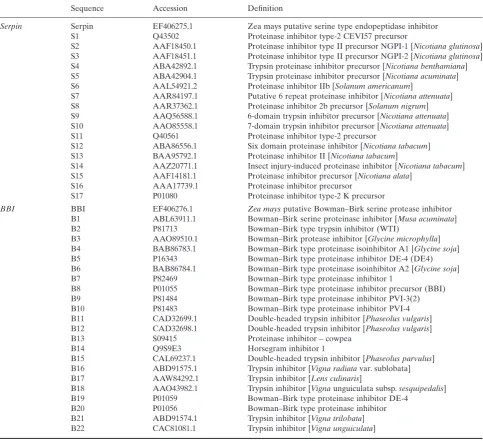
Table 4. Identified Bowman–Birk serine protease
Sequence Accession Definition
Serpin Serpin EF406275.1 Zea mays putative serine type endopeptidase inhibitor S1 Q43502 Proteinase inhibitor type-2 CEVI57 precursor
S2 AAF18450.1 Proteinase inhibitor type II precursor NGPI-1 [Nicotiana glutinosa] S3 AAF18451.1 Proteinase inhibitor type II precursor NGPI-2 [Nicotiana glutinosa] S4 ABA42892.1 Trypsin proteinase inhibitor precursor [Nicotiana benthamiana] S5 ABA42904.1 Trypsin proteinase inhibitor precursor [Nicotiana acuminata] S6 AAL54921.2 Proteinase inhibitor IIb [Solanum americanum]
S7 AAR84197.1 Putative 6 repeat proteinase inhibitor [Nicotiana attenuata] S8 AAR37362.1 Proteinase inhibitor 2b precursor [Solanum nigrum] S9 AAQ56588.1 6-domain trypsin inhibitor precursor [Nicotiana attenuata] S10 AAO85558.1 7-domain trypsin inhibitor precursor [Nicotiana attenuata] S11 Q40561 Proteinase inhibitor type-2 precursor
S12 ABA86556.1 Six domain proteinase inhibitor [Nicotiana tabacum] S13 BAA95792.1 Proteinase inhibitor II [Nicotiana tabacum]
S14 AAZ20771.1 Insect injury-induced proteinase inhibitor [Nicotiana tabacum] S15 AAF14181.1 Proteinase inhibitor precursor [Nicotiana alata]
S16 AAA17739.1 Proteinase inhibitor precursor S17 P01080 Proteinase inhibitor type-2 K precursor
BBI BBI EF406276.1 Zea maysputative Bowman–Birk serine protease inhibitor B1 ABL63911.1 Bowman–Birk serine proteinase inhibitor [Musa acuminata]
B2 P81713 Bowman–Birk type trypsin inhibitor (WTI)
B3 AAO89510.1 Bowman–Birk protease inhibitor [Glycine microphylla] B4 BAB86783.1 Bowman–Birk type proteinase isoinhibitor A1 [Glycine soja] B5 P16343 Bowman–Birk type proteinase inhibitor DE-4 (DE4) B6 BAB86784.1 Bowman–Birk type proteinase isoinhibitor A2 [Glycine soja]
B7 P82469 Bowman–Birk type proteinase inhibitor 1
B8 P01055 Bowman–Birk type proteinase inhibitor precursor (BBI) B9 P81484 Bowman–Birk type proteinase inhibitor PVI-3(2) B10 P81483 Bowman–Birk type proteinase inhibitor PVI-4 B11 CAD32699.1 Double-headed trypsin inhibitor [Phaseolus vulgaris] B12 CAD32698.1 Double-headed trypsin inhibitor [Phaseolus vulgaris]
B13 S09415 Proteinase inhibitor – cowpea
B14 Q9S9E3 Horsegram inhibitor 1
B15 CAL69237.1 Double-headed trypsin inhibitor [Phaseolus parvulus] B16 ABD91575.1 Trypsin inhibitor [Vigna radiatavar. sublobata] B17 AAW84292.1 Trypsin inhibitor [Lens culinaris]
B18 AAO43982.1 Trypsin inhibitor [Vignaunguiculata subsp.sesquipedalis] B19 P01059 Bowman–Birk type proteinase inhibitor DE-4
B20 P01056 Bowman–Birk type proteinase inhibitor
Figure 6. Effects of high CO2on maize
leaf metabolite profiles. Plants were grown for 6 weeks under either ambient CO2conditions or with CO2enrichment.
For a full data list, see Table S5. Note that peak intensities are in arbitrary units for each metabolite. Black bars, air. White bars, high CO2. Data are means⫾SE
(n=4).
0 5 10 15 20 0 5 10 15 20 0 20 40 60 80 0 5 10 15 20 0 6 12 18 24 0 5 10 15 20 0 1 2 3 4 0 4 8 12 16 0 25 50 75 100 0 15 30 45 60 0 2 4 6 0 10 20 30 40 0 6 12 18 24 Glutarate 2-Hydroxy-glutarate 2-Oxo-glutarate
Decreased at high CO
2Alanine Proline
myo -Inositol Glucose Mannose Galactose
Linoleic acid
Linolenic acid
Increased at high CO
2m -Hydroxy-benzoate
p -Hydroxy-benzoate
Figure 7. The effects of CO2enrichment
on leaf rank-specific levels of hexoses, sucrose and starch and activities of sucrose phosphate synthase (SPS) and invertase. Plants were grown for 8 weeks under either ambient CO2conditions
(closed circles) or with CO2enrichment
(open circles). Glucose (a) fructose (b) sucrose (c) and starch (d) were determined in all the leaves as were the activities of sucrose phosphate synthase (d) and acid invertase (e). Activities of neutral invertase were also determined (e) in leaves under ambient CO2
conditions (closed symbols) or with CO2
enrichment (open symbols). Significant differences atP<0.05 indicated by the symbol (*).
Leaf number
1 3 5 7 9 11 13
0 10 20 30 40 50 60 Leaf number
1 3 5 7 9 11 13
0 100 200 300 400 500 600 700 0 20 40 60 80 100 120 140 Glu cose (mmol g
-1 chlo
ro ph yll) 0 20 40 60 80 100 (a) (b) (e) (f) (c) (d) Fructose (m mol g
-1 chlorophyll)
Sucrose
(m
mol g
-1 chlorophyll)
Starch
(m
mol g
-1 chlorophyll)
Leaf number
1 3 5 7 9 11 13
Invertase activity
(mmol hexose g
-1 h
-1) 0.0 0.5 1.0 1.5 2.0 2.5 3.0 3.5 Leaf number
1 3 5 7 9 11 13
SPS activity
(mmol sucrose g
-1 protein h
there was a sharp increase in both of these carbohydrates in
the leaf ranks 7–13 of plants grown with CO2enrichment.
Soluble acid invertase activities were much higher than those of neutral invertase in all but leaf ranks 10–13 of plants on the stem (Fig. 7e). Although neutral and acid
invertase activities were unaffected by growth CO2 level
(Fig. 7e), SPS activities were markedly increased as a result
of growth with CO2enrichment, in all but leaf ranks 1–3 and
10–13 (Fig. 7f).
The effect of growth CO2level on the leaf-rank-specific accumulation of protein carbonyl groups
The extent of protein carbonyl group formation is
con-trolled by leaf development in Arabidopsis (Johansson,
Olsson & Nystrom 2004) but it is often used as a measure of cellular oxidation, as it increases in response to stress (Kingston-Smith & Foyer 2000). Leaf rank specific changes in the content of protein carbonyl group formation were
apparent in maize (Fig. 8) likeArabidopsisleaves
(Johans-son et al. 2004). However, in the case of maize, protein
carbonyls were most abundant in leaves 9–12 and they decreased progressively to leaf rank 1, which showed only
one detectable band of carbonyl groups in plants grown
under ambient CO2 conditions (Fig. 8a). The intensity of
this single carbonyl-stained protein in leaf ranks 1 and 2 was
increased in plants grown at high CO2 (Fig. 8b). While
growth with CO2enrichment had a dramatic effect on the
profile of leaf carbonyl abundance and composition, the effect varied with leaf rank. The number of protein bands showing staining for protein carbonyl group was decreased in leaves 9–12 (Fig. 8b). In particular, there was a marked decrease in the number of high molecular weight proteins showing carbonyl group formation in leaves 9–12 at high
CO2(Fig. 8). With exception of leaf ranks 1–4, the level of
protein carbonyl formation was also modified in other leaf ranks but this effect was highly dependent on the molecular weight band analyzed (Fig. 8).
DISCUSSION
While future increases in atmospheric CO2availability will
benefit plants with the C3 photosynthetic pathway, the
nature of the responses of C4 plants to elevated CO2
remains controversial (Leakey 2009). Evidence from the Free-Air Concentration Enrichment Experiments (FACE)
has consistently shown that growth with elevated CO2does
not enhance maize leaf photosynthesis or plant growth
(Leakey et al. 2006; 2009a,b). The results presented here
confirm the observations from the FACE experiments
and also data from other similar studies (Kimet al. 2006).
Similarly, the leaf transcriptome analysis failed to show
any significant differences between the air and high CO2
samples in line with earlier observations (Kimet al. 2006;
Leakey et al. 2009a, b). However, further analysis using
qPCR revealed that transcripts encoding a BBI and a serpin
were differentially expressed in relation to the growth CO2
level in a leaf rank-specific manner. Similarly, the leaf pro-teome analysis suggested that several chloroplast proteins including components of the photosystem II (PSII) oxygen evolving complex and the ATP synthase were decreased at
high CO2but only in the older source leaves. Of the proteins
that were altered in abundance at high CO2,there was a
marked effect on FtsH proteases, which are important in chloroplast biogenesis and thylakoid maintenance. The high
CO2-dependent decreases in FtsH proteases may reflect the
diminished requirement for photosystem repair in the older
source leaves at high CO2compared with ambient CO2.
These modest adjustments in chloroplast components were not however sufficient to cause a significant decrease in the overall rate of leaf photosynthesis. Analysis of the leaf metabolome showed that while metabolites associated with photorespiration were similar in leaves under ambient and
high CO2conditions, the levels of some carbohydrates such
as glucose, mannose and galactose were enhanced in the
older source leaves as a result of growth with CO2
enrich-ment. Similarly, spectrophotometric measurements of leaf starch, sucrose, glucose and fructose showed that these
metabolites were modified as a result of growth with CO2
enrichment. However, such changes in metabolite levels were dependent on the leaf position on the stem. Taken
Figure 8. The effects of CO2enrichment on the leaf
rank-specific abundance of protein carbonyl groups. Plants were grown for 8 weeks under either ambient CO2conditions (a) or
with CO2enrichment (b). Protein carbonyl groups are compared
together, the data suggest that maize leaves show
acclima-tion to CO2enrichment. However, this trait occurs in a strict
leaf-specific manner. Leaf ontogeny has a marked influence
on leaf responses to atmospheric CO2 availability. Maize
leaves undergo a shift in photosynthesis from C3 to C4
metabolism during development (Crespoet al. 1979) and
large number of transcripts were significantly changed in abundance between leaf ranks 3 and 12.
A key question that remains to be addressed concerns whether leaves are able to sense and signal changes in
atmospheric CO2 by pathways that are independent of
photosynthesis. One mechanism that has been proposed
implicates carbonic anhydrases in plant CO2-signalling
pathways (Huet al. 2010). While the data presented here
do not provide any new insights into the roles of carbonic
anhydrases in the CO2-signalling pathways in maize, the
data clearly demonstrate that the acclimation responses to
high CO2 observed in maize are dependent on leaf rank.
Thus, we explored how different parameters associated with leaf physiology were affected by growth at ambient
and high CO2. The most pronounced effects were
observed in the leaf transpiration rates, which were
decreased in leaves grown at high CO2(Fig. 2). As a
con-sequence of decreased transpiration rates, the leaf tem-perature were slightly increased in plants grown at high
CO2 (Table 1). However, the overall changes in maize
leaf temperatures are very small, as observed previously (Kimet al. 2006). Thus, it is unlikely that CO2-dependent
changes in leaf temperature are responsible for the observed changes in the leaf proteins, transcripts and metabolites. It has previously been suggested that high
CO2-dependent changes in leaf metabolism are related to
altered leaf N status (Kim et al. (2006). However, in the
present experiments neither maize leaf N status nor leaf C/N ratios were significantly changed as a result of growth
at high CO2.
Drought stress can be ameliorated at elevated CO2even
in C4plants as a result of lower stomatal conductance and
thus it is possible that maize leaves may be much less
sus-ceptible to water deficits when grown with CO2enrichment.
Thus, the observed differences in transcripts, proteins and metabolites between the less photosynthetically-active leaves (ranks 3–5) and the younger (rank 12) source leaves may be related to slight changes in leaf water status. The stomatal conductance rates were significantly higher in
leaves under ambient CO2conditions (Fig. 2b). While
tran-spiration rates (Fig. 2a) and water use efficiency values
(Fig. 2d) were similar in leaf rank 12 under both CO2
conditions, the differences were significant in the older less
photosynthetically active leaves (rank 5). The small CO2
-dependent differences in the water status of the rank 12 leaves could therefore be responsible for the observed variations in transcripts, proteins and metabolites.
The decreased abundance of myo-inositol and two hydroxybenzoic acids, which are related to SA metabolism,
were repressed at high CO2 and there was a decreased
abundance of protein carbonyl groups. These findings are consistent with a lower oxidative load in leaves grown
under high CO2conditions. This may be particularly
impor-tant for bundle sheath proteins, which are more sensitive to carbonylation in response to cellular oxidation than those of the mesophyll (Kingston-Smith & Foyer 2000).The lower
levels of protein oxidation under high CO2conditions are
indicative of an altered cellular redox status, particularly in the younger leaf ranks. Alterations in cellular redox status may have important implications for enzymes and
meta-bolic processes such as starch metabolism (Hendrikset al.
2003; Kolbeet al. 2005; Sparlaet al. 2006) that are subject to
redox regulation (Buchanan & Balmer 2005; Schürmann & Buchanan 2008).
Growth with high CO2exerted a marked influence on leaf
carbohydrate status in a strict leaf-rank specific manner and this also might be related to changes in whole plant water
status. A CO2-dependent accumulation of sucrose was
observed only in the youngest leaves (ranks 9–12) but high
CO2 prevented the accumulation of hexoses in the older
(ranks 1–3) leaves. These changes in the leaf carbohydrate profiles occurred in the absence of any detectable changes in the activities of key enzymes involved in carbohydrate metabolism but it might be related to decreased assimilate
export from the younger leaves at high CO2. Interestingly,
sugars are involved systemic signalling pathways that convey
information concerning CO2availability from leaf to leaf
(Coupe et al. 2006; Miyazawaet al. 2006; Baena-González
et al. 2007). The failure of the older leaves to accumulate
hexoses when grown under high CO2might also be related to
decreased sucrose export from the younger leaves, particu-larly if this was associated with futile cycling between sucrose and hexoses (Nguyen-Quoc & Foyer 2001).
The functions of BBI and the serpin that were
differen-tially expressed in relation to the growth CO2 level in a
leaf rank-specific manner are not known. The serpin
(EF406275) is homologous to an Arabidopsis serine-type
endopeptidase inhibitor (AT1G72060) and has signal peptide and pin2 domains. The BBI protein has a theoreti-cal molecular weight of 10.4 kDa and pI of 6.01 with signal peptide and BB leg domains. The signal peptides suggest that both proteins are targeted to classical secretory path-ways and therefore may be involved in autophagocytotic pathways of protein degradation associated with the vesicu-lar transport system or with processes located in the extracellular/apoplastic space. The vesicular trafficking system has functions linked to plant stress responses
(Leshemet al. 2006) and to the degradation of Rubisco and
other chloroplast proteins (Chiba et al. 2003; Ishida et al.
2007; Prinset al. 2008).
While plant serpins have been intensively studied par-ticularly in cereal seeds, relatively few protein targets have been identified to date and precise roles have yet to be assigned. One target has been shown to be the cysteine-dependent protease, metacaspase 9, which is strongly
inhibited by Arabidopsis Serpin1. However, the in vitro
inhibition of trypsin and metacaspase 4 imply that Serpin1
has a range of targets (Vercammenet al. 2006).
autophagocytotic pathways of protein degradation. Their expression patterns of these protease inhibitors were
changed by growth at high CO2in the older source leaves
and further examination revealed that the abundance of the transcripts was modulated in response to sugars and redox effectors. The serpin transcripts were increased in the pres-ence of sugars while the BBI transcripts were repressed under these conditions. The abundance of serpin transcripts
was lower in the older source leaves grown at high CO2,
consistent with the high CO2-dependent decease in leaf
hexoses. These results may implicate sugar signalling in the
regulation of serpin expression at high CO2. However, CO2
-dependent alterations in sugar signalling do not appear to be involved in the regulation of the expression of the BBI inhibitor.
ACKNOWLEDGMENTS
This work was funded by a Royal Society (UK)-National Research Foundation (South Africa) joint project (GUN 2068793). A.P. thanks the Association of Commonwealth Universities for a split-site PhD fellowship between the labs of C.F. (UK) and K.K. (South Africa). M.S.S.L. thanks Fundacao para a Ciencia e a Tecnologia, Portugal for a fellowship (SFRH/BPD/34310/2006) to the Foyer lab. P.K. thanks the The Scottish Crop Research Institute, UK and the University of Leeds, UK for split site PhD fellowship. NEPAF is funded by ONE NorthEast (UK) and the Euro-pean Regional Development Fund. Rothamsted Research receives grant-aided support from the UK Biotechnology and Biological Sciences Research Council.
REFERENCES
Acharya B.R. & Assmann S.M. (2009) Hormone interactions in stomatal function.Plant Molecular Biology69,451–462. Altschul S.F., Gish W., Miller W., Myers E.W. & Lipman D.J. (1990)
Basic local alignment search tool.Journal of Molecular Biology
215,403–410.
Baena-González E., Rolland F., Thevelein J.M. & Sheen J. (2007) A central integrator of transcription networks in plant stress and energy signaling.Nature448,938–943.
Baroli I., Price G.D., Badger M.R. & Von Caemmerer S. (2008) The contribution of photosynthesis to the red light response of stomatal conductance.Plant Physiology146,737–747.
Barta E., Pintar A. & Pongor S. (2002) Repeats with variations: accelerated evolution of the Pin2 family of proteinase inhibitors. Trends in Genetics18,600–603.
Bradford M.M. (1976) A rapid and sensitive method for the quantitation of microgram quantities of protein utilizing the principle of protein-dye binding. Analytical Biochemistry72,
248–254.
Buchanan B.B. & Balmer Y. (2005) Redox regulation: a broadening horizon.Annual Review of Plant Biology56,187–220. Chiba A., Ishida H., Nishizawa N.K., Makino A. & Mae T. (2003)
Exclusion of ribulose-15-bisphosphate carboxylase/oxygenase from chloroplasts by specific bodies in naturally senescing leaves of wheat.Plant & Cell Physiology44,914–921.
Coupe S.A., Palmer B.G., Lake J.A., Overy S.A., Oxborough K., Woodward F.I., Gray J.E. & Quick W.P. (2006) Systemic
signalling of environmental cues inArabidopsisleaves.Journal of Experimental Botany57,329–341.
Cousins A.B., Adam N.R., Wall G.W.,et al. (2001)Reduced photo-respiration and increased energy-use efficiency in young CO2
-enriched sorghum leaves.New Phytologist150,275–284. Craig R. & Beavis R.C. (2004) TANDEM: matching proteins with
tandem mass spectra.Bioinformatics20,1466–1467.
Crespo H.M., Frean M., Cresswell C.R. & Tew J. (1979) The occur-rence of both C3 and C4 photosynthetic characteristics in a singleZea maysplant.Planta147,257–263.
Croxdale J. (1998) Stomatal patterning in monocotyledons: trades-cantiaas a model system.Journal of Experimental Botany49,
279–292.
Driscoll S.P., Prins A., Olmos E., Kunert K.J. & Foyer C.H. (2006) Specification of adaxial and abaxial stomata epidermal structure and photosynthesis to CO2enrichment in maize leaves.Journal
of Experimental Botany57,381–390.
Emanuelsson O., Nielsen H., Brunak R. & Von Heijne G. (2000) Predicting subcellular localization of proteins based on their N-terminal amino acid sequence.Journal of Molecular Biology
300,1005–1016.
Ferris R., Long L., Bunn S.M., Robinson K.M., Bradshaw H.D., Rae A.M. & Taylor G. (2002) Leaf stomatal and epidermal cell development: identification of putative quantitative trait loci in relation to elevated carbon dioxide concentration in poplar. Tree Physiology22,633–640.
Foyer C.H., Bloom A., Queval G. & Noctor G. (2009) Photorespi-ratory metabolism: genes, mutants, energetics, and redox signal-ing.Annual Review of Plant Biology60,455–484.
Fryer M.J., Ball L., Oxborough K., Karpinski S., Mullineaux P.M. & Baker N.R. (2003) Control ofAscorbate Peroxidase 2expression by hydrogen peroxide and leaf water status during excess light stress reveals a functional organisation ofArabidopsisleaves. The Plant Journal33,691–705.
Ghannoum O., Von Caemmerer S., Barlow E.W.R. & Conroy J.P. (1997) The effect of CO2 enrichment and irradiance on the
growth, morphology and gas-exchange of a C3(Panicum laxum)
and a C4(Panicum antidotale) grass.Australian Journal of Plant
Physiology24,227–237.
Ghannoum O., Von Caemmerer S. & Conroy J.P. (2001) Plant water use efficiency of 17 Australian NAD-ME and NADP-ME C4grasses at ambient and elevated CO2partial pressure.
Austra-lian Journal of Plant Physiology28,1207–1217.
Gish W. & States D.J. (1993) Identification of protein coding regions by database similarity search.Nature Genetics3,266– 272.
Gray J.E., Holroyd G.H., Van Der Lee F.M., Bahrami A.R., Sijmons P.C., Woodward F.I., Schuch W. & Hetherington A.M. (2000) The HIC signalling pathway links CO2perception to stomatal
development.Nature408,713–716.
Hendriks J.H.M., Kolbe A., Gibon Y., Stitt M. & Geigenberger P. (2003) ADP-glucose pyrophosphorylase is activated by post-translational redox-modification in response to light and to sugars in leaves ofArabidopsisand other plant species.Plant Physiology133,838–849.
Hu H., Boisson-Dernier A., Israelsson-Nordström M., Böhmer M., Xue S., Ries A., Godoski J., Kuhn J.M. & Schroeder J.I. (2010) Carbonic anhydrases are upstream regulators of CO2-controlled stomatal movements in guard cells.Nature Cell Biol12,87–93. Ishida H., Yoshimoto K., Reisen D., Makino A., Ohsumi Y., Hanson
M. & Mae T. (2007) Visualization of Rubisco-containing bodies derived from chloroplasts in living cells ofArabidopsis. Photo-synthesis Research91,275–276.