R E S E A R C H A R T I C L E
Open Access
Validating estimates of prevalence of
non-communicable diseases based on household
surveys: the symptomatic diagnosis study
Spencer L James
1,2, Minerva Romero
3, Dolores Ramírez-Villalobos
4, Sara Gómez
5, Kelsey Pierce
1,
Abraham Flaxman
1, Peter Serina
1, Andrea Stewart
1, Christopher JL Murray
1, Emmanuela Gakidou
1,
Rafael Lozano
1,4and Bernardo Hernandez
1*Abstract
Background:Easy-to-collect epidemiological information is critical for the more accurate estimation of the prevalence and burden of different non-communicable diseases around the world. Current measurement is
restricted by limitations in existing measurement systems in the developing world and the lack of biometry tests for non-communicable diseases. Diagnosis based on self-reported signs and symptoms (“Symptomatic Diagnosis,”or SD) analyzed with computer-based algorithms may be a promising method for collecting timely and reliable information on non-communicable disease prevalence. The objective of this study was to develop and assess the performance of a symptom-based questionnaire to estimate prevalence of non-communicable diseases in low-resource areas.
Methods:As part of the Population Health Metrics Research Consortium study, we collected 1,379 questionnaires in Mexico from individuals who suffered from a non-communicable disease that had been diagnosed with gold standard diagnostic criteria or individuals who did not suffer from any of the 10 target conditions. To make the diagnosis of non-communicable diseases, we selected the Tariff method, a technique developed for verbal autopsy cause of death calculation. We assessed the performance of this instrument and analytical techniques at the individual and population levels.
Results:The questionnaire revealed that the information on health care experience retrieved achieved 66.1% (95% uncertainty interval [UI], 65.6–66.5%) chance corrected concordance with true diagnosis of non-communicable diseases using health care experience and 0.826 (95% UI, 0.818–0.834) accuracy in its ability to calculate fractions of different causes. SD is also capable of outperforming the current estimation techniques for conditions estimated by questionnaire-based methods.
Conclusions:SD is a viable method for producing estimates of the prevalence of non-communicable diseases in areas with low health information infrastructure. This technology can provide higher-resolution prevalence data, more flexible data collection, and potentially individual diagnoses for certain conditions.
Keywords:Automated methods, Mexico, Non-communicable diseases, Non-communicable diseases prevalence, Questionnaire
* Correspondence:[email protected] 1
Institute for Health Metrics and Evaluation, University of Washington, 2301 Fifth Ave., Suite 600, Seattle, WA 98121, USA
Full list of author information is available at the end of the article
Background
Non-communicable diseases (NCDs) form a substantial part of the global burden of disease in both developing and developed countries, with certain NCDs posing an equal or greater threat in low-income compared to high-income countries [1]. Mexico, and much of Latin America in general, have seen a relative increase in their NCD bur-den in the past 20 years, with conditions such as heart disease, arthritis, and vision loss steadily increasing in terms of disability-adjusted life years [1].
Despite the substantial burden of NCDs around the world, it continues to be difficult to collect accurate infor-mation on their prevalence, particularly in areas that lack consistent or accessible health care. In part, this is due to inherent limitations in diagnosing these conditions.
While information on some infectious diseases, such as HIV, malaria, and tuberculosis, can be collected through biological assays or cultures, such an equivalent does not exist for certain NCDs. The diagnostic criteria for a con-dition such as chronic obstructive pulmonary disease (COPD), for example, require medical resources such as spirometry or medical knowledge to interpret FEV1/ FVC ratios and differentiate COPD from asthma based on subtle differences in clinical signs and symptoms. Moreover, medical diagnostic tests for NCDs, when ex-istent, are frequently more expensive than for infectious diseases, so surveys tend not to include them; for example, a rapid diagnostic test for malaria costs less than $1 USD in most countries [2], whereas the costs to obtain and measure liver function tests or conduct a 12-lead electro-cardiogram are much higher.
Cheaper tests, such as blood pressure and height and weight, are included in many more surveys than the more expensive ones like lipids or blood sugar. Despite these challenges of measuring NCDs, epidemiological studies endeavor to measure the prevalence of condi-tions, such as asthma [3], depression [4,5], rheumatoid arthritis [6], and COPD [7], in many areas of the devel-oping world. However, there are still significant data gaps and the methods used in these studies have not al-ways been validated against a gold standard clinical and pathological diagnosis. Thus, given that NCDs contri-bute significantly to the global burden of disease, and given that the diagnosis of NCDs requires clinical ex-pertise and medical resources, the analytic question in this study is whether self-reported signs and symptoms in a questionnaire survey can be accurately assessed by data-driven computational models in order to better mea-sure the burden of these diseases.
Using computers to aid in medical diagnosis has been discussed and explored for decades, ranging from early articles that examined medical“indices”[8], the possibil-ity of diagnostic“machines”[9,10], and the statistics that would feed into diagnostic models [11]. More recently,
computational techniques have been implemented for clinical tasks including data-based tasks such as identi-fying arrhythmias in electrocardiogram tracings and inter-pretation of computed tomography scans, symptom-based tasks such as predicting maternal morbidity [12], diagnos-ing asthma [13], and assessdiagnos-ing common complaints in an emergency department [14], and for patient-focused tasks, e.g., symptom-based questionnaires such as WebMD and SymCat.
For epidemiological purposes, certain studies meas-ure disease burden based on questionnaire responses, for example, the World Health Survey [15]. Diagnostic classification-given questionnaire-based signs and symp-toms have been tested in verbal autopsy (VA) research. In VA studies, interviewers ask family members questions about the signs and symptoms leading up to a death that occurred in the household, and physicians or computer models can be used to classify the estimated cause of death. The advent of advanced computer techniques for solving this problem are described elsewhere [16-22], in-cluding a comparison of the performance of different methods and physician-certified VA [23]. This research has provided compelling evidence that computer algo-rithms can match or outperform physician-certified VA. Although this finding refers to deaths occurred in hospital settings, and further research to test external validity may be required, it bodes well for the idea that computers can also be used for diagnosing NCDs in the living.
This study has two main objectives; first, to develop a questionnaire based on self-reported signs and symptoms and apply an automated technique to estimate the pre-valence of NCDs in low-resource settings and, second, to assess the performance of both the questionnaire and the analytical technique at the individual and popu-lation level. We refer to this method as “Symptomatic Diagnosis”(SD).
Methods
Overview of study design
The SD study consisted of two components: data collec-tion and model validacollec-tion. The data colleccollec-tion porcollec-tion consisted of identifying cases of different NCDs in a hos-pital and then conducting a questionnaire with the pa-tient at a later date. The data were collected in Mexico as part of the Population Health Metrics Research Con-sortium (PHMRC) Study [22]. The PHMRC Study is an offshoot of the Gates Grand Challenge 13 PHMRC Pro-ject, an international collaborative focused on developing better ways to measure health. The model validation com-ponent used this validation data to test different approa-ches to the analytical question of interest.
H25-H26, H28, Q12.0), asthma (ICD-10 J45), COPD 10 J40-J44, J47), symptomatic cirrhosis (ICD-10 K70.3, K71.7, K74), vision loss (ICD-(ICD-10 H54), hear-ing loss (ICD-10 H90-H91), depression (ICD-10 F32, F33), and osteoarthritis (ICD-10 M15-M19, M47). These causes were chosen since they contribute considerably to the burden of disease in Mexico, and because cur-rent methods for collecting prevalence data on these conditions are expensive and time-consuming. This questionnaire also collected socio-demographic infor-mation. The questionnaire was adapted from the World Health Survey [15] and the PHMRC Household Survey [24]. Information on the signs and symptoms of the re-spondent is collected, but the questionnaire also asks questions that relate to the respondent’s experience, if any, with health care providers (health care experience; HCE). These questions ask about whether the respond-ent has ever been diagnosed with differrespond-ent conditions, and whether certain medical procedures or protocols have occurred. The list of items relevant to ascertain the presence of a disease in the questionnaire and HCE indicators is provided in Additional file 1.
Procedure
Data collection involved three stages: identifying cases for the 10 conditions of interest, identifying controls who did not suffer from any of the NCDs, and then implementing the SD questionnaire at the household of each case and each control.
Cases
A team of trained coders located approximately 1,200 cases (120 of each of the morbid conditions under study) in 11 public hospitals in the Mexico City area and 120 cases of depression from a psychiatric hospital.
For each condition, a case was defined to be a patient that a physician had diagnosed with the condition and who met a specific set of gold standard diagnosis criteria that was decided on by the PHMRC team. A gold stand-ard diagnosis refers to diagnosis of a specific disease with the highest level of accuracy possible. This involves checking that the diagnosis is based on positive results from a laboratory test or appropriate cabinet and/or checking that the recording and documentation of the appropriate symptoms of the disease were observed dur-ing the development of clinical records. To be accept-able, the symptoms of the disease must be observed or documented in a medical record by a physician. The gold standard criteria for each condition are provided in Additional file 2.
We only included cases living in Mexico City who had an address that was identifiable through the hospital re-cords. Once the cases were identified, an interviewer
visited each household to administer a SD question-naire to the cases.
Controls
We located a population of controls from the records of the Automated Detection and Diagnosis Clinic (CLIDDA) in Mexico City. CLIDDA performs a battery of diagnostic tests on people who are affiliated with the Instituto de Se-guridad y Servicios Sociales para los Trabajadores del Estado. We defined a control to be someone who attended the CLIDDA in the last 6 months prior to the data collec-tion, was diagnosed as not having any history of the mor-bid conditions being studied, was within a similar sex distribution and age range as the cases, was living in the urban area of Mexico City, and whose address was loca-table from the CLIDDA records. Individuals with an ob-vious other disease were not included. We identified a sample of 240 controls. Once the controls were identified by trained coders from the CLIDDA records, appoint-ments were made, and an interviewer visited each house-hold to administer an SD questionnaire.
Signed informed consent was obtained prior to each interview. The project was approved by the institutional review board of the University of Washington and by the research, ethics, and biosafety committees of the National Institute of Public Health, Mexico, and partici-pant institutions.
Processing
The SD dataset was processed into a format usable by statistical models using the same protocol as described in the PHMRC VA study [22]. Specifically, the duration or continuous survey items are converted to a dichotomous
“long duration”item using a median absolute deviation es-timator, where the item is considered to be endorsed if it is greater than the long duration cutoff. Cutoffs used in this study are presented in Additional file 3. Categorical items are expanded into being separate dichotomous items for each level or category of the item. For the pur-pose of clarity, the term “feature” will be used to refer to the dichotomized (endorsed versus not endorsed) items or information used by the model/estimation process, while the term“cause”will be used to refer to “condition” or
“illness”or to healthy controls.
Natural language processing
We implemented techniques based on text mining and natural language processing to capture the“free response” information [25-29]. We were interested in identifying text signals that held some diagnostic value and then in
“tokenizing”the free text into data features that could be used by computational algorithms. For example, for the text feature“alcohol”, an interview would have a 1 if that word appeared in the free response section and a 0 if it did not. In addition, some words or expressions are es-sentially synonymous for data classification purposes (for example, “alcohol”, “alcoholism”, and “alcoholic”). In a process called stemming, we treat the root of the word (in this case, “alcohol”) as the actual text feature instead of the entire word itself. To take care of misspellings, mis-translations, or variations in medical terminology we utilized the dictionary developed for VA analysis that mapped roughly synonymous words to a single text fea-ture. We utilized in this process the TM package in R [30].
Train-test environment
A critical component of developing and validating data classification models is constructing an appropriate val-idation environment. A given model must be “trained” on a randomly selected portion of the dataset and then
“tested” on an uncontaminated separate portion of the dataset. In this study we split the entire dataset into 75% train data and 25% test data, where the components are sampled by the outcome variable (in this case, the dis-ease). Thus, if there were 100 cirrhosis cases in the full dataset, then 25 would be sampled into the test data and 75 into the train data. This train-test split is repeated 500 times to conduct 500 simulations and to estimate uncertainty around the predictive validity estimates.
Previous research in VA has shown that i) predictive validity is artificially enhanced when test and train com-position are similar and ii) the estimated performance of a method is largely a function of the cause composition of the test dataset [31]. To solve the second problem, following Murray et al. [31], we varied the composition of the test data by resampling with replacement based on an uninformative Dirichlet distribution.
Models
Four data-driven models for VA classification were tested and validated as part of the PHMRC study. We were able to adapt each of these models for use in the SD analysis. Three of the models – Tariff [18], Simplified Symptom Pattern [32], and Random Forest [16] – are capable of diagnosing individual subjects and estimating specific mortality fractions (CSMFs), or in our case, cause-specific prevalence fractions (CSPF), while the King-Lu [33] algorithm can only estimate CSMFs (or in our case CSPFs). The selected method for this analysis was Tariff,
which has shown a good performance in previous studies [23] and is described in detail.
Tariff is a simple additive algorithm that uses the cal-culation of a “tariff” (similar to a Z-score) for each cause-feature combination in the training data followed by a summation and ranking function to predict the most likely causes for each subject in the test dataset. The Tariff for a given cause-feature combination quan-tifies how uniquely and strongly predictive a given data feature is for a given cause. The Tariff for cause i and featurejis calculated as:
Tarif fij¼ xij − Median xj Interquartile Range xj
where Tariffij is the tariff for cause i, feature j, xijis the
fraction of subjects with cause i for which there is a posi-tive response for item j, median (xj) is the median fraction
with a positive response for feature j across all causes, and interquartile range xjis the interquartile range of positive
response rates for feature j averaged across causes. For each subject in the SD dataset, we compute summed Tariff scores for each cause:
Tariff Scoreki¼
Xw
j ¼ 1
Tarif fijxjk
The Tariff scores for each cause are ranked across all subjects, and the top-ranked cause for each subject is assigned as the diagnosis for that subject.
Analysis
We assessed and compared the capability of the SD model using the VA performance metrics described by Murray et al. [31]. SD is capable of i) predicting whether or not an individual suffers from different NCDs and ii) estimating the fraction of individuals in a population who suffer from a given condition. Consequently, the performance of SD should be quantified in both the in-dividual and population domains.
Chance-corrected concordance
Chance-corrected concordance (CCC) is a measure of a method’s ability to correctly diagnose a condition in an individual. However, because random assignment of N different causes would be correct 1/N times, this metric must also be adjusted for random chance [31].
The formal calculation of CCC for cause j (CCCj) is:
CCCj¼ T Pj
T PjþFNj
− 1
N
1− 1
N
Cause-specific prevalence fraction (CSPF) accuracy
Following Murray et al. [31], we used CSPF accuracy as a metric to assess the ability of the questionnaire to estimate prevalence fractions, analog to CSMF in a verbal autopsy study. In our case, CSPF accuracy, which is an aggregate measure across all causes k, is formally defined as:
CSPFAccuracy¼1−
Xk
j¼1
CSPFtj−CSPFjPred
2 1−Min CSPFt j
Where the superscript for CSPF refers to true (“t”) or predicted (“pred”) cause fractions. The denominator re-flects the maximum possible CSPF error in the given test split:
CSPF Maximum Error ¼ 2 1 ‐Minimum CSPFj t
Hence, CSPF accuracy can be described as 1 minus the sum of absolute errors divided by the maximum error. A CSPF accuracy of 1 would indicate perfect cause fraction predictions, while 0 would indicate the worst possible model.
We assessed the performance of SD in the two metrics described above and in terms of cause fraction absolute error, which allows for inspection of its performance in measuring prevalence fractions for each cause. Each type of validation was conducted across 500 splits of data. We tested each method under two conditions: with all data features and with all data features excluding HCE information.
We also analyzed whether SD methods systematically over- or underestimate the prevalence fractions. Using the true and estimated prevalence fractions from 500 splits, we conducted linear regressions where the esti-mated prevalence fraction was a function of the true prevalence. Stata, R, and Python were used for all ana-lysis and data management.
Results
Symptomatic diagnosis interviews
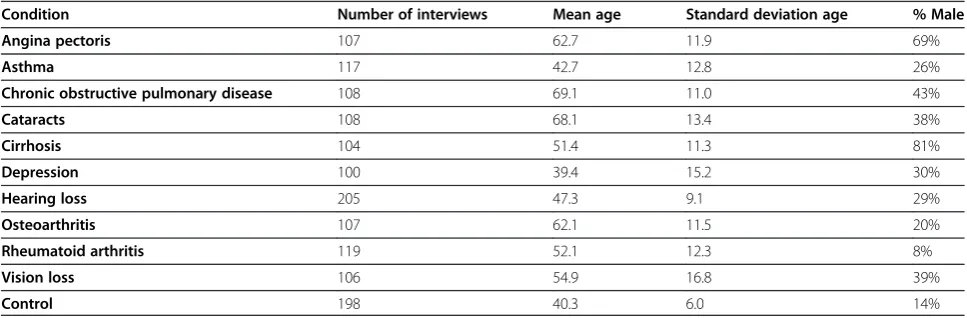
We collected 1,379 questionnaires with an accompany-ing gold standard diagnosis. The number of SD inter-views conducted for each of the 10 conditions and for controls are provided in Table 1. This table also provides the age and sex distribution by condition and shows that the project gathered approximately the target number of interviews or more for each condition and for the con-trol group.
Although questionnaires were analyzed using all of the different methods mentioned above, this section pre-sents only the results derived from the Tariff method. Results from analysis using other methods are presented in Additional file 4 as robustness checks.
Table 2 provides the mean CCC for the Tariff method across 500 splits, with and without HCE. Overall, CCC increases with HCE. We calculated the estimated and true prevalence cause fractions for each test split of data. These true and estimated cause fractions were used to calculate absolute errors and CSPF accuracy across 500 splits. Table 2 also provides the median CSPF accuracy for the Tariff method across 500 splits, with and without HCE information. As in the case of CCC, accuracy in-creased with the inclusion of HCE information.
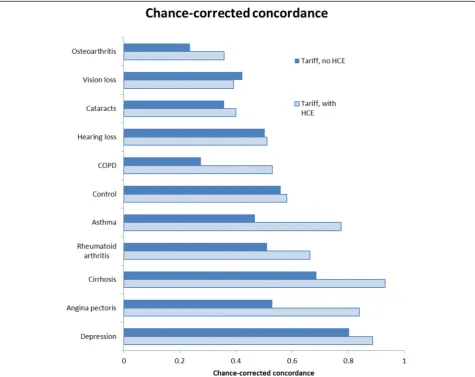
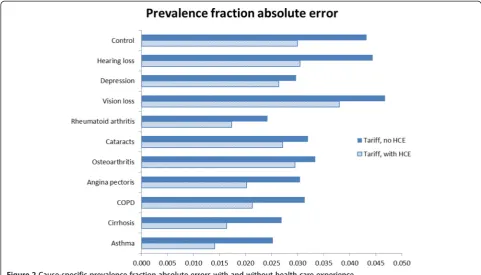
Figures 1 and 2 show CCC and prevalence fraction ab-solute errors for each specific condition with and with-out HCE. We observed that depression has high CCC regardless of whether HCE information is used, while vi-sion loss, cataracts, and osteoarthritis experience lower performance. Some causes, such as asthma, rheumatoid arthritis, cirrhosis, or angina, increase their CCC more than others by the inclusion of HCE information. Preva-lence fraction absolute errors are higher in the analysis without HCE, and are smaller for causes like rheumatoid arthritis, asthma, and cirrhosis.
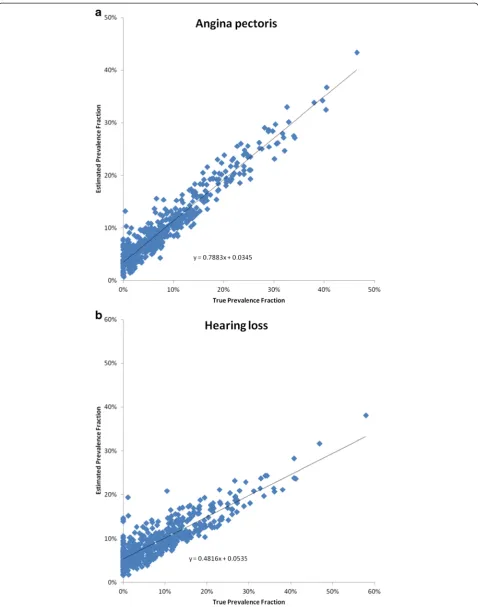
In the analysis to check whether SD systematically over- or underestimates the prevalence fractions, we con-ducted linear regressions where the estimated prevalence
Table 1 Characteristics of the study participants for each condition
Condition Number of interviews Mean age Standard deviation age % Male
Angina pectoris 107 62.7 11.9 69%
Asthma 117 42.7 12.8 26%
Chronic obstructive pulmonary disease 108 69.1 11.0 43%
Cataracts 108 68.1 13.4 38%
Cirrhosis 104 51.4 11.3 81%
Depression 100 39.4 15.2 30%
Hearing loss 205 47.3 9.1 29%
Osteoarthritis 107 62.1 11.5 20%
Rheumatoid arthritis 119 52.1 12.3 8%
Vision loss 106 54.9 16.8 39%
fraction was a function of the true one. An illustration of this analysis for angina pectoris with HCE is provided in Figure 3a. This figure and associated coefficient and inter-cept illustrate how the SD for this cause tends to slightly underestimate the prevalence of angina pectoris, except for very low true prevalence fractions. In contrast, the equivalent scatterplot in Figure 3b for hearing loss shows more overestimation when the true prevalence fraction is 0 but a general systematic underestimation for larger pre-valence fractions.
Cross-classification and cause aggregation
We found that the SD achieved high CCC for the causes of angina pectoris, depression, and cirrhosis. However, vision loss and osteoarthritis experienced lower performance. To explore if there was some cross-classification between vision loss with cataracts due to the similar clinical presen-tation of these conditions, we used cross-classification or
“confusion” matrices. An example of a confusion matrix for a single split (prior to undergoing the Dirichlet-based resampling) is shown in Additional file 5. This confusion
Table 2 Mean chance-corrected concordance and median cause-specific prevalence fraction accuracy across causes including uncertainty intervals, with and without health care experience (HCE), using the Tariff method
Chance-corrected concordance (CCC) Cause-specific mortality fractions accuracy
CCC estimate 95% uncertainty interval CCC estimate 95% uncertainty interval
No HCE 53.4% (53.2–53.9%) 0.772 (0.765–0.779)
With HCE 66.1% (65.6–66.5%) 0.826 (0.818–0.834)
matrix shows how 8 out of 24 true vision loss cases were correctly classified as vision loss, but 8 were misclassified as cataracts. Out of 27 true cataracts cases, 10 were cor-rectly classified as cataracts, but 5 were misclassified as vision loss.
This investigation of cause assignments indicated that there could be considerable cross-classification but also that the features most strongly associated with vision loss or cataracts had a much weaker association than other feature-cause combinations. This suggests the pos-sibility of increasing performance by combining similar causes. So, instead of differentiating between vision loss and cataracts, we generated a combined category of“ vi-sion loss or cataracts.” We measured the effect of this aggregation on performance and found that overall CCC increased by approximately 3% in absolute terms and that CSPF accuracy increased by 0.032 in absolute terms (Table 3). The prevalence fraction absolute error and CSPF accuracy for the nine-cause aggregation is shown in Additional file 6.
Discussion
The PHMRC SD study presents a novel source of data and an innovative application of VA research to compu-tational estimation of NCD burden. The study identified cases of 10 NCDs that had been diagnosed with gold standard criteria and then conducted a questionnaire with over 100 patients for each condition. The questionnaire was designed to estimate prevalence using data-driven
methods, specifically the Tariff method, which has been validated in VA studies. By applying Tariff to the PHMRC dataset, we sought to demonstrate that the questionnaire-based approach of SD may be a valuable asset to future epidemiological research concerning the burden of NCDs. We further simulated the application of Tariff in the field by testing the performance with the inclusion/exclusion of HCE information, which allowed us to determine the via-bility of using Tariff in areas with no health care, and by testing performance in samples of test data with random cause compositions. The results of the study can thus be considered robust due to i) the gold-standard validation of the questionnaire responses, ii) the calculation of predict-ive validity in various test data compositions, and iii) com-parisons with the performance of current epidemiological measurement approaches.
We observed that the Tariff method applied to the SD questionnaire is a promising approach for collecting prevalence data on the NCDs outlined in this study. Tariff was capable of estimating prevalence fractions within 3% for each condition. Additionally, 5 of the 11 conditions have a CCC of over 60%. Estimation of preva-lence fractions within 3% for these chronic conditions would allow for higher resolution epidemiological infor-mation in areas with sparse data, and for the conditions with high performance in terms of CCC, this techno-logy could be used for diagnoses in the field without requiring extensive medical expertise or other tools or resources.
While Tariff demonstrated accurate results in measur-ing certain conditions, it was found to be less accurate in others. The lower performance of Tariff in identifying vision loss, cataracts, and osteoarthritis can be explained partially through cross-classification error, but the rela-tively poor performance of hearing loss with Tariff may be a surprising result since it seems reasonable that hear-ing loss patients would express somewhat salient signs and symptoms compared with other conditions. The ana-lysis of endorsement rates of all features by true cause showed that one of the obstacles in diagnosing hearing loss based on this questionnaire derives from a lack of items with a high endorsement rate for hearing loss but not for other causes. For example, one item asks, “Have you ever had your hearing checked by a provider?”While the endorsement rates for hearing loss are high (91.2%) for this item, cases with the other conditions also endorse this item at a fairly high frequency (82.2% of the controls and 71.8% of the asthma cases). In contrast, causes that had better performance tend to have an item that has a high endorsement rate for that cause but not for others. For example, the question“Have you had a period lasting several days when you lost interest in most things that you
usually enjoy such as pastimes, relationships, or work?” has a 90% endorsement rate among depression cases, but no higher than 30.3% endorsement for other causes.
In our literature-based comparison to current methods, we observed that Tariff was capable of matching or out-performing the questionnaire-based methods such as the Rose questionnaire and the composite international diag-nostic interview (CIDI) depression questions in terms of prevalence estimation (Table 4). The SD questionnaire es-sentially includes the Rose questionnaire, CIDI depression questions, and the World Health Survey asthma ques-tions. Since, in theory, the positive endorsement of the items for these questions should essentially ensure correct diagnosis, it may be surprising that the data-driven SD methods can achieve higher performance than these cur-rent approaches. That is, we did not need to “tell” Tariff that endorsement of the Rose questions indicates angina pectoris; rather, Tariff determined those relationships on its own. The result in some ways parallels the finding in VA research that computational methods can compete with and possibly outperform physician-certified autopsy.
Current estimation of COPD, rheumatoid arthritis, osteoarthritis, vision loss, hearing loss, cirrhosis, and cata-racts can be undertaken with a high level of accuracy in a clinical setting, but their diagnosis requires specialized diagnostic equipment and extensive medical training. Cer-tainly, it is desirable to collect the most accurate informa-tion possible, but access to these tools and resources is not possible in all areas of the world. Furthermore, SD has the unique advantage of being able to collect information on every condition after conducting a single interview. The alternative approaches of carrying diagnostic equip-ment for each of these conditions or conducting multiple cause-specific diagnostic surveys in parallel seems very implausible. As discussed in the introduction, this is an unfortunate paradox since the areas lacking these re-sources are also likely the areas that have the worst health. SD, in this regard, is a valuable alternative to collecting more refined information in a resource-poor setting. A household survey can be conducted virtually anywhere in the world. Currently, Demographic and Health Surveys and World Health Surveys cover areas of the world such as Sudan, Cote d’Ivoire, and Democratic Republic of Congo, for example. If access to the tools and expertise to
Table 3 Chance-corrected concordance and cause-specific prevalence fraction accuracy for nine-cause aggregation using the Tariff Method, with and without health care experience (HCE)
Chance-corrected concordance (%)
No HCE (%)
With HCE (%)
Cirrhosis 82.4 90.6
Depression 87.5 88.7
Angina pectoris 80.1 84.1
Asthma 68.9 76.4
Arthritis 63.4 70.3
Vision loss or cataracts 57.0 57.4
Chronic obstructive pulmonary disease 41.6 49.5
Hearing loss 47.1 47.9
Control 56.5 57.8
Mean chance-corrected concordance (%) 65.0 69.2
Median cause-specific prevalence fractions accuracy 0.842 0.858
Table 4 Absolute errors in prevalence estimates from SD method to literature-based approaches
Condition Test Absolute error (95% CI) Symptomatic diagnosis-Tariff method with health care experience absolute error (95% CI)
Asthma World Health Survey (WHS): Doctor (MD) diagnosis (Dx) [34] 0.023 (0.020, 0.025) 0.014 (0.012, 0.016)
WHS MD Dx OR asthma medications (Rx) [34] 0.023 (0.020, 0.025)
WHS MD Dx OR asthma Rx OR wheezing/whistling attacks [34] 0.092 (0.087, 0.095)
Angina pectoris Rose questionnaire [35,36] 0.082 (0.073, 0.088) 0.020 (0.018, 0.022)
diagnose these conditions in these areas is unavailable, then SD-based epidemiology could be a practical alterna-tive. The use of SD methods in low-resource or inaccess-ible areas to identify and focus attention on the chronic disease burden could also help address the aforemen-tioned paradox. Furthermore, training field workers to conduct an SD survey seems likely to be less expensive than making available the resources to diagnose all of the conditions outlined in this study. Cumulatively, this flexi-bility makes SD a compelling alternative strategy for measuring the burden of these conditions.
Limitations
Our study had some inherent limitations. One of the main limitations and questions in VA research is that question-naire responses for deaths that occur in the community could be systematically different than the responses from deaths that occur in hospitals. If the response patterns are sufficiently different, then the computational methods could perform differently than expected when they are im-plemented in the field. However, this limitation, which ap-plies also to SD, is essentially a normative question. It is not possible to develop data-driven models unless this limitation is accepted, and as previous research in VA has shown, data-driven models can match or outperform expert-based models [23]. To deal with this limitation, we drew 500 samples with different prevalence of NCDs under study from our study sample, and attempted to simulate cases where the respondent did not have access to health care by conducting analyses in which we with-held HCE features.
A second limitation is that the study did not include individuals whose address could not be found, and this may potentially introduce a bias if individuals who were not found are systematically different in their socioeco-nomic status or other characteristics from the ones who were located. The main reason for not locating cases was that the patient provided the address of a relative to have access to some hospitals in Mexico City; therefore, we do not think that it is likely that there are clear dif-ferences in the socioeconomic status of these individuals. However, it is possible that the study may exclude some individuals from lower socioeconomic status that could not be located.
Since prevalence data are sparse in many areas of the world, it is important to consider the potential imple-mentation of the SD methods outlined in this study in countries besides Mexico. The 10 NCDs considered in this study are also highly prevalent in areas of Africa and Asia, and this consideration raises the question if there exist systematic cultural variations in questionnaire re-sponse data. It seems plausible that rere-sponse patterns for something as sensitive as a medical interview will have cultural idiosyncrasies. This limitation can be addressed
by further collection of validated SD questionnaire re-sponses in other countries. In fact, additional validated SD questionnaire response data would strengthen the per-formance of the existing models. Furthermore, the com-putational SD methods can readily be retrained on any further validation data collected, though similar to VA, the general SD approach will be strongest if a central data repository is maintained such that the central Tariff matrix can be continually updated.
Finally, while the inclusion of healthy controls is ge-nerally a strength in this study, it is possible that the healthy controls can be ill with minor conditions. The inclusion of these controls is important, however, be-cause it allows for a model to predict that a person does not suffer from a given condition despite possibly pre-senting some of the signs and symptoms associated with that condition. For example, 50% of the controls report a non-productive cough, which is not a dramatically lower endorsement rate than asthma, in which 58% of cases reported a non-productive cough. The inclusion of controls highlights one of the important differences be-tween SD and VA: every person who dies has an under-lying cause of death, but not every living person has an underlying illness. There were also some differences in the characteristics of the health controls compared to the rest of the study participants as shown on Table 1; specifically, the controls tend to be slightly younger and are more frequently female than the other participants.
Future implementation
Ideally, future work will further develop the capabilities of SD in assessing the prevalence of other NCDs in other areas of the world, contributing to a better under-standing of the burden of NCDs globally.
With these considerations, the implementation of the tool developed in this study requires two further steps for interested users. The first step is facilitating the im-plementation of the questionnaire itself. The question-naire is provided in this study and can hypothetically be used as-is. However, current work in VA is moving to-ward using tablet devices that can use questionnaire software such as Open Data Kit Collect to facilitate data collection. Options such as geotagging, digital imagery, and improved instrument clarity/organization make this an even more compelling data collection approach. The second required step is developing a user-friendly soft-ware package that readily conducts the method des-cribed in this study. Reducing these barriers will facilitate more rapid use of the methods outlined in this study to improve the collection of health information for NCDs.
Conclusions
The SD study had the goal to develop better instruments and methods for measuring population health, particu-larly in resource-poor settings where clinicians are not available to assist in diagnosis of NCDs. To this end, the study was a success in that it found that the Tariff me-thod could accurately measure the prevalence of several important conditions. This study provides a promising way to improve strategies for population health measure-ment and to produce instrumeasure-ments that are scientific, stan-dardized, and widely applicable across different resource-poor settings. Although more work is required to test this method in other NCDs and in different settings, the SD questionnaire combined with the Tariff method, has the potential to help researchers better measure the burden of NCDs and to additionally enable policymakers and researchers to help address persistent inequities in health outcomes in both the developed and the deve-loping world.
Additional files
Additional file 1:Medically relevant symptomatic diagnosis questionnaire items.
Additional file 2:Gold standard criteria [38].
Additional file 3:Cutoff for endorsement of each continuous/ duration questionnaire item.
Additional file 4:Results of analysis using different analytical methods.
Additional file 5:Example of confusion matrix for true and estimated cause classifications.
Additional file 6:Prevalence fraction absolute error and CSPF accuracy for nine-cause Tariff.Method aggregation, with and without HCE.
Abbreviations
CCC:Chance-corrected concordance; CIDI: Composite international diagnostic interview; CLIDDA: Automated detection and diagnosis clinic; COPD: Chronic obstructive pulmonary disease; CSMF: Cause-specific mortality fractions; CSPF: Cause-specific prevalence fractions; HCE: Health care experience; NCD: Non-communicable disease; PHMRC: Population health metrics research consortium; SD: Symptomatic diagnosis; VA: Verbal autopsy.
Competing interests
The authors declare that they have no competing interests.
Authors’contributions
SLJ prepared the data, conducted the analysis, and wrote the paper draft. MR, DR, SG, and KP contributed to the study design and guided the data collection. AF provided input on the model development and refinement and helped edit the paper. PS and AS contributed to the analysis. CJLM guided the analysis. EG guided the analysis, edited the paper, and contributed to the study design. RL contributed to the study design, data collection, and edited the paper draft. BH contributed to the study design, helped write the paper, and guided the data collection process in Mexico. All authors read and approved the final manuscript.
Acknowledgments
The authors thank our collaborators Dr. Osvaldo González La Rivere, Dra. Araceli Martínez González, Dr. Miguel Ángel Martínez Guzmán, Dr. Argemiro José Genes Narr, Dr. Antonio Manrique Martin, Dr. Adrián Ramírez Alvear, Dr. Benjamín Méndez Pinto, Dr. Enrique Garduño Salvador, Dr. Rogelio Pérez Padilla, Dra. Cecilia García Sancho, Dr. Mauricio Moreno Portillo, Dr. Carlos Tena, Dra. Lucía Yáñez, Dra. Ma. Elena Medina-Mora, Dr. Lino Palacios, and Dr. Eduardo Barragán Padilla. The authors also thank the Secretary of Health of the Federal District in Mexico City, Dr. Armando Ahued, and the coordinator of high specialty hospitals of the Ministry of Health, Dr. Bernardo Bidart, for their help in accessing medical records needed for this study. The authors are additionally grateful to Kelsey Pierce, Summer Ohno, and Meghan Mooney for their help in the project, and to Miriam Alvarado, Theo Vos, Ali Mokdad, and Mehrdad Forouzanfar for their insight on current Global Burden of Disease estimation strategy.
Author details
1Institute for Health Metrics and Evaluation, University of Washington, 2301
Fifth Ave., Suite 600, Seattle, WA 98121, USA.2Geisel School of Medicine at
Dartmouth, Dartmouth College. 1 Rope Ferry Road, Hanover, NH 03755-1404, USA.3Center for Population Health Research, National Institute of Public
Health, Av. Universidad 655. Col. Santa María Ahuacatitlán, Cuernavaca, Morelos 62508, Mexico.4Center for Health Systems Research, National
Institute of Public Healt. Av. Universidad 655. Col. Santa María Ahuacatitlán, Cuernavaca, Morelos 62508, Mexico.5Ipas, P.O. Box 9990, Chapel Hill, NC
27515, USA.
Received: 11 September 2014 Accepted: 8 December 2014
References
1. Murray CJL, Vos T, Lozano R, Naghavi M, Flaxman AD, Michaud C, et al. Disability-adjusted life years (DALYs) for 291 diseases and injuries in 21 regions, 1990–2010: a systematic analysis for the Global Burden of Disease Study 2010. Lancet. 2012;380:2197–223.
2. USAID Deliver Project. Price Analysis of Malaria Rapid Diagnostic Test Kits. 2010. http://deliver.jsi.com/dlvr_content/resources/allpubs/logisticsbriefs/ RDTPricAnal.pdf
3. Mallol J, Solé D, Baeza-Bacab M, Aguirre-Camposano V, Soto-Quiros M, Baena-Cagnani C, et al. Regional variation in asthma symptom prevalence in Latin American children. J Asthma. 2010;47:644–50.
4. Benjet C, Borges G, Medina-Mora ME, Zambrano J, Aguilar-Gaxiola S. Youth mental health in a populous city of the developing world: results from the Mexican Adolescent Mental Health Survey. J Child Psychol Psychiatry. 2009;50:386–95.
6. Bennett K, Cardiel MH, Ferraz MB, Riedemann P, Goldsmith CH, Tugwell P. Community screening for rheumatic disorder: cross cultural adaptation and screening characteristics of the COPCORD Core Questionnaire in Brazil, Chile, and Mexico. J Rheumatol. 1997;24:160–8.
7. Menezes AM, Perez-Padilla R, Jardim JR, Muiño A, Lopez MV, Valdivia G, et al. Chronic obstructive pulmonary disease in five Latin American cities (the PLATINO study): a prevalence study. Lancet. 2005;366:1875–81. 8. Brodman K, Erdmann AJ, Lorge I, Wolff HG, Broadbent TH. The Cornell
Medical Index: an adjunct to medical interview. JAMA. 1949;140:530–4. 9. Brodman K, van Woerkmon AJ, Erdmann AJ, Goldstein LS. Interpretation
of symptoms with a data-processing machine. Arch Intern Med. 1959;103:776–82.
10. Brodman K. Diagnostic decisions by machine. IRE Trans Med Electronics. 1960;7:216–9.
11. van Woerkom AJ, Brodman K. Statistics for a diagnostic model. Biometrics. 1961;17:299–318.
12. Fottrell E, Högberg U, Ronsmans C, Osrin D, Azad K, Nair N, et al. A probabilistic method to estimate the burden of maternal morbidity in resource-poor settings: preliminary development and evaluation. Emerg Themes Epidemiol. 2014;11:3.
13. Choi BW, Yoo KH, Yeong JW, Yoon HJ, Kim SH, Park YM, et al. Early diagnosis of asthma: computer-assisted symptom-based diagnosis. J Korean Med Sci. 2007;22:832–8.
14. Craig JC, Williams GJ, Jones M, Codarini M, Macaskill P, Hayen A, et al. The accuracy of clinical symptoms and signs for the diagnosis of serious bacterial infection in young febrile children: prospective cohort study of 15 781 febrile illnesses. BMJ. 2010;340:c1594.
15. WHO. World Health Survey Instruments and Related Documents http://www.who.int/healthinfo/survey/instruments/en/index.html. 16. Flaxman AD, Vahdatpour A, Green S, James SL, Murray CJ. Random forests
for verbal autopsy analysis: multisite validation study using clinical diagnostic gold standards. Population Health Metrics. 2011;9:29. 17. Flaxman AD, Vahdatpour A, James SL, Birnbaum JK, Murray CJ. Direct
estimation of cause-specific mortality fractions from verbal autopsies: multisite validation study using clinical diagnostic gold standards. Population Health Metrics. 2011;9:35.
18. James SL, Flaxman AD, Murray CJ. Performance of the Tariff Method: validation of a simple additive algorithm for analysis of verbal autopsies. Population Health Metrics. 2011;9:31.
19. Lozano R, Freeman MK, James SL, Campbell B, Lopez AD, Flaxman AD, et al. Performance of InterVA for assigning causes of death to verbal autopsies: multisite validation study using clinical diagnostic gold standards. Population Health Metrics. 2011;9:50.
20. Lozano R, Lopez AD, Atkinson C, Naghavi M, Flaxman AD, Murray CJ. Performance of physician-certified verbal autopsies: multisite validation study using clinical diagnostic gold standards. Population Health Metrics. 2011;9:32.
21. Murray CJ, James SL, Birnbaum JK, Freeman MK, Lozano R, Lopez AD. Simplified Symptom Pattern Method for verbal autopsy analysis: multisite validation study using clinical diagnostic gold standards. Population Health Metrics. 2011;9:30.
22. Murray CJ, Lopez AD, Black R, Ahuja R, Ali SM, Baqui A, et al. Population Health Metrics Research Consortium gold standard verbal autopsy validation study: design, implementation, and development of analysis datasets. Population Health Metrics. 2011;9:27.
23. Murray CJL, Lozano R, Flaxman AD, Serina P, Phillips D, Stewart A, et al. Using verbal autopsy to measure causes of death: the comparative performance of existing methods. BMC Med. 2014;12:5.
24. Institute for Health Metrics and Evaluation. Population Health Metrics Research Consortium. http://www.healthdata.org/population-health-metrics-research-consortium-phmrc.
25. Cohen AM, Hersh WR. A survey of current work in biomedical text mining. Brief Bioinform. 2005;6:57–71.
26. Dale R, Moisl H, Somers H. Handbook of natural language processing. Computational Linguistics. 2001;27:602–3.
27. Kao A, Poteet SR. Natural Language Processing And Text Mining. London: Springer; 2007.
28. Kim J-D, Ohta T, Tateisi Y, Tsujii J. GENIA corpus–a semantically annotated corpus for bio-textmining. Bioinformatics. 2003;19:i180–2.
29. Rajman M, Besancon R. Text mining: natural language techniques and text mining applications. In: Proceedings of the 7th IFIP Working Conference on Database Semantics (DS-7). London: Chapamann and Hall; 1997. p. 7–10. 30. R-Forge. tm–Text Mining Package. http://tm.r-forge.r-project.org/. 31. Murray CJ, Lozano R, Flaxman AD, Vahdatpour A, Lopez AD. Robust metrics
for assessing the performance of different verbal autopsy cause assignment methods in validation studies. Population Health Metrics. 2011;9:28. 32. Murray CJL, Lopez A, Feehan DM, Peter ST, Yang G. Validation of the
Symptom Pattern Method for Analyzing Verbal Autopsy Data. PloS Med. 2007;4:e327.
33. King G, Lu Y. Verbal autopsy methods with multiple causes of death. Stat Sci. 2008;23:78–81.
34. To T, Stanojevic S, Moores G, Gershon AS, Bateman ED, Cruz AA, et al. Global asthma prevalence in adults: findings from the cross-sectional world health survey. BMC Public Health. 2012;12:204.
35. Rose GA. The diagnosis of ischaemic heart pain and intermittent claudication in field surveys. Bull World Health Organ. 1962;27:645–58. 36. Ugurlu S, Seyahi E, Yazici H. Prevalence of angina, myocardial infarction and
intermittent claudication assessed by Rose Questionnaire among patients with Behcet’s syndrome. Rheumatology. 2008;47:472–5.
37. World Health Organization. The World Mental Health Composite International Diagnostic Interview. http://www.hcp.med.harvard.edu/ wmhcidi/index.php.
38. American Psychiatric Association. Diagnostic and Statistical Manual of Mental Disorders, 4thedition. Arlington, VA, USA, 1994.
Submit your next manuscript to BioMed Central and take full advantage of:
• Convenient online submission
• Thorough peer review
• No space constraints or color figure charges
• Immediate publication on acceptance
• Inclusion in PubMed, CAS, Scopus and Google Scholar
• Research which is freely available for redistribution