R E S E A R C H
Open Access
A multicenter quasi-experimental study: impact of
a central line infection control program using
auditing and performance feedback in five
Belgian intensive care units
Soraya Cherifi
1*, Michele Gerard
2, Sylvie Arias
1and Baudouin Byl
3,4Abstract
Background:We analyzed the impact associated with an intervention based on process control and performance
feedback to decrease central line-associated bloodstream infection (CLABSI) rates.
This study was conducted from March 2011 to September 2012 in five adult intensive care units (ICU) located in two Belgian tertiary hospitals A and B, with a total of 53 beds.
Methods:This study was divided in three phases: P1 (baseline), P2 (intervention) and P3 (post intervention). During P2, external monitoring of five central venous catheters (CVC) care critical processes and monthly reporting (meetings and feedbacks reports posted) of performance indicators (CLABSI rate, CVC utilization ratio, compliance rate with each care process, and insertion site) to ICU workers were performed. The external monitoring of process measures was assessed by the same trained research nurse.
A Poisson regression analysis was used to compare CLABSI incidence density rate per phase. Statistical significance was achieved with 2-sidedp-value of<0.05. For the analysis, we separated the five ICU in hospital A and B when appropriate.
Results:Significantly improved total mean compliance was achieved for hand hygiene, CVC handling and CVC
dressing. CLABSI rate declined from 4.00 (95% confidence interval (CI): 1.94-6.06) to 1.81 (0.46-3.17) per 1,000 CVC-days in P2 with an incidence rate ratio (IRR) of 0.49 (0.24-0.98,p= 0.043). A better response was observed in hospital A where the nurse participation at the monthly meeting was significantly higher than in hospital B (p< 0.001) as the percentage of feedbacks reports posted in ICU (p< 0.001). The decline in the CLABSI rate observed during P2 in comparison with P1 was independent of the insertion site (femoral or non-femoral;p= 0.054). The overall CLABSI rate increased to 2.73 (1.17-4.29) per 1,000 CVC-days with IRR of 0.67 (0.36-1.26,p= 0.212) in P3 compared to P1, but a high nursing turnover was observed in both hospitals.
Conclusions:Our intervention focused on external auditing and performance feedback resulted in significant reduction in rates of CLABSI. Investigation continues regarding the most effective way to sustain CLABSI prevention practices and to improve the culture of safety in healthcare.
Keywords:Audit, Feedback, Intensive care unit, Central-line associated bloodstream infection
* Correspondence:[email protected]
1
Infection Control Unit, Brugmann University Hospital, 4 Place Van Gehuchten, 1020 Brussels, Belgium
Full list of author information is available at the end of the article
Background
Bloodstream infections associated with the insertion and maintenance of central venous catheters (CVC) are the most common cause of health care-associated infections in intensive-care units (ICU) [1] and result in significant morbidity, prolonged length of stay, and excess health-care costs [2].
Prevention of central line-associated bloodstream infec-tion (CLABSI) remains a major issue for patient safety and costs. In fact, the CLABSI rate is proposed as an indi-cator of quality of care in ICU in several countries. Studies have shown that education and training of ICU health care workers (HCW) concerning CVC care is efficient in preventing CLABSI. Interventions focusing primarily on central-line insertion procedures, emphasized staff educa-tion, compliance to basic hygiene, and timely removal of CVC have been associated with substantial reductions in CLABSI rates [3-9]. Few studies have included the evalu-ation of post-insertion care [10-13].
Moreover, the prevention of CLABSI is a team effort involving all categories of HCW. Providing feedback on surveillance data to ICU staff has been associated with a reduced rate of hospital-acquired infections [14]. Such feedback is a useful complement to other strategies par-ticularly feedback regarding adherence to good practices of CVC care [8,15,16]. The published CLABSI guidelines provide recommendations for implementing a checklist to ensure compliance with evidence-based practices and for empowering nurses to ensure compliance with the checklist (self-report method) [17].
The aim of this prospective interventional study was to measure the added effectiveness of monitoring by an external infection control team and continuous feedback regarding performance indicators to decrease CLABSI rates. The secondary objective was to evaluate the sus-tainability of the project when discontinuing monitoring.
Methods Study design
This multicenter quasi-experimental study was conducted in five adult ICUs, designated ICU A1 (12 beds), A2 (12 beds), A3 (9 beds), B1 (10 beds) and B2 (10 beds), located in two tertiary hospitals A (853 beds) and B (509 beds) in Brussels, Belgium. Each ICU had mixed (medical and surgical) intensive-care beds with a separate ICU team (nurses and physicians). Before the beginning of the study, no surveillance data on the CLABSI rate or systematic re-cording of CVC-days was performed.
Study phase
The study was performed from March 2011 to September 2012 in 3 phases: a pre-intervention phase (Phase (P) 1), from March 2011 to August 2011, an intervention phase (P2), from September 2011 to February 2012 and
a post-intervention phase (P3), from March 2012 to September 2012.
Study setting
Written policies and procedures that incorporated all as-pects of the CVC care, maintenance and insertion pro-cesses were available to ICU staff. CVC kits that contained all the supplies necessary to comply with the sterile pro-cedure for CVC placement were available in each ICU. Lines were placed by attending physicians using an aseptic technique and avoiding the femoral vein for CVC inser-tion. The local procedures for CVC insertion followed standard guidelines, i.e., use of maximal barrier precau-tions, skin antisepsis and meticulous hand hygiene. Skin antisepsis was performed with 0.5% chlorhexidine in 70% alcohol (Cedium®, QUALIPHAR) or with 5% alcoholic povidone-iodine (Iso-Betadine® solution hydroalcoolique, MEDA Pharma). The same types of material were used in each ICU. In particular, antimicrobial coated catheters, antiseptic-impregnated catheters, chlorhexidine dressings and patches were not used.
Two meetings of one hour per ICU were organized in August 2011 to explain the study and remind the staff of the evidence-based procedures known to decrease rates of CLABSI. One meeting was held for medical and nurse ICU heads, and one meeting was held for ICU staff. The objectives proposed to the ICU staff were zero femoral site use, at least 80% adherence with CVC-care recom-mendations and a 50% decline in the CLABSI rate.
Throughout the study phase, the medical record of every patient in the ICU for at least 48 hours and with positive blood cultures was reviewed by each local infec-tion control team using a common data collecinfec-tion form. All positive blood cultures episodes were thereafter sub-categorized locally as CLABSI, primary bloodstream in-fection (BSI) (no CVC), secondary BSI, or contaminant. Each case was reviewed by the investigator team.
updated feedback report was posted in each ICU by the study investigator. Variations in nurse staffing, includ-ing the percentage of staff turnover and percentage of pool nurses were recorded. Data on the ICU physicians and nurses’participation at the monthly meetings orga-nized during P2 and the percentage of feedback posted
by the ICU staff throughout the ICU during P3 were also collected.
Definitions
We used the definitions for BSIs of the Belgian surveil-lance protocol corresponding to the 1998 CDC National
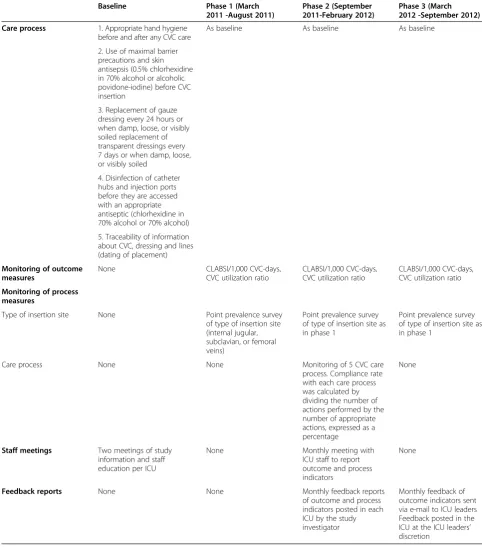
Table 1 Description of the central line infection control program
Baseline Phase 1 (March
2011 -August 2011)
Phase 2 (September 2011-February 2012)
Phase 3 (March 2012 -September 2012)
Care process 1. Appropriate hand hygiene
before and after any CVC care
As baseline As baseline As baseline
2. Use of maximal barrier precautions and skin antisepsis (0.5% chlorhexidine in 70% alcohol or alcoholic povidone-iodine) before CVC insertion
3. Replacement of gauze dressing every 24 hours or when damp, loose, or visibly soiled replacement of transparent dressings every 7 days or when damp, loose, or visibly soiled
4. Disinfection of catheter hubs and injection ports before they are accessed with an appropriate antiseptic (chlorhexidine in 70% alcohol or 70% alcohol)
5. Traceability of information about CVC, dressing and lines (dating of placement)
Monitoring of outcome measures
None CLABSI/1,000 CVC-days,
CVC utilization ratio
CLABSI/1,000 CVC-days, CVC utilization ratio
CLABSI/1,000 CVC-days, CVC utilization ratio
Monitoring of process measures
Type of insertion site None Point prevalence survey
of type of insertion site (internal jugular, subclavian, or femoral veins)
Point prevalence survey of type of insertion site as in phase 1
Point prevalence survey of type of insertion site as in phase 1
Care process None None Monitoring of 5 CVC care
process. Compliance rate with each care process was calculated by dividing the number of actions performed by the number of appropriate actions, expressed as a percentage
None
Staff meetings Two meetings of study
information and staff education per ICU
None Monthly meeting with
ICU staff to report outcome and process indicators
None
Feedback reports None None Monthly feedback reports
of outcome and process indicators posted in each ICU by the study investigator
Nosocomial Infections Surveillance guidelines [18]. CLABSI was defined as primary BSI with a central ven-ous catheter present for the last 48 hours. Secondary bacteremia was defined as BSI that developed as the re-sult of a documented infection with the same micro-organism at another site. The incidence density rate was defined as number of CLABSI cases per 1,000 CVC-days. For each phase, the total CLABSI incidence dens-ity rate was calculated as the mean of monthly CLABSI incidence density rates. The CVC-utilization ratio was obtained by dividing the number of CVC-days by the number of patient-days. If a patient had more than one CVC, only one was counted.
Participation in feedback meetings was expressed for nurses as a percentage (number of nurses present at each meeting compared to the number of nurses in the ICU in this phase) and for ICU physicians as a dichot-omous variable (participation was considered as effective if at least 2 physicians were present at each meeting).
Regular staff was defined as nurses permanently assigned to the ICU (expressed in full-time equivalents). Pool staff was defined as nursing staff who were employees of nurs-ing agencies. Pool staff was assigned to the ICU for differ-ent lengths of time. The staff turnover was defined as the percentage of regular ICU nurses leaving the ICU between the beginning and the end of the study.
The rate of feedback displayed during P3 was defined as the number of posters displayed in the ICU over the number of feedback reports addressed by the investiga-tor team.
Statistical methods
The results are expressed as the median (interquartile range) or as the mean (SD), as appropriate. Categorical variables were assessed with a Chi-square test or Fisher’s exact test when applicable. A Cochran-Mantel-Haenszel test was used in the analysis of stratified categorical data. As used in previous studies [9], and because CLABSI are rare events, a Poisson regression analysis was used to gen-erate an incidence-rate ratio (IRR) compared with pre-intervention CLABSI incidence density rates. One-way ANOVA test was applied to evaluate statistically signifi-cant difference between the CVC-utilization ratios across the different phases.
A 2-sided p-value<0.05 was considered statistically significant. All data analyses were performed using Stata software, version 12.0 (StataCorp LP, College Station, Texas, USA).
Ethical considerations
The institutional review boards at each hospital approved the study protocol (number CE 2011/31 for Brugmann University Hospital and number AK/11-03-31/4011 for Saint Pierre University Hospital).
Results
During the three study phases, there were 18,467 CVC-days. There was no statistically significant difference of the CVC-utilization ratio between the three phases (p = 0.679, one-way ANOVA test) (Table 2).
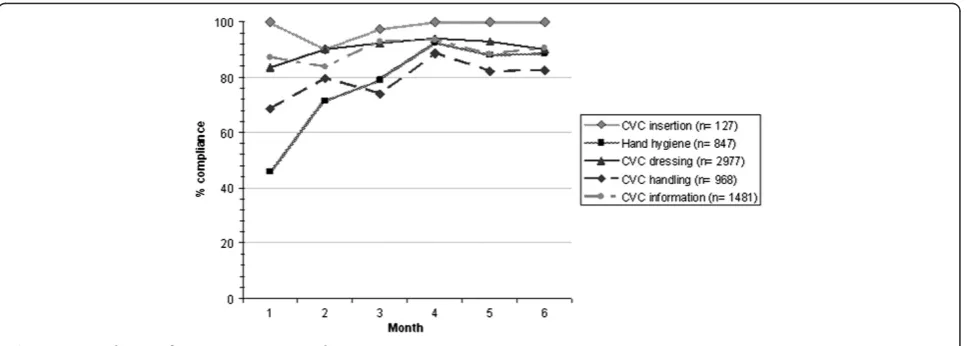
Process indicators
Monitoring of process measures was performed during a total of 111 hours. The rates of compliance with recom-mendations for CVC insertion and maintenance are rep-resented in Figure 1. Compliance with hand hygiene was 46% in the first month and increased significantly during months 2 to 6 of P2 (Relative risk [RR], 1.80; 95% confi-dence interval [CI]: 1.52-2.13,p< 0.001). Compliance with CVC handling was 69% in month 1 and also increased sig-nificantly (RR, 1.17; 95% CI: 1.03-1.33, p =0.003) as did compliance with CVC dressing (RR, 1.10; 95% CI: 1.05-1.15, p< 0.001). The median percentage of compliance during the 6 months of the interventional phase (inter-quartile range) with recommendations for adequate CVC care was distributed as follows: CVC insertion 100 (90– 100), hand hygiene 84 (46–93), CVC dressing 91 (83–94), CVC handling 81 (69–89), and notification of CVC and perfusions 90 (84–94). The median compliances for CVC care were not significantly different between hospitals A and B.
Microbiological features
In P1, 69% of microorganisms identified were Gram-positive, followed by Gram-negative organisms (27%) and fungi (4%). In P3, the same proportion of microor-ganisms was Gram-positive (69%), Gram negative (25%) and fungi (6%). In P2, 56% of microorganisms identified were Gram-negative, followed by Gram-positive organ-isms (38%) and fungi (6%). Most common organorgan-isms identified in both three phases wereStreptococcus species and Enterococcus species accounted for over 50% of the Gram-positive pathogens.
Outcomes indicators
During P2, a significant reduction in the overall CLABSI incidence density rate was observed with an incidence rate-ratio (IRR) of 0.49 (p= 0.043), and no change in the rate of secondary bacteremias. There was a 32% CLABSI incidence density rate reduction between P3 and P1, but the difference was not significant with IRR of 0.67 (p= 0.212) (Table 2).
During P3 in comparison with P2, the CLABSI incidence density rate increased to 2.83 (1.32-4.35) in hospital A, with IRR of 1.99 (0.68-5.81, p= 0.210) and remained stable at 2.74 (0.58-6.05) in hospital B with IRR of 0.92 (0.31-2.73,p= 0.876).
The rate of femoral CVC-use decreased between P2 (11%) and P1 (22%; RR, 0.50; 95% CI: 0.31-0.83,p= 0.01) and later increased between P3 (20%) and P2 (RR, 1.74; 95% CI: 1.06-2.87, p= 0.03). The numbers of femoral CLABSI among the total estimated femoral CVC-days were 7/1330, 3/704 and 3/1205 during P1, P2 and P3, re-spectively. The decline in the CLABSI rate observed dur-ing P2 in comparison with P1 was independent of the insertion site (femoral or non-femoral; Cochran-Mantel-Haenszel test,p= 0.054).
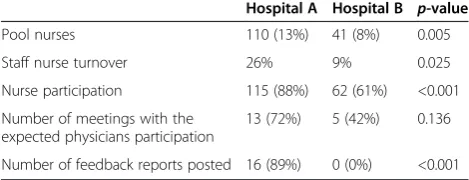
Organizational indicators
Comparative organizational parameters between hospi-tals A and B are reported in Table 3. The hospital A dif-fers significantly from hospital B by a higher variation in nurses staffing, a higher nurses’ participation in the monthly meetings and a higher percentage of feedbacks reports posted in ICU during P3.
Discussion
The objective of this study was to examine the effect on CLABSI rate of an external monitoring of CVC care com-pliance process with feedback aimed mainly at nurses. The major role of ICU nurses in reducing CLABSI rates was previously demonstrated with education programs dedicated especially to nurses [4,5]. To optimize preven-tion, it is now accepted that the“bundle”concept should be implemented, including five simple interventions sup-ported by strong scientific evidence for effectiveness: opti-mal hand hygiene, chlorhexidine skin antisepsis, maxiopti-mal barrier precautions for CVC insertion, use of optimal in-sertion sites, and prompt catheter removal [17]. This bun-dle is currently being used in several countries. Numerous studies have reported successful results after implementa-tion of a continuous, multifaceted strategy based on these measures [3-8,19]. In our study, compliance with insertion recommendations (observed in the first month of P2) was initially high, most likely because of previous sensitization and use of CVC kits. More recent studies suggest an added benefit from broadening prevention strategies to include evidence-based best practices for central-line maintenance [10,11]. We chose to also monitor
post-Table 2 Primary BSI, Secondary BSI and CLABSI rates per each phase
Phase Admissions Patient-days CVC-days Mean
CVC-utilization ratio
Total BSI episodes
Primary BSI (no CVC)
Secondary BSI (per 1,000 Patient- days)
CLABSI [mean CLABSI per 1,000 CVC-days*]
1 1,354 7,604 6,045 0.79 ± 0.07 37 1 12 (1. 58) 24 [4.00 (1.94-6.06)]
2 1,571 7,882 6,399 0.80 ± 0.11 33 6 15 (1.90) 12 [1.81 (0.46-3.17)]
3 1,439 7,615 6,023 0.78 ± 0.10 44 0 28 (3.68) 16 [2.73 (1.17-4.29)]
Total 4,364 23,101 18,467 0.79 ± 0.09 114 7 55 (2.38) 52 [2.85 (1.97-3.72)]
*Incidence Rate Ratio (95% Confidence Interval) andp-value (Poisson regression). In the phase 2 compared to phase 1: 0.49 (0.24-0.98),p= 0.043.
In the phase 3 compared to phase 1: 0.67 (0.36-1.26),p= 0.212. In the phase 3 compared to phase 2: 1.37 (0.65-2.89),p= 0.413.
insertion CVC care such as quality of dressing, systematic disinfection before use of any access points (hubs-con-nectors-injection ports) and hand hygiene before CVC contact. Our intervention resulted in a transient but sig-nificant reduction in CLABSI rates and the median per-centage of compliance with each procedure for CVC care was greater than 80%. As demonstrated by Furuya et al., the use of a CVC bundle is associated with lower infection rates only when compliance is high [20]. On the other hand, we observed no decrease in the CVC utilization ratio, but we did not implement a program focused on daily review of unnecessary catheters except indirectly with the surveillance of CVC placement dating. Finally, we achieved a significant decrease in femoral access during P2, with limited effect on the CLABSI rate. It is known that the risk of CLABSI varied according to the site of central venous access [21]. But we compared only femoral central venous access site to non-femoral central venous access site without regard-ing in details subclavian and internal jugular routes.
The difference of CLABSI incidence rate reduction ob-served between P2 and P1 in hospitals A and B could be explained by the significantly different participation of nurses recorded in the monthly meetings, reflecting less engagement at hospital B. We also observed a lack of investment by the ICU physicians as represented by their absence from the monthly meetings and the small amount of feedback posted in the ICU during P3 in hospital B. This may have influenced the outcome, as the HCW in the last may be less professionally moti-vated than the others. Ensuring staff understand the change process is fundamental to the success of a qual-ity improvement.
We observed a non significant reduction of CLABSI incidence rate in P3 in comparison with P1, while Pro-novost et al. [9] reported a sustained reduction of up to 66% in CLABSI rates after 18 months of follow-up in a larger study with an educational intervention based mainly on use of the CVC insertion bundle. Potentially, the lack of individual face-to-face contact and feedback maybe explains the lack of sustainability of our program, as described in another study [22]. In that study, each
HCW was approached individually regarding the insertion technique and maintenance of CVC and therefore felt valued and motivated. Our approach involved collective feedback through monthly and non-mandatory meetings. Successful practice changes require buy-in from partici-pants. Therefore, it is necessary to pay close attention to perceived barriers. More research is needed to develop a more direct measure of HCW engagement in quality and safety.
Another explanation for the declining performance during P3 could be the high turnover in nurse staffing and the high percentage of pool nurses recorded, particu-larly in hospital A. Robert et al. suggested in a case–control study that nurse staffing composition (i.e., pool-nurse– to-patient ratio) might be related to primary BSI risk [23]. In our study, the monitoring of process indicators was termi-nated at the end of P2, and in the following months, there were no more clinical reminders for ICU staff. Moreover, no specific training related to line care was planned for pool staff. Based on our experience, account should be taken of these structural parameters to adjust in further studies the frequency of process measurements. Finally, feedback alone (as done in P3) was ineffective for altering provider behaviors.
There are a number of limitations to this study. First, it is not a randomized trial, but a quasi-experimental study without a concurrent control group, a design frequently used for this type of study. Thus, other unmeasured fac-tors, such as long-term trends or seasonal confounders might have occurred coincident with the intervention resulting in independent variations in CLABSI rates [24]. Second, unmeasured factors such as patient risk severity may have confounded CLABSI rates; however, it is unlikely that the case composition would have changed in the same manner during the intervention phase in all 5 ICUs.
Conclusions
Our encouraging results emphasized the value of this intervention based on auditing and feedback to reinforce practice changes to decrease CLABSI rates. This inter-vention was dependant on local factors such as the lack of leadership and support inside the ICU and the high turnover of ICU nurses, as illustrated by the difference observed between the 2 hospitals despite a targeted compliance with CVC care recommendations achieved. Our study underlines the need to monitor behavioral parameters in addition to process and results indicators, to analyze the benefits of any new infection control pro-gram. Further studies are needed to determine which strategies are most effective in changing professional be-havior and in promoting long-term, sustained adherence to evidence-based practices for CLABSI prevention.
Table 3 Comparative analysis of organizational indicators between hospital A and hospital B
Hospital A Hospital B p-value
Pool nurses 110 (13%) 41 (8%) 0.005
Staff nurse turnover 26% 9% 0.025
Nurse participation 115 (88%) 62 (61%) <0.001
Number of meetings with the expected physicians participation
13 (72%) 5 (42%) 0.136
Competing interests
The authors declare that they have no competing interests.
Authors’contributions
SC and BB contributed to the conception of the study. SC, SA and MG participated in the data collection. SA and BB contributed to statistics. SC, SA, MG and BB interpretated data. All authors read and approved the final manuscript.
Acknowledgments
We thank all of the ICU teams, particularly Drs D. De Bels, J. Devriendt, P. Deschamps, P. Gottignies and E. Stevens, for their participation in the study and their dedication to improving the quality of the care and safety of their patients.
SC received research grants from the IRIS Research Fund (Fonds Iris Recherche) n°: 2011-R20690-001 awarded through the King Baudouin Foundation (Fondation Roi Baudouin).
Author details 1
Infection Control Unit, Brugmann University Hospital, 4 Place Van Gehuchten, 1020 Brussels, Belgium.2Infection Control Unit, Saint Pierre University Hospital, 322 Rue Haute, 1000 Brussels, Belgium.3Infection Control Unit, Erasme University Hospital, 808 Route de Lennik, 1070 Brussels, Belgium.4School of Public Health, Université Libre de Bruxelles, Brussels, Belgium.
Received: 27 September 2013 Accepted: 2 December 2013 Published: 5 December 2013
References
1. World Health Organization:Preventing bloodstream infections from central line venous catheters; 2012. http://www.who.int/patientsafety/ implementation/bsi/en/index.html.
2. Tacconelli E, Smith G, Hieke K, Lafuma A, Bastide P:Epidemiology, medical outcomes and costs of catheter-related bloodstream infections in inten-sive care units of four European countries: literature- and registry-based estimates.J Hosp Infect2009,72:97–103.
3. Berenholtz SM, Pronovost PJ, Lipsett PA, Hobson D, Earsing K, Farley JE, Milanovich S, Garrett-Mayer E, Winters BD, Rubin HR, Dorman T, Perl TM: Eliminating catheter-related bloodstream infections in the intensive care unit.Crit Care Med2004,32:2014–2020.
4. Warren DK, Zack JE, Mayfield JL, Chen A, Prentice D, Fraser VJ, Kollef MH: The effect of an education program on the incidence of central venous catheter-associated bloodstream infection in a medical ICU.Chest2004, 126:1612–1618.
5. Coopersmith CM, Rebmann TL, Zack JE, Ward MR, Corcoran RM, Schallom ME, Sona CS, Buchman TG, Boyle WA, Polish LB, Fraser VJ:Effect on an education program on decreasing catheter-related bloodstream infec-tions in the surgical intensive care unit.Crit Care Med2002,30:59–64. 6. Sherertz RJ, Ely EW, Westbrook DM, Gledhill KS, Streed SA, Kiger B, Flynn L,
Hayes S, Strong S, Cruz J, Bowton DL, Hulgan T, Haponik EF:Education of physicians-in-training can decrease the risk for vascular catheter infec-tion.Ann Intern Med2000,132:641–648.
7. Eggimann P, Harbarth S, Constantin MN, Touveneau S, Chevrolet JC, Pittet D: Impact of a prevention strategy targeted at vascular-access care on inci-dence of infections acquired in intensive care.Lancet2000,355:1864–1868. 8. Marra AR, Cal RG, Durão MS, Correa L, Guastelli LR, Moura DF Jr, Edmond
MB, Dos Santos OF:Impact of a program to prevent central line-associated bloodstream infection in the zero tolerance era.Am J Infect Control2010,38:434–439.
9. Pronovost P, Needham D, Berenholtz S, Sinopoli D, Chu H, Cosgrove S, Sexton B, Hyzy R, Welsh R, Roth G, Bander J, Kepros J, Goeschel C:An intervention to decrease catheter-related bloodstream infections in the ICU.N Engl J Med2006,355:2725–2732.
10. Guerin K, Wagner J, Rains K, Bessesen M:Reduction in central line-associated bloodstream infections by implementation of a post-insertion care bundle.Am J Infect Control2010,38:430–433.
11. Longmate AG, Ellis KS, Boyle L, Maher S, Cairns CJ, Lloyd SM, Lang C: Elimination of central-venous catheter related bloodstream infections from the intensive care unit.BMJ Qual Saf2011,20:174–180.
12. Rosenthal VD, Ramachandran B, Villamil-Gómez W, Armas-Ruiz A, Navoa-Ng JA, Matta-Cortés L, Pawar M, Nevzat-Yalcin A, Rodríguez-Ferrer M, YıldızdaşRD, Menco A, Campuzano R, Villanueva VD, Rendon-Campo LF, Gupta A, Turhan O, Barahona-Guzmán N, Horoz OO, Arrieta P, Brito JM, Tolentino MC, Astudillo Y, Saini N, Gunay N, Sarmiento-Villa G, Gumus E, Lagares-Guzmán A, Dursun O: Impact of a multidimensional infection control strategy on central line-associated bloodstream infection rates in pediatric intensive care units of five developing countries: findings of the International Nosocomial Infec-tion Control Consortium (INICC).Infection2012,40:415–423.
13. Rinke ML, Chen AR, Bundy DG, Colantuoni E, Fratino L, Drucis KM, Panton SY, Kokoszka M, Budd AP, Milstone AM, Miller MR:Implementation of a central line maintenance care bundle in hospitalized pediatric oncology patients.Pediatrics2012,130:996–1004.
14. Gaynes R, Richards C, Edwards J, Emori TG, Horan T, Alonso-Echanove J, Fridkin S, Lawton R, Peavy G, Tolson J:Feeding back surveillance data to prevent hospital-acquired infections.Emerg Infect Dis2001,7:295–298. 15. Wall RJ, Ely EW, Elasy TA, Dittus RS, Foss J, Wilkerson KS, Speroff T:Using real
time process measurements to reduce catheter-related bloodstream infec-tions in the intensive care unit.Qual Saf Health Care2005,14:295–302. 16. Higuera F, Rosenthal VD, Duarte P, Ruiz J, Franco G, Safdar N:The effect of
process control on the incidence of central venous catheter-associated bloodstream infections and mortality in intensive care units in Mexico.
Crit Care Med2005,33:2022–2027.
17. Marschall J, Mermel LA, Classen D, Arias KM, Podgorny K, Anderson DJ, Burstin H, Calfee DP, Coffin SE, Dubberke ER, Fraser V, Gerding DN, Griffin FA, Gross P, Kaye KS, Klompas M, Lo E, Nicolle L, Pegues DA, Perl TM, Saint S, Salgado CD, Weinstein RA, Wise R, Yokoe DS:Strategies to prevent central line-associated bloodstream infections in acute care hospitals.
Infect Control Hosp Epidemiol2008,29(Suppl 1):S22–S30.
18. National Nosocomial Infections Surveillance (NNIS) system report:data summary from October 1986-April 1998, issued June 1998.Am J Infect Control1998,26:522–533.
19. Apisarnthanarak A, Thongphubeth K, Yuekyen C, Warren DK, Fraser VJ: Effectiveness of a catheter-associated bloodstream infection bundle in a Thai tertiary care center: a 3-year study.Am J Infect Control2010,38:449–455. 20. Furuya EY, Dick A, Perencevich EN, Pogorzelska M, Goldmann D, Stone PW:
Central line bundle implementation in US intensive care units and impact on bloodstream infections.PLoS One2011,6:e15452.
21. Marik PE, Flemmer M, Harrison W:The risk of catheter-related bloodstream infection with femoral venous catheters as compared to sublclavian and internal jugular venous catheters: a systematic review of the literature and meta-analysis.Crit Care Med2012,40:2479–2485.
22. Paula AP, Oliveira PR, Miranda EP, Felix CS, Lorigados CB, Giovani AM, Lima AL:The long-term impact of a program to prevent central line-associated bloodstream infections in a surgical intensive care unit.Clinics
2012,67:969–970.
23. Robert J, Fridkin SK, Blumberg HM, Anderson B, White N, Ray SM, Chan J, Jarvis WR:The influence of the composition of nursing staff on primary bloodstream infection rates in a surgical intensive care unit.Infect Control Hosp Epidemiol2000,21:12–17.
24. Harris AD, Bradham DD, Baumgarten M, Zuckerman IH, Fink JC, Perencevich EN:The use and interpretation of quasi-experimental studies in infec-tious diseases.Clin Infect Dis2004,38:1586–1591.
doi:10.1186/2047-2994-2-33
Cite this article as:Cherifiet al.:A multicenter quasi-experimental study: