JIEM, 2015 – 8(2): 579-597 – Online ISSN: 2013-0953 – Print ISSN: 2013-8423 http://dx.doi.org/10.3926/jiem.3061406
An Index System for Financial Safety of China
XiaojunJia
1,2, MenggangLi
1,21
China Center for Industrial Security Research, Beijing Jiaotong University (China)
2
Beijing Center for Industrial Security and Development Research (China)
13810582343@163.com, morganli@vip.sina.com
Received: December 2014 Accepted: April 2015
Abstract:
Purpose:
This paper combines a synthetic index system by the variables and evaluates China’s
financial safety through the change of indexes in a comprehensive way. First of all, it builds the
financial industry evaluation index system composed of 25indicators in terms of the operation
of the financial industry and external economic environment and particularly takes into
consideration factors which might trigger liquidity risks such as off-balance-sheet business,
interbank business and shadow banking; then it selects 10 indicators to conduct empirical
analysis and identifies the indicator weight through principal component analysis; finally it
combines the financial safety indexes through the linear weighted comprehensive evaluation
model.
variables called principal components. PCA was invented in 1901 and was later independently
developed (and named) by Harold Hotelling in the 1930s.
Findings:
From 2003 to 2013 China’s financial safety indexes fluctuated. From 2003 to 2007
indexes rose, which indicates China’s financial safety status gradually improved; from 2007 to
2009 indexes declined, which indicates due to the impact of subprime crisis, China’s financial
safety status took a turn for the worse; from 2009 to 2012 indexes rose, which indicates the
external environment improved so did China’s financial safety status; from 2012 to 2013
indexes declined because due to the rapid development of banks’ financial products and trust
products, banks’ off-balance-sheet assets and liquidity risks increased. The changes of financial
safety indexes are generally identical with those of China’s financial safety status.
Research limitations/implications:
In the empirical analysis part, this article tries to
selective 24 indicators synthetic index of China's financial security, but due to some of the
indicators data acquisition is relatively difficult, can only Selective 10 of 25 indicators and
gather the annual data of 10 indicators from 2003 to 2013 to synthetic index. The information
of eliminated indicators cannot be reflected in the index. Index change also does not reflect of
the risk from these indicators. In order to make up for the above limitations, this paper is
mainly to introduce and analysis our latest financial institutions business trends associated with
these eliminated indicators to get the conclusions more reliable.
Originality/value:
The aim of this research is to estimate financial safety of China with the
application of the index of financial safety of a country using the annual data of 2003-2013.
Through synthetic index of financial security measure the risks of China's financial system,
provide the basis for the government macro financial policy. The Originality of the paper is
mainly manifested in incorporating factors which have made important impacts on China’s
financial safety in recent years, but have not been taken into consideration in the existing
studies into the newly constructed financial safety index system. For example, some factors that
cannot be controlled easily might have huge hidden risk hazards. To be more specific, factors
such as off-balance-sheet business, interbank business and shadow banking might trigger
liquidity risks. In this way, the research results will be more practical.
1. Introduction
Financial safety is key to a country’s economic safety because once financial crisis breaks out, it will be transmitted to the real economy and further threaten the national economic security. Since the 1990s financial crisis has broken out in Mexico, Asia, Russia, Brazil and America, doing great damage to the world economy and social development. How to accurately measure and evaluate a country’s financial safety in a comprehensive way or accurately conduct risk warning in order to prevent financial crisis has become the focus and most difficult part of world financial research. Particularly in 2007 subprime crisis broke out in America and then quickly spread to the whole world. Original evaluation and early-warning methods focusing on banking crisis and currency crisis were challenged and study on financial risks began to pay more attention to relevance and infectiousness inside the financial system and system risks. For China, on the one hand, systematic risks which might be triggered by internal factors such as China’s shadow banking system including trust companies and financial products, local government debts and real estate bubbles have constantly accumulated; on the other hand, with the constant improvement of RMB exchange rate formulation mechanism and implementation of financial reform measures such as accelerating market-oriented reform of interest rate, the financial industry has been increasingly opened up and the financial system has faced more and more risks of external impact. As a result, it is of great practical significance to select proper methods to measure financial safety and conduct scientific and comprehensive evaluation so as to prevent the outbreak of systematic crisis in time.
The remainder of the paper is divided into four sections. A review of the theoretical and empirical literature is provided in Section 2. Section 3 elaborates on the construction of the financial safety index system and the establishment of the evaluation model. Section 4 focuses on financial safety index synthesis and empirical analysis. The last section is devoted to conclusions and policy proposals.
2. Literature Review
There are three main methods used in the financial crisis early warning and comprehensive evaluation literature. The first one is early-warning models of financial crises, the second is a model to measure the contagious effects of financial risks among different financial areas, and the third is a synthetic index combined by the variables capturing all the key features of financial risks.
After the U.S. subprime mortgage crisis in 2007, systemic risk measure model of contagious effects of financial risks is widely used in the empirical studies, such as GARCH Model (Tim Bollerslev, 1986), the network approach, which tracks the reverberation of a credit event or liquidity squeeze throughout the financial system (IMF, 2009), CoVaR measure (Adrian & Bmnnermeier, 2008).
A synthetic index combined by the variables is an important tool to be applied to predict the likelihood of financial crises. Using statistical and econometric techniques, the variables are combined into a single index capturing all the key features of financial risks.
Compared with the former two methods, a synthetic index has the following advantages, such as simple, clear, operational flexibility, maintaining the continuity of the sequence, etc.
Financial stress index measure is the application of synthetic index method. Illingn and Liu (2003) first proposed the concept of financial stress and develop an index of financial stress called the financial stress index (FSI) for the Canadian financial system. Das, Iossifov, Podpiera and Rozhkovl (2005) develop multi-country indixes of financial system stress called the financial stress index and quality of financial policies called the index of quality of financial policies (IQFP) and use them in regression analysis of the determinants of financial stress. Moriyama (2010) develop the financial stress index of emerging market (EM) economies in the middle east and north Africa (MENA) to estimate spillover of the global crisis to MENA EM countries. Hakkio and Keeton (2009) combined 11 variables that capture the key characteristics of financial stress into a new index called the Kansas city financial stress index using principal component analysis. They suggest that policymakers will benefit from having a single comprehensive index to determine when financial stress is high enough to necessitate intervention and when the stress level has declined enough to warrant the unwinding of the special lending programs. Balakrishnan, Danninger, Elekdag and Tytell (2009) studies how financial stress, defined as periods of impaired financial intermediation, is transmitted from advanced to emerging economies using a new FSI for emerging economies. Cardarelli, Elekdag and Subir (2009) identifies episodes of financial turmoil using the FSI, and proposes an analytical framework to assess the impact of financial stress in particular banking distress on the real economy.
safety Index to measure the condition of China's current financial stability using the method of Principal Component Analysis. Hongbing and Jinmin (2014) constructs an aggregate financial stability index (AFSI) for China's financial system using the quarterly data of 2000Q1-2012Q3, and the AFSI is used to measure and predict the level of China's financial stability.
The aim of this research is to estimate financial safety of China with the application of the index of financial safety of a country using the annual data of 2003-2013. Its innovation is mainly manifested in incorporating factors which have made important impacts on China’s financial safety in recent years, but have not been taken into consideration in the existing studies into the newly constructed financial safety index system. For example, some factors that cannot be controlled easily might have huge hidden risk hazards. To be more specific, factors such as off-balance-sheet business, interbank business and shadow banking might trigger liquidity risks. In this way, the research results will be more practical.
3. Financial Safety Index Construction and Evaluation Model Establishment
3.1. Construction of the Financial Safety Evaluation Index System
Financial safety evaluation is to conduct quantitative analysis on the safety of the financial industry based on the current development status of the financial industry in order to objectively and accurately grasp the safety status of the financial industry. The financial safety evaluation index system is constructed based on the characteristics of the financial industry and existing domestic and foreign research.
3.1.1. Principles of Constructing the Financial Safety Index System
System principle: There are a lot of factors that might affect financial safety. On the one hand, we should focus on those factors inside the financial industry; on the other hand, we should also examine the external environment of the financial industry including and domestic and foreign factors.
Scientific principle: For indexes reflecting the financial operation and its robustness, use international and national official regulatory standards for reference, for example, Basel Agreement III and relevant regulations and indexes used by China Banking Regulatory Commission to monitor the risks of banking institutions.
regulation range, but have great impacts on the safety of the financial industry, for example, indexes related to off-balance-sheet business, interbank business and shadow banking business which have achieved a rapid growth in recent years.
Indexes should meet the requirements of quantitative analysis: Designed indexes should meet the requirements of quantitative analysis and meet the needs of finally calculating financial safety indexes.
3.1.2. Financial Safety and its Main Indicators for China
Different from real economy, products produced and operated in the financial industry are currency and negotiable securities, which characterized by high mobility and instability are more sensitive to domestic and foreign economic and policy fluctuation and more susceptible to impacts and risk factors. As a result, in constructing the first level indexes, the external economic environment of the financial industry and the operation of the financial industry should be taken into consideration.
External economic environment safety of the financial industry and its indicators:
Economic environment includes domestic and international environment while domestic environment encompasses macroeconomic operation and financial and policy environment.
Therefore, the following four indicators will be used to identify the states of macroeconomic operation: GDP growth rate, inflation rate, total fixed asset investment growth rate nationwide and registered urban unemployment rate.
Two indicators may therefore be useful in the financial and policy environment analysis: M2 year-on-year growth rate and ratio of off-balance-sheet assets in social financing structure.
Six indicators may therefore be useful in the international environment analysis:
• ratio of dependence on foreign trade (ratio of dependence on foreign trade= total volume of import and export of goods /GDP),
nominal exchange rate between the currency of one country and the currency of all trade partner countries).
Operation of the financial industry safety and its indicators:
Since the financial industry is characterized by high risks, high liquidity, unstability and high speculativeness, the financial industry operation indicators can be divided into operation status indicators and robustness indicators.
Seven indicators may be useful in the operation status analysis: total assets growth rate of banking institutions, credit balance/GDP, standard deviation of monthly interest rate in the inter-bank market, total assets growth rate of the insurance industry, total compensation growth rate of the insurance industry, stock market capitalization/GDP and Shanghai (Shenzhen) average price to earnings ratio.
Six indicators may be useful in the robustness status analysis: non-performing loan ratio of commercial banks, the proportion of commercial banks whose capital adequacy rate reaches 8%, NPL provisioning coverage ratio of commercial banks, the proportion of inter-bank assets to total assets in the banking industry, average return rate of use of exchange insurance funds and monthly standard deviation Shanghai (Shenzhen) stock market price index.
3.2. Synthesis of Financial Safety Indexes through the Linear Weighted Comprehensive Evaluation Model
Synthesis of indexes is made by constructing a proper comprehensive evaluation mathematical model, integrating a number of evaluation indexes into one comprehensive evaluation index and then obtaining corresponding comprehensive evaluation results. In this paper, we choose to synthesize financial safety indexes through the linear weighted comprehensive evaluation model. the procedures for model construction are as follows:
3.2.1. Samples Expressed in the Vector Form
Suppose the evaluation index set has n evaluation indexes (generally all these n indexes are not independent, but related to each other) and m samples. These m samples of n evaluation indexes can be expressed in the following vector form:
X(i) = (xi1, xi2 ... xim)T and (i = 1, 2,..., n) (1)
Select proper methods to weight n indexes and the weight vector can be expressed as:
3.2.2. Comprehensive Evaluation Model
Process primary data with various normalization methods and then construct the linear weighted comprehensive evaluation model with the processed data:
Index = y1w1 + y2w2 +... ynwn (3)
In the above formula, Index refers to the comprehensive evaluation value (numerical value); w is the weight; y is the standardized index values obtained by processing primary data with standardized methods.
Various weighting techniques are considered, including: principal component analysis (or factor analysis), analytic hierarchy process (AHP), variance-equal weights, etc.
Principal component analysis (PCA) is a statistical procedure that uses an orthogonal transformation to convert a set of observations of possibly correlated variables into a set of values of linearly uncorrelated variables called principal components. PCA was invented in 1901 and was later independently developed (and named) by Harold Hotelling (1933) in the 1930s. The results of a PCA are usually discussed in terms of component scores, sometimes called factor scores (the transformed variable values corresponding to a particular data point) and loadings (the weight by which each standardized original variable should be multiplied to get the component score). Often, its operation can be thought of as revealing the internal structure of the data in a way that best explains the variance in the data and also can avoid the subjective interference in the evaluation process.
Therefore, in this paper, the factors extracted from the large data set considered are obtained using principal components analysis.
4. Financial Safety Index Synthesis and Empirical Analysis
4.1. Data Selection and Processing
In this paper there are two procedures for processing primary data: positive processing and normalization processing.
4.1.1. Positive Processing of Data
loans and capital adequacy ratio. There are two kinds of negative indexes: those expressed in the form of percentage and those expressed in the form of numerical value(standard deviation). Indexes in percentage are positively processed with the formula: X* = 100% - X;
standard deviation indexes are positively processed with the formula: X* = 1/X, after the data
are positively processed, conduct normalization processing to all indexes.
4.1.2. Normalization Processing of Data
In this paper we conduct standardized processing to data with Z-score (zero-mean
normalization) method and the calculation formula: X✳
=(xσ−μ) , in which m refers to the mean
value of all sample data and s refers to the standard deviation of all sample data.
4.2. Principal Component Analysis
We have only gathered the annual data of some micro financial indexes from 2003 to 2013, namely, altogether 11 observed values. Given the degree of freedom of variable data, we can at most select 10 indexes. In this paper we select the following 10 variables (as shown in Table 1) from the constructed financial safety indicators and conduct principal component analysis with Stata 11 software.
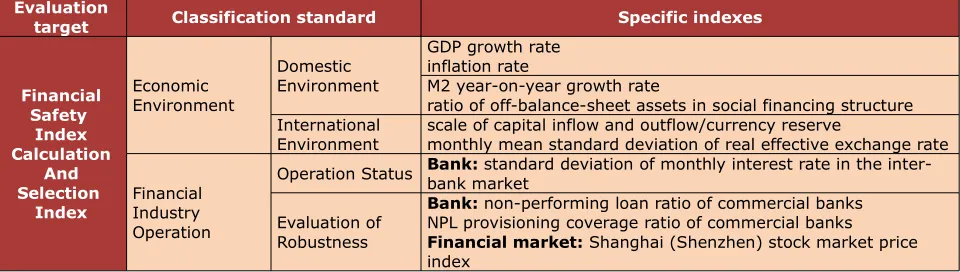
Evaluation
target Classification standard Specific indexes
Financial Safety Index Calculation And Selection Index Economic Environment Domestic Environment
GDP growth rate inflation rate
M2 year-on-year growth rate
ratio of off-balance-sheet assets in social financing structure International
Environment scale of capital inflow and outflow/currency reservemonthly mean standard deviation of real effective exchange rate
Financial Industry Operation
Operation Status Bank: standard deviation of monthly interest rate in the inter-bank market
Evaluation of Robustness
Bank: non-performing loan ratio of commercial banks NPL provisioning coverage ratio of commercial banks
Financial market: Shanghai (Shenzhen) stock market price index
Table 1. Variables Included in the Financial Safety Index
fifth one on, the change of eigenvalues tends to become steady. As a result, in this paper we select the first four principal components to replace the previous 10 indexes.
In addition, through the principal component analysis we can obtain the factor loading matrix in which the coefficient of the factor expression of all original variables indicates the degree of effect of the extracted common factors on original variables. The greater the absolute value of the factor loading is, the higher the correlation between common factors and original variables is and the more the obtained common factors can comprehensively reflect the information of original variables. It can be seen from the factor loading matrix in Table 3 that in principal component 1 the absolute values of load coefficients of non-performing loan ratio of commercial banks, ratio of off-balance-sheet assets in social financing structure, NPL provisioning coverage ratio of commercial banks, scale of capital inflow and outflow/currency reserves and monthly mean standard deviation of 7-day interbank offered rate are quite great, which indicates principal component 1 can comprehensively reflect these 5 indexes; in principal component 2 the absolute values of load coefficients of GDP growth rate and CPI are quite great, which indicates principal component 2 can comprehensively reflect these 2 indexes; in principal component 3 the absolute values of load coefficients of M2 growth rate and standard
deviation of the month-end indexes of the Shanghai composite index are quite great, which indicates principal component 3 can comprehensively reflect these 2 indexes; in principal component 4 the absolute value of load coefficient of the mean standard deviation of real effective exchange rate is quite great, which indicates principal component 4 mainly represents this index.
Component Eigenvalue Difference Proportion Cumulative
Comp1 4.0634 2.3143 0.4063 0.4063 Comp2 1.7491 0.1773 0.1749 0.5812 Comp3 1.5717 0.4915 0.1572 0.7384 Comp4 1.0802 0.3985 0.1080 0.8464 Comp5 0.6817 0.1443 0.0682 0.9146 Comp6 0.5374 0.3917 0.0537 0.9684 Comp7 0.1457 0.0227 0.0146 0.9829 Comp8 0.1230 0.0778 0.0123 0.9952 Comp9 0.0452 0.0426 0.0045 0.9997 Comp10 0.0026 0.0000 0.0003 1.0000
Figure 1. Principal Component Analysis Scree Plot
Index Comp1 Comp2 Comp3 Comp4
GDP growth rate -0.3526 0.6347 -0.6109 0.1095 CPI -0.3771 -0.6311 -0.1212 0.6188 M2 growth rate 0.3259 0.6303 0.6359 -0.0740 Scale of capital inflow and outflow/currency reserves 0.7239 0.0490 -0.3333 0.2381 Non-performing loan ratio of commercial banks 0.8889 -0.2503 -0.1954 -0.1128 Ratio of off-balance-sheet assets in social financing
structure -0.8569 -0.0559 -0.2249 -0.1020 NPL provisioning coverage ratio of commercial banks 0.8635 -0.3538 0.3143 -0.0126 Monthly mean standard deviation of real effective
exchange rate 0.3094 0.5739 0.1010 0.6670 Monthly mean standard deviation of 7-day interbank
offered rate -0.7227 0.0509 0.3133 -0.1758 Standard deviation of the month-end indexes of the
Shanghai composite index -0.5279 -0.1596 0.6103 0.3521
Table 3. First Four Principal Component loadings(unrotated) Matrix
After selecting principal components, principal components become the new indexes replacing original ones. Then we calculate the scores of four principal components in each year and based on the factor score coefficient matrix (as shown in Table 4) and the calculation formula is as follows:
f1 = -0.1749x1 - 0.1871x2 + 0.1617x3 + 0.3591x4 + 0.4410x5 - 0.4251x6 + 0.4284x7
+ 0.1535x8 - 0.3585x9 - 0.2619x10 (4)
f2 = 0.4799x1 - 0.4772x2 + 0.4766x3 + 0.0370x4 - 0.1892x5 - 0.0423x6 - 0.2675x7
f3 = - 0.4872x1 - 0.0967x2 + 0.5072x3 - 0.2659x4 - 0.1559x5 - 0.1794x6 + 0.2507x7
+ 0.0806x8 + 0.2499x9 + 0.4868x10 (6)
f4 = 0.1053x1 + 0.5954x2 - 0.0712x3 + 0.2291x4 - 0.1086x5 - 0.0981x6 - 0.0121x7
+ 0.6418x8 - 0.1691x9 + 0.3388x10 (7)
(x1 … x10 represent the 10 indexes obtained through normalization processing respectively).
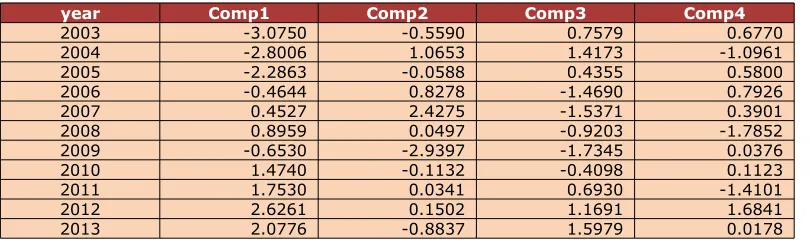
We calculate the scores of principal components from 2003 to 2013 and the calculation results are shown in Table 5. Figure 2 shows the change trend of the scores of the first four principal components from 2003 to 2013.
Index Comp1 Comp2 Comp3 Comp4
GDP growth rate -0.1749 0.4799 -0.4872 0.1053 CPI -0.1871 -0.4772 -0.0967 0.5954 M2 growth rate 0.1617 0.4766 0.5072 -0.0712 Scale of capital inflow and outflow/currency reserves 0.3591 0.0370 -0.2659 0.2291 Non-performing loan ratio of commercial banks 0.4410 -0.1892 -0.1559 -0.1086 Ratio of off-balance-sheet assets in social financing
structure -0.4251 -0.0423 -0.1794 -0.0981 NPL provisioning coverage ratio of commercial banks 0.4284 -0.2675 0.2507 -0.0121 Monthly mean standard deviation of real effective
exchange rate 0.1535 0.4339 0.0806 0.6418 Monthly mean standard deviation of 7-day interbank
offered rate -0.3585 0.0385 0.2499 -0.1691 Standard deviation of the month-end indexes of the
Shanghai composite index -0.2619 -0.1207 0.4868 0.3388
Table 4. First Four Principal Component eigenvectors
year Comp1 Comp2 Comp3 Comp4
2003 -3.0750 -0.5590 0.7579 0.6770 2004 -2.8006 1.0653 1.4173 -1.0961 2005 -2.2863 -0.0588 0.4355 0.5800 2006 -0.4644 0.8278 -1.4690 0.7926 2007 0.4527 2.4275 -1.5371 0.3901 2008 0.8959 0.0497 -0.9203 -1.7852 2009 -0.6530 -2.9397 -1.7345 0.0376 2010 1.4740 -0.1132 -0.4098 0.1123 2011 1.7530 0.0341 0.6930 -1.4101 2012 2.6261 0.1502 1.1691 1.6841 2013 2.0776 -0.8837 1.5979 0.0178
Table 5. First Four Principal Component Factor Score Table
Then with the calculated scores of the first 4 principal components and through the weighted average calculation, we obtain the comprehensive evaluation score of these 4 principal components in each year which is represented by F. The weight is the principal component variance contribution rate. Then the calculation formula is as follows:
F = w1f1 + w2f2 + w3f3 + w4f4 (8)
in which w1, w2, w3, w4, f1, f2, f3, f4 are the variance contribution rates of the first 4 principal
After the comprehensive evaluation score is calculated, based on the expression habit of indexes, we map the calculated F value into the [0 100] interval and then obtain financial
safety indexes. The conversion formula is as follows: index = (F−MinF)
(MaxF−MinF) , in which MaxF
and MinF represent the maximum value and minimum value of the comprehensive evaluation score.
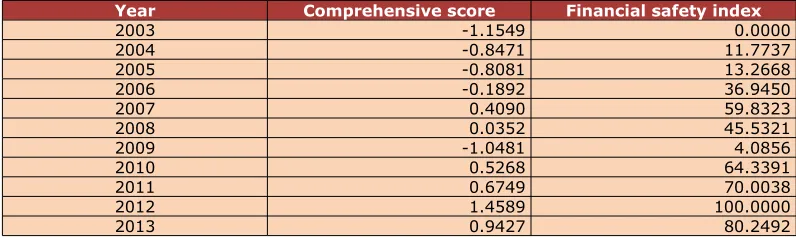
The calculated results of the comprehensive evaluation scores and financial safety indexes in each year are shown in Table 6.
Year Comprehensive score Financial safety index
2003 -1.1549 0.0000
2004 -0.8471 11.7737
2005 -0.8081 13.2668
2006 -0.1892 36.9450
2007 0.4090 59.8323
2008 0.0352 45.5321
2009 -1.0481 4.0856
2010 0.5268 64.3391
2011 0.6749 70.0038
2012 1.4589 100.0000
2013 0.9427 80.2492
Table 6. Principal Component Analysis Comprehensive Score and Financial Safety Indexes
Figure 3. Financial Safety Index Change Trend (2003-2013)
In the second stage, the indexes plummet, which indicates during this period China’s financial safety status took a turn for the worse and in 2009 it dropped to the bottom. It is mainly because in the second half of 2007 subprime crisis broke out in America and then quickly spread to the whole world in 2008. Due to the financial crisis, the world financial system lacked confidence and the financial market’s fluctuation intensified. In 2008 the world economic growth rate dropped by 1.78% as compared with 2007 (see CBRC 2008 Annual Report). China’s economy also withstood severe tests of the financial crisis in 2008 and 2009. First of all, it had a negative impact on China’s foreign trade import and export. In 2008 the annual total import and export volume of goods was $ 2,561.6 billion and month-on-month growth rate of import and export volume of goods dropped from 23.5% in 2007 to 17.8%. In 2009 the annual total import and export volume of goods was $ 2,207.2 billion, down 13.9% year on year: the export volume of goods was $ 1,201.7 billion, down 16.0%; the import volume of goods was $ 1,005.6 billion, down 11.2%. Gap between imports and exports (exports minus imports) was $ 196.1 billion, decreasing by $ 102 billion year on year (Statistical Communique of the People’s Republic of China on the 2009 National Economic and Social Development). In addition, the financial crisis resulted in falling domestic demand. In 2009 CPI dropped by 0.7%. Due to the decline of foreign trade and insufficient domestic demand, GDP growth rate dropped from 14.2% in 2007 to 9.6% in 2008 and then to 9.2% in 2009. Judging from Shanghai Composite Index, Shenzhen Composite Index and fluctuation of real effective exchange rate, the fluctuation range climaxed in 2008 and then began to decline in 2009, which indicates due to the impact of the financial crisis, during this period China’s exchange rate of imports and exports and stock market fluctuated significantly. In addition, in 2009 China implemented the loose monetary policy. At the end of 2009 M2 and M1 grew by 27.7% and 32.4% respectively, both being the highest growth since 1996 and 1993 respectively. The annual new RMB loans reached RMB 9.59 trillion, increasing by RMB 4.69 trillion or 31.7% year on year, the highest since 1985. The credit support for economic development was quite great. The monetary aggregate grew rapidly; monetary liquidity continuously strengthened; financial risked increased.
In the third stage indexes present the rising tendency, which indicates from 2009 to 2012 China’s financial safety status constantly improved. In 2009 the world economy gradually recovered. As a result, China’s external environment also took a turn for the better and economy restored its balanced and rapid development. In 2010 GDP growth rate reached 10.4%. During this period macro economy performed quite well while in terms of micro economy non-performing loan ratio of commercial banks continued to decrease and NPL provisioning coverage ratio of commercial banks continued to increase.
maximum in June reached 12.25% and the interest rate volatility increased. On the other hand, due to the rapid development of banks’ financial products and trust products, off-balance-sheet assets and liquidity risks increased.
It can be seen from the above analysis that the changes of financial safety indexes are generally identical with those of China’s financial safety status, which proves the financial safety indexes calculated in this paper can well reflect the actual situation of China’s basic financial safety status. On the other hand, based on the changes of the calculated indexes, we can make targeted measures to deal with risks and guard against and defuse financial risks so as to provide empirical support for financial institutions’ risk management and control and financial supervision departments’ effective supervision.
5. Conclusion and Policy Proposals
5.1. Conclusion
Empirical results indicate: from 2003 to 2013 China’s financial safety indexes fluctuated. From 2003 to 2007 indexes rose, which indicates China’s financial safety status gradually improved; from 2007 to 2009 indexes declined, which indicates due to the impact of subprime crisis, China’s financial safety status took a turn for the worse; from 2009 to 2012 indexes rose, which indicates the external environment improved so did China’s financial safety status; from 2012 to 2013 indexes declined because due to the rapid development of banks’ financial products and trust products, banks’ off-balance-sheet assets and liquidity risks increased. The changes of financial safety indexes are generally identical with those of China’s financial safety status.
5.2. Policy Proposals
5.2.1. Make Laws, Rules and Regulations Related to Comprehensive Management of the Financial Industry as Soon as Possible
At present in China comprehensive management has formed a certain scale and there has emerged a lot of new forms. Comprehensive management will result in more financial risk factors interweaving and interpenetrating. It will be hard for financial institutions lacking the ability to control risks to effectively guard against potential risks. Therefore, it is urgent that there must be laws to abide by and supervision should be executed according to the laws. In developed countries only after relevant laws, rules and regulations are made will the comprehensive management mode be implemented in the financial industry. However, in order to implement comprehensive management in the legal framework of separate operation at present in China, the Chinese government should make laws, rules and regulations related to comprehensive management of the financial industry as soon as possible.
5.2.2. Strengthen the Systematicness and Sustainability of Financial Supervision and Constantly Improve Regulatory Means and Technologies
Strengthen the supervision of off-balance-sheet business; constantly improve regulatory means and technologies; with consolidated supervision as the core, establish the comprehensive risk monitoring system covering financial institutions’ on-balance-sheet and off-balance-sheet businesses; strengthen macro prudential regulation of systematic risks; in terms of capital, liquidity and risk management, make stricter requirements for large institutions of comprehensive management.
With the emerging of innovations of Internet finance, the People’s Bank of China should also change its supervision mentality and way and constantly improve regulatory means and technologies.
5.2.3. Perfect the Financial Supervision and Coordination Mechanism and Strengthen the Financial Supervision and Management Ability
Off-balance-sheet business, interbank business and shadow banking are the main factors that might trigger liquidity risks currently in China. In the future we should perfect financial supervision and coordination mechanism, enhance financial supervision ability and strengthen the cross-border supervision over off-balance-sheet business, interbank business and shadow banking to promote the standardization development of the emerging financial industry.
References
Adrian, T., & Bmnnermeier, M.K. (2009). CoVaR. Paper Presented at the CEPR/ESI 13th Annual Conference on Financial Supervision in an Uncertain World on 25-26 September 2009 in Venice. Staff Report 348, Federal Reserve Bank of New York.
http://dx.doi.org/10.2139/ssrn.1269446
Balakrishnan, R., Danninger, S., Elekdag, S., & Tytell, I. (2009). The Transmission of Financial Stress from Advanced to Emerging Economies. IMF Working Paper, No.133. Available online in: http://www.imf.org/external/pubs/ft/weo/2009/01/pdf/c4.pdf
Bollerslev, T. (1986). Generalized autoregressive conditional heteroskedasticity. Journal of Econometrics, 31, 307-327. North-Holland. http://dx.doi.org/10.1016/0304-4076(86)90063-1
Cardarelli, R., Elekdag, S., & Subir, L. (2009). Financial Stress, Downturns, and Recoveries. IMF Working Paper, No. 100. Available online in:
http://www.imf.org/external/pubs/ft/wp/2009/wp09100.pdf
Das, U.S., Iossifov, P., Podpiera, R., & Rozhkovl, D. (2005). Quality of Financial Policies and Financial System Stress. IMF Working Paper, WP/05/173.
http://dx.doi.org/10.5089/9781451861921.001
Dexu, H., & Feng, L. (2011). The Measurement and Analysis of Index of China's Financial Stability. Journal of Graduate School of Chinese Academy of Social Sciences, April, 16-25. Available online in: http://www.cnki.net/KCMS/detail/detail.aspx?QueryID
Frankel, J.A., & Andrew, K.R. (1996). Currency Crashes in Emerging Markets: An Empirical Treatment. Journal of International Economics, 3, 351-366. http://dx.doi.org/10.1016/S0022-1996(96)01441-9
Hakkio, C.S., & Keeton, W.R. (2009). Financial Stress: What Is It, How Can It Be Measured, and Why Does It Matter?. Economic Review, Federal Reserve Bank of Kansas City, Second Quarter, 5-50. Available online in:
Hongbing, G., & Jinmin, D. (2014). The Construction and Application of China's Aggregate Financial Stability Index (AFSI) and Its Policy Implications. Journal of Finance and Economics, January, 59-65. Available online in: http://www.cnki.net/KCMS/detail/detail.aspx?QueryID
Hotelling, H. (1933). Analysis of a complex of statistical variables into principal components. Journal of Educational Psychology, 24, 417-441 and 498-520. http://dx.doi.org/10.1037/h0071325
Illing, M., & Liu, Y. (2003). An Index of Financial Stress for Canada. Bank of Canada Working Paper. Available online in: https://ideas.repec.org/p/bca/bocawp/03-14.html
IMF (2009). Global Financial Stability Report: Responding to the Financial Crisis and Measuring Systemic Risk. Available online in: http://www.imf.org/external/pubs/ft/gfsr/2009/01/
Kaminsky, G.L., Lizondo, J.S., & Reinhart, C.M. (1998). Leading Indicators of Currency Crises. Staff Papers of International Monetary Fund, 45(1), 1-48. http://dx.doi.org/10.2307/3867328
Matkovskyy, R. (2012). The Index of the Financial Safety (IFS) of South Africa and Bayesian Estimates for IFS Vector-Autoregressive Model. RePeC Working Paper. Available online in: http://mpra.ub.uni-muenchen.de/42173/1/MPRA_paper_42173.pdf
Matkovskyy, R. (2013). To the Problem of Financial Safety Estimation: The Index of Financial S a f e t y o f T u r k e y. M P R A _ p a p e r _ 4 7 6 7 3 . Ava i l a b l e o n l i n e i n : http://mpra.ub.uni-muenchen.de/47673/1/MPRA_paper_47673.pdf
Moriyama, K. (2010). The Spillover Effects of the Global Crisis on Economic Activity in MENA Emerging Market Countries-An Analysis Using the Financial Stress Index. IMF Working Paper, No.8. http://dx.doi.org/10.5089/9781451961867.001
Sachs, J., Tornell, A., & Velasco, A. (1996). Financial Crises in Emerging Markets: The Lessons from 1995. NBER Working Paper No. 5576. http://dx.doi.org/10.2307/2534648
Zhang, J. (2012). A Research of Systemic Financial Risk Assessment based on Financial Risk Stress Indicators. The Shanghai Financial, September, 53-57. Available online in: http://www.cnki.net/KCMS/detail/detail.aspx?QueryID
Journal of Industrial Engineering and Management, 2015 (www.jiem.org)
Article's contents are provided on a Attribution-Non Commercial 3.0 Creative commons license. Readers are allowed to copy, distribute and communicate article's contents, provided the author's and Journal of Industrial Engineering and Management's names are included.