Issues
ISSN: 2146-4138
available at http: www.econjournals.com
International Journal of Economics and Financial Issues, 2016, 6(S1) 14-18.
Special Issue for “Theory and Practice of Organizational and Economic Problems of Territorial Development and the Effectiveness of Social and Economic Systems”
Basics of Modeling the Probability of Corporate Borrowers’ Default
Alexander S. Ksenofontov
1, Igor V. Savon
2, Vladimir Y. Serba
3, Dmitry V. Shkurkin
4*
1Kabardino-Balkaria State University Named after H.M. Berbekov, Nalchik, Russian Federation, 2Polytechnic Institute Branch of
Don State Technical University in Tganrog, Taganrog, Russian Federation, 3General Khrulev Military Academy of Logistics and
Procurement, Saint Petersburg, Russian Federation, 4Limited Liability Company “ELDirect”, Nevinnomyssk, Russian Federation.
*Email: [email protected]
ABSTRACT
The paper has developed a set of evaluation models of the probability of corporate borrowers’ default, taking into account the macroeconomic and institutional factors on the example of the Russian construction industry companies. At the beginning of 2014, the lending volume of non-financial organizations was about 56% of the loan portfolio value and 39% of the value of the Russian banks’ assets. The paper has given a comparative analysis of approaches to modeling the probability of default and credit risk level, the results of which were used for the classification of the existing evaluation models of the probability of default, analyzing the advantages and disadvantages of each model class, including the degree of applicability for the Russian practice. The most risk-dominant figures, application of which allows to get more relevant models in the multi-factor analysis, were studied, and this helps create the relevant methodology of social development. Having been systematized and structured, various methodological aspects of estimation the probability of default helped form a complex attitude to the estimation methods of the probability of default, taking into account the advantages and disadvantages of these methods and the degree of their applicability for the Russian practice.
Keywords: Default, Risk-dominant Figures, Macroeconomics, Corporate Lending JEL Classifications: D81, G32
1. INTRODUCTION
Timely and reliable evaluation of the default risk level of corporate borrowers is essential both in stability of the Russian banking sector and the entire financial system. At the same time, non-financial organization crediting dominates in the loan portfolio structure of the Russian banks. Despite the fact that a share of overdue debt in the corporate loan portfolio is decreasing in recent times, the unstable recent economic situation may negatively influence the present tendency and cause the financial system instability (Pomazanov and Kolokolova 2004, Osadchy and Akhmetshin 2015).
At the same time, the number of researches and evaluation models of the probability of default for the Russian corporate crediting sector is quite restricted because of the statistic date limitation, this market segment limitation, the institutional and legislative
barriers, which weaken the predictive power of the market signals (Pomazanov and Petrov 2008, Prokhno and Luneva 2004). Using the instruments based on the foreign data and markets does not always produce relevant results because there is no attention paid to the distinctive features of the Russian institutional and financial environment (Sheremet, 2003, Altman, 1968, Altman, 2003, Alves, 2005), that makes seek new means and forms (Chuev et al., 2016, Karepova et al., 2015).
2. MATERIALS AND METHODS
The multi-factor modeling of the probability of default of construction industry companies supposes to implement the following main stages:
1. Analysis of outliers and data normalization.
3. Selection of the most risk-dominant financial figures using the following methods:
• Method 1: Using statistical tests to determine the most descriptive variables.
• Method 2: Selection of the optimal combination of factors in terms of the model quality based on the phase-including figures from each class.
• Method 3: Selection of the factors based on the single-factor coefficient accuracy ratio (AR) and receiver operating characteristic (ROC)-curves.
4. Proving the hypothesis on the macroeconomic factors’ importance.
5. Proving the hypothesis on the institutional factors’ importance. 6. Checking the functional form correlation of the factors which
explain the model.
7. Quality assurance test of the final model and the comparative analysis of the obtained results. In this paper the multi-factor evaluation model of the probability of default is based on the binary choice models.
Financial, macroeconomic and institutional figures were used as a vector of explanatory variables.
Calculations were made using such programs as EViews and MedCalc. Further, we will describe each of the stages in more detail and present the results.
Thus, it is necessary to select such figures that are highly able to divide companies into “non-default” and potentially “default” ones. To solve this problem this paper suggests using the three possible methods.
3. RESULTS
A number of figures can be characterized by too high or low sub-selection values with regard to the total mean sub-selection figure value as a whole, which may be explained by a significant number of selection outliers (Vasilev et al., 2013).
To reduce the impact of each sub-selection outliers the paper suggests using the Chebyshev’ equation.
The Spearman’s coefficient takes a value from −1 to 1. The coefficient which value is equal to 1 means that there is a strong direct linear correlation between figures and the coefficient which is equal to −1 indicates that there is a strong inverse correlation. The analysis results of the Spearman’s correlations for the considered financial figures show that the closest correlation is typical for the return on assets and net profit indexes: Figures’ correlation is 79% and balance sheet total and capital figures, the correlation of which is 72%.
It is also important to analyze the correlation level of the selected macroeconomic figures. This analysis is essential for proving the hypothesis that macroeconomic figures are highly correlated and for eliminating the data multicollinearity.
The correlation analysis results show that the oil price has the closest correlation that is the correlation with 92% of imports, 97% of exports, and 94% of nominal gross domestic product (GDP). Moreover, these figures are highly correlated with each other: Exports and imports are 99%, import and nominal GDP are 98%, and nominal GDP and exports are 98%. These results indicate the high importance of oil price index in terms of influence on the value of other macro parameters and general trends in the Russian economy. Inflation rates also show a high correlation between each other:
The producer price index and the GDP deflator have a correlation coefficient equal to 73%. The producer price index is also highly correlated with the capital inflow/outflow index, and their correlation coefficient is 76%.
The Spearman’s correlation analysis for observations on selected institutional figures (regional and legal-organizational form property) have not determined a high correlation between them because the correlation coefficient is less than 30%.
As a result, the multi-factor regression analysis does not suggest using a combination of figures with the correlation coefficient more than 70%. It is done for eliminating the effect of multicollinearity and high correlation between the considered figures.
The selection of financial figures based on statistical tests to identify the most risk-dominant figures (Method 1).
To analyze and identify the most risk-dominant figures in the Eviews v.7 pack, the following tests were done to prove the hypothesis on the equality of two independent selections’ means of default and non-default companies’ figures:
• Student’s t-test
• Satterthwaite-Welch test (an analogue of the Student’s t-test for the case of unequal variances)
• ANOVA test • Welch test.
The results of testing for the averages congruence (Table 1) have showed that for such figures as:
• Balance sheet total • Profitability of sales • Profitability of outlay
• Economic security provided by current assets • Stocks’ ratio in current assets
• Return on assets
• Equity to total assets ratio.
At the level of significance of 5% the hypothesis on the averages congruence of sub-selection default and non-default observations is discarded that shows high descriptive ability of the figures. As a result, for the further analysis within the first method the paper offers to use these figures.
model quality by stage-by-stage inclusion of the figures from each class (Method 2).
Within the second method there was the optimal combination of the figures on the basis of stage-by-stage inclusion of the figures from each class of the financial figures. Figure 1 presents the selective results of the stage-by-stage selection of the figures within the second approach. This and other Tables below, which do not point the opposite, present the values of regression coefficients and determination coefficients of the corresponding models. The brackets present the p-values characterizing the importance of the selected figures. Regression models of a binary choice were constructed under using the EViews pack.
As a result, the largest value of the determination coefficient (of 28%) and the importance of coefficients at the level of 5% were observed for the following set of the figures: The net profit, the profitability of sales, the average turn period of debit indebtedness, the equity to total assets ratio.
The selection of financial figures on the basis of the analysis of single-factor ROC-curves and AR coefficients (Method 3). Further, there are the most risk - dominant financial figures by conducting the ROC-analysis for each factor individually (ROC analysis) and the AR coefficients calculation selected.
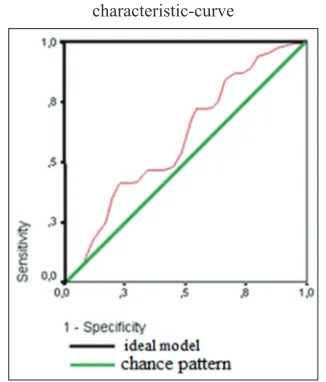
The ROC-curve allows to estimate power of the obtained model and reflects the dependence of the quantity of correctly classified positive cases on the quantity of falsely classified ones. The graph of the ROC-curve is usually added with the half line at an angle of 45°, the aboutness to it shows the poor model quality. The graph of the ideal model is in the left upper corner. Figure 1 presents the assembled representation of the ROC-curve.
The assembled representation of the ROC-curve is as follows: “The values of sensitivity and specificity are calculated for each value of the cutoff threshold which changes from 0 to 1 with a certain step (for example, each subsequent value in the selection).”
As a result, there is the graph for the following dependence constructed: Sensitivity is plotted along the Y-axis (Se), the value of 100% - Sp is plotted along the X-axis, where Sp - is the model specificity.
4. DISCUSSION
Considering the above, the value of the AR coefficient and the ROC-curve is the most indicative characteristic of the binary model quality. Let’s define these concepts: Sensitivity represents a share of truly positive outcomes. The values of the AR coefficient for the model constructed on the first approach and for the model constructed on the second approach are respectively 82% and 86% that shows the high quality of final models.
Specificity represents a share of correctly classified negative cases. Selection of the most risk - dominant figures can be obtained from Gini single-factor coefficients’ calculation (for each of the considered financial figures) which is also known as the AR.
Figure 1: The assembled representation of the receiver operating characteristic-curve
Table 1: The results of testing for the averages congruence of sub‑selection default and non‑default financial figures
Figure denomination t-test Satterthwaite-
Welch t-test Anova F-test Welch F-test Conclusion
Balance sheet total 0.0347 0.0017 0.0347 0.0017 The hypothesis on the averages congruence is discarded Capital 0.1223 0.0003 0.1223 0.0003 The hypothesis on the averages congruence is not discarded Net assets aggregate 0 0.0659 0 0.0659 The hypothesis on the averages congruence is not discarded Net profit 0 0.2039 0 0.2039 The hypothesis on the averages congruence is not discarded Profitability of sales 0 0.0039 0 0.0039 The hypothesis on the averages congruence is discarded Profitability of outlay 0 0 0 0 The hypothesis on the averages congruence is discarded Return on equity 0.4199 0.2188 0.4199 0.2188 The hypothesis on the averages congruence is not discarded Asset turnover 0.6108 0.3785 0.6108 0.3785 The hypothesis on the averages congruence is not discarded Own capital turnover 0.7215 0.5507 0.7215 0.5507 The hypothesis on the averages congruence is not discarded The average turn period of
debit indebtedness 0.0162 0.1666 0.0162 0.1666 The hypothesis on the averages congruence is not discarded
Stocks’ ratio in current assets 0 0 0 0 The hypothesis on the averages congruence is not discarded Economic security provided
Risk, namely, uncertainty and unpredictability of the results of crop-growing activity in the areas of risk agriculture is much higher than in other sectors of the agro-industrial complex (Caprio and College, 2009). Nowadays the relevance of the subject devoted to risks in the agro-industrial complex is realized not only in scientific communities but also among businessmen and government institutions. Contrary to popular opinion that the main purpose is to find means for expenditures with a long cycle of assimilation. The native and foreign experience testifies that the most important thing is their most effective application on the basis of reliable forecasting.
Economic risk is the permanent feature of real economic decisions (Totmyanina, 2011, The Federal Law). The main feature of modern risk is its total and comprehensive character (Basel Committee on Banking Supervision, 1999; 2004; 2005; 2006; 2009; 2011). There is the serious question concerning management of risks in the regions of risk agriculture. The features and approved methods of management of risks in economics are insufficiently studied because of the underdevelopment of market relations, poor staff special training, because there are no statistical data allowing to build economic and mathematical models, and, at last, because the modern theory of assessment of a measure of economic risks, forecasting and management over them is still inadequate to real requirements of practical management (Sozinova et al., 2016).
5. CONCLUSION
All considered approaches have proved the importance of the macroeconomic figure of the producer price index and have not proved the importance of the considered institutional features. Stocks’ ratio in current assets characterizes a share of stocks in current assets of the construction industry company and is the characteristic of the common structure of assets. From the point of view of the comprehensive basis of accounting, the basic elements of stocks are raw materials and supplies, goods in process, finished manufactures in warehouses and other elements. Thus, the basic element of stocks of the construction companies is stocks of building structures and materials, unfinished construction operations. From the point of view of a type of the dependence, it should be noted that the significant increase of this figure testifies to the restructuring of current assets to the good of less liquid sources in comparison with others as, for example, monetary mans that can reflect adversely on the company borrowing power. This hypothesis is also confirmed by the results of parameterization - This figure has included with a positive sign and gives the best results at its inclusion in a quadric form. Profitability of outlay characterizes the enterprise’s activity efficiency from the point of view of the obtained units of the net profit per unit of expenditures incurred. The importance of this figure for the construction industry companies can be connected with the fact that the construction business is very cost- and resource- intensive. Thus, the issue of how much each unit of their expenditures incurred gets regained out of earned profit is of great importance for the construction companies. Thus, this figure characterizes the matter of how much the construction company
keeps an eye on a cost of production of realized operations and services, and how much an actual cost of the construction industry company realized production was considered in price setting. Considering the obtained results, it is clear that this figure is significant from the point of view of assessment of the probability of default of the construction industry companies and has included into the model with a negative sign: Namely, the higher a value of the figure, the lower the company default probability.
Equity to total assets ratio characterizes the company financial sovereignty from the point of view of a fair share of its own means in the structure of the enterprise total capital.
Analyzing this figure, it should be considered that the construction business is characterized by a long-term production cycle and also is very cost- and resource- intensive. Thus, the construction industry enterprise, having in the capital structure only its own capital, has a sufficiently high level of financial stability in short-term prospects, but moreover limits the rates of its development in long-term prospects (owing to the lack of the business expansion possibility using the borrowed capital). Following the results of the previous multiple-factor analysis, the data on the Russian construction industry companies shows that the increased indicator reduces the probability of default that demonstrates a sufficient share of the borrowed capital in the structure of the total capital for this sector.
Profitability of sales characterizes the matter how much the company activity profitable. This coefficient shows how many units of the net profit each unit of sold products of the company returns. The level of the profitability of sales for the construction industry companies can be caused both by extensive factors connected generally with the volume of the realized operations and intensive factors connected generally with a cost of operations and price setting. Following the results of the previous multiple-factor analysis, the profitability of sales was included into the model with a negative sign, namely, the increased indicator reduces the probability of default of the Russian construction industry companies.
Among absolute figures the net profit has the greatest importance for assessment of the probability of default of the Russian construction industry companies. The profit is the most important general financial figure which characterizes the financial result of the company activity and is more often analyzed both by financial analysts and investors. Following the results of the previous multiple-factor analysis, the profit was included into the second model with a negative sign and in a quadric form, namely, the increased indicator reduces the probability of default of the Russian construction companies.
figure of the average turn period of debit indebtedness has included into the model with a positive sign, namely, the increased figure causes the high default probability of the company.
Analyzing important macro-figures, one of them for both models is the producer price index. The figure shows the mean level in changing prices for raw materials, supplies and goods for intermediate consumption relative to the base period. The previous results show that the figure has included into both models with a negative sign, namely, the higher the indicator, the lower the probability of default of the construction industry companies. It should be also noted that the results of the correlation dependence analysis shows that this index is characterized by a highness of correlation with another figure of inflation - the GDP deflator (Spearman correlation coefficient is equal to 73%). Thus, it can be assumed that a negative correlation sign with the probability of default is connected with the fact that most of observations were made in times of economic growth, which in most cases are characterized by the increased business activity of the enterprises and the growing inflation rate.
As a result, for all approaches to selection of risk - dominant financial figures the best results (the highest coefficient of determination and the importance of the chosen figures at the level of 5%) were observed at the macroeconomic figure of the producer price index inclusion into the model.
The analysis of ROC-curves and AR coefficients for the considered macroeconomic figures has also confirmed the high risk-significance of this figure for the considered selections. As compared to other macroeconomic figures, this figure has the highest AR value.
The obtained results allow to make a conclusion that the model constructed on the basis of statistical selection of factors shows the similar results from the point of view of default cases prediction and the worst ones from the point of view of default cases prediction as compared to the model constructed on the basis of stage-by-stage inclusion of variables. An ability to identify no defaults rather than default cases is in general the characteristic of this class of models It is partially caused by the fact that the models were constructed on the basis of the selection where the number of the non- default companies is greater than the number of default ones (according to the ratio 3 to 1).
REFERENCES
Altman, E.I. (1968), Financial rations. Discriminant analysis, and the prediction of corporate bankruptcy. Journal of Finance, 23, 189-209. Altman, E.I. (2003), Managing credit risk: A challenge for the new
millennium. Economic Notes, 31, 201-214.
Alves, I. (2005), Sectorial fragility: Factors and dynamics. BIS Working Paper, 2, 80-450.
Basel Committee on Banking Supervision. (1999), A New Basel Capital Adequacy Framework. Available from: http://www.bis.org.
Basel Committee on Banking Supervision. (2005), An Explanatory Note on the Basel II IRB Risk Weight Function. Available from: http:// www.bis.org.
Basel Committee on Banking Supervision. (1999), Credit Risk Modeling: Current Practices and Applications. Available from: http://www.bis. org/publ/bcbs49.htm.
Basel Committee on Banking Supervision. (2004), Implementation of Basel II: Practical Considerations. Available from: http://www.bis. org/publ/bcbs109.htm.
Basel Committee on Banking Supervision. (2004), International Convergence of Capital Measurement and Capital Standards. Available from: http://www.bis.org.
Basel Committee on Banking Supervision. (2006), International Convergence of Capital Measurement and Capital Standards. Comprehensive Version. Available from: http://www.bis.org. Basel Committee on Banking Supervision. (2011), International
Regulatory Framework for Banks. Available from: http://www.bis. org.
Basel Committee on Banking Supervision. (2009), Proposed Enhancements to the Basel II Framework. Available from: http://www.bis.org. Caprio, G., College, W. (2009), Financial Regulation in a Changing World:
Lessons from the Recent Crisis. Available from: https://www.tcd.ie/ Economics/assets/pdf/Regulation_in_a_World_of_Cha.
Chuev, I.N., Panchenko, T.M., Novikov, V.S., Konnova, O.A., Iraeva, N.G., Karabulatova I.S. (2016), Innovation and integrated structures of the innovations in modern Russia. International Review of Management and Marketing, 6(1S), 239-244.
Karepova, S.G., Karabulatova, I.S., Novikov, V.S., Klemovitsky, S.V., Stratan, D.I., Perova, A.E. (2015), New approaches to the development of methodology of strategic community planning. In the: Mediterranean Journal of Social Science, 6(3S6), 357-364. Osadchy, E.A., Akhmetshin, E.M. (2015), Accounting and control of
indirect costs of organization as a condition of optimizing its financial and economic activities. International Business Management, 9(7), 1705-1709.
Pomazanov, M., Kolokolova, O. (2004), Developing of the formula of the company bankruptcy probability on the basis of financial accounts. Operational Management and Strategic Management in the Commercial Bank, 6, 65-84.
Pomazanov, M.V., Petrov, D.A. (2008), Credit risk - Management as the instrument of the fight against toxic assets. Bank Crediting, 6. Prokhno, Y.P., Luneva, Y.V. (2004), Problems of assessment of
commercial banks’ corporate borrowers creditworthiness. Finance and Credit, 5, 38-51.
Sheremet, A.D. (2003), Financial Analysis Technique. Moscow: INFRA-M. p485.
Sozinova, A.A., Androsova, I.V., Аbramov, V.L., Tikhomirov, E.A., Redin, D.V., Oganesyan, T.L. (2016), Formation of the new forms of management systems spatially localized economies in the paradigm of the cluster approach. International Review of Management and Marketing, 6(S1), 250-254.
The Federal Law “On insolvency (bankruptcy).” Available from: http:// www.consultant.ru.
Totmyanina, K.M. (2011), Assessment of the probability of default of industrial organizations on the basis of the financial figures. Financial Analytics: Problems and Decisions, 11(53), 59-68.