http://dx.doi.org/10.3926/jiem.699
- 320 -
A train dispatching model based on fuzzy passenger demand
forecasting during holidays
Fei Dou
1,2, Jie Xu
2, Li Wang
1,2, Limin Jia
21
State Key Laboratory of Rail Traffic Control and Safety, Beijing Jiaotong University,
2
School of Traffic and Transportation Beijing Jiaotong University (China)
[email protected], [email protected],
[email protected], [email protected]
Received: October 2012 Accepted: March 2013
Abstract:
Purpose:
The train dispatching is a crucial issue in the train operation adjustment when
passenger flow outbursts. During holidays, the train dispatching is to meet passenger demand
to the greatest extent, and ensure safety, speediness and punctuality of the train operation. In
this paper, a fuzzy passenger demand forecasting model is put up, then a train dispatching
optimization model is established based on passenger demand so as to evacuate stranded
passengers effectively during holidays.
Design/methodology/approach:
First, the complex features and regularity of passenger
flow during holidays are analyzed, and then a fuzzy passenger demand forecasting model is put
forward based on the fuzzy set theory and time series theory. Next, the bi-objective of the train
dispatching optimization model is to minimize the total operation cost of the train dispatching
and unserved passenger volume during holidays. Finally, the validity of this model is illustrated
with a case concerned with the Beijing-Shanghai high-speed railway in China.
Findings:
The case study shows that the fuzzy passenger demand forecasting model can
predict outcomes more precisely than ARIMA model. Thus train dispatching optimization plan
proves that a small number of trains are able to serve unserved passengers reasonably and
effectively.
- 321 -
dispatching optimization model is established, which enables train dispatching to meet
passenger demand in condition that passenger flow outbursts, so as to maximize passenger
demand by offering the optimal operation plan.
Keywords:
railway transportation, passenger demand forecasting, train dispatching, fuzzy logical
relationships, optimization model
1.Introduction
With the constant improvement of China's high-speed railway network and the enhancement of connectivity within the area of the road network, inter-regional passenger demand increases. The train can’t ensure the safety and punctuality of the train operation, also unable to meet the passenger demand. A large number of passengers are stranded at the station or transfer to other modes of transport to travel. Especially in the traditional holiday, the amount of travel passenger reached a peak value in a short period of time because of the sudden increase in passenger traffic and the uneven distribution. Some trains lack of staff and run without passengers, which causes great waste in transport capacity and increases the total costs of consumption invisible. It’s very necessary to develop detailed train dispatching program, distribute and transport passenger planned.
- 322 -
Study of train dispatching issues was not able to meet passenger demand, so we must firstly forecast and assess passenger demand. Existing short-term railway passenger demand forecasting contained the relevant model predictions method and time model prediction method. Some researchers established model for passenger demand forecast on considering the transport competition, OD partition, the level of socio-economic development, national income and other factors. The model contained neural network model, Logit model (Peter, Aura & Tommaso, 1996), multiple regression model and the MD model (Butkevicius, Mindaugas, Vladas & Skirmantas, 2004; Fabio, 2006). Time model prediction methods included passenger demand forecasting method based on time series analysis, the gray mode l(Chen, 2008), ARIMA model and BP neural network model (Guo, Qiao, 2008; Wang, 2006).
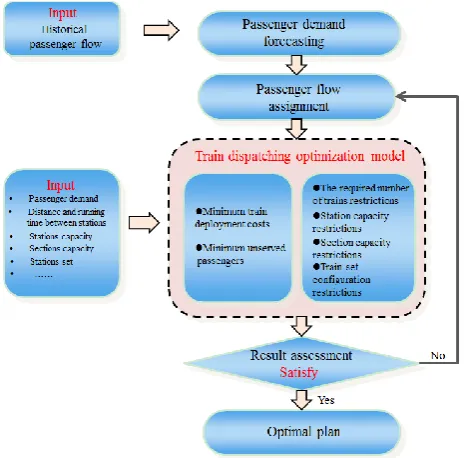
This paper analyzed the holiday passenger flow characteristics based on passenger data from Beijing South Railway Station to Langfang station during 2011 National Day holidays. Then established the passenger change rate of fuzzy logical relationship based on fuzzy theory and time series theory, and proposed fuzzy passenger demand forecasting model. A bi-objective programming model is established and the goal is to minimize the total operation cost of the train dispatching and unserved passenger volume. In this model, passenger demand is known, the constraints are station capacity restrictions, section capacity restrictions, the required number of trains restrictions and train set configuration restrictions. Thus, an interior-penalty method is used to solve this difficult problem. This paper took the Beijing-Shanghai high-speed railway for example. The results showed that the train dispatching optimization model is reasonable and effective, and better able to meet the actual passenger demand. The structure of this paper is as following Figure 1.
- 323 -
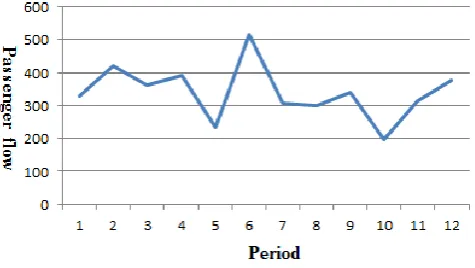
2.Analysis of passenger flow features during holidays
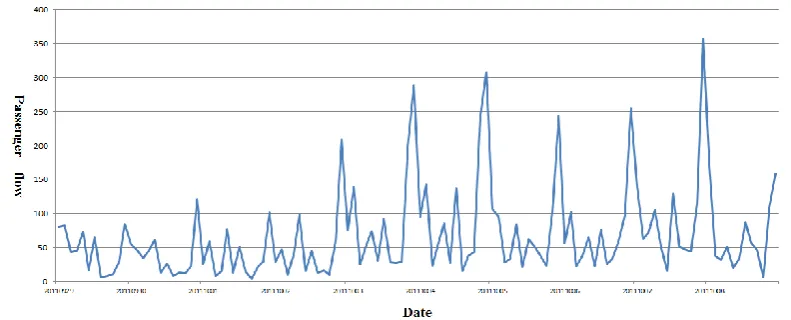
Holidays are the main reason for sudden large passenger flow and railway passenger is increased substantially. Passenger flow characteristics associated with time are mainly nonlinear fluctuation and quasi-periodic fluctuation of short-term passenger, as is shown in Figure 2.
Figure 2.Change trend of passenger flow
2.1.Nonlinear fluctuation of passenger flow
Sudden large passenger flow during holidays, which is imbalance, has the characteristics of instant sudden, passenger structural complexity and unidirectional. During holidays, start and end points of passenger are clear, which result in the increase of passenger flow is single-direction in a certain period. The passenger flow during holidays is mainly consist of civil servants, businessman, tourism, students and workers. The passengers’ arrival and leaving time mainly focus on two periods, before and after the holidays’ beginning and ending. The passenger volume will reach the peak in a short time and the peak time is outstanding. Therefore, the railway passenger flow during holidays is impacted by a variety of factors, and passenger flow change rate in short time is nonlinear fluctuation.
2.2.Quasi-periodic fluctuation of passenger flow
- 324 -
3.Fuzzy passenger demand forecast
Variable Description
t: Passenger flow periods, i.e., one hour.
p(t): The passenger flow in period t.
( )
p t
: The passenger flow predictive value in period t.n: The number of period in historical passenger flow.
v(t): The change rate from p(t) to p(t+1).
pmax: The maximum value of the historical passenger flow.
pmin: The minimum value of the historical passenger flow.
ui: The rate range of different changes in passenger flow.
u´i: The intermediate values of passenger flow change rate range ui.
ki: The number of the passenger flow change rate belongs to passenger flow change rate
range ui.
M: The last period in all of passenger flow periods. 3.1.Regularity of passenger flow
The passenger flow between the two stations in high-speed passenger railway line is statistical by a certain period of time. The history passenger flow in different periods is p(1), p(2),…p(t-1),p(t),p(t+1),…p(n-1), p(n). Take into account the passenger flow change rates between adjacent periods, which are denoted by v(1), v(2),…v(t-1),v(t),v(t+1),…v(n-2), p(n-1). Then analyze the passenger flow change rate, summarize up the regularity of the changes in passenger flow of the adjacent period.
In order to express passenger flow trend in adjacent period clearly and more accurately, passenger flow change rate is normalized. Define standardized passenger flow change rate is
max min
( ) ( ( 1) ( )) ( ) [ 1,1]
v t p t p t p p . (1)
- 325 -
When p(t+1)-p(t)>0, the passenger flow increasing from period t to t+1.
In order to reflect the regularity of the passenger flow trend clearly and express varying degrees of passenger flow change respectively, we divide passenger flow change rate into eight intervals applying Zadeh's fuzzy set theory(Zadeh, 1999).
Define the universe of discourse U={u1,u2,u3,u4,u5,u6,u7,u8}, and partition it into equal length
intervals u1=[-1,-0.75], u2=[-0.75,-0.5], u3=[-0.5,-0.25], u4=[-0.25,0], u5=[0,0.25],
u6=[0.25,0.5], u7=[0.5,0.75], u8=[0.75,1]. Define each fuzzy set Ai
based on the re-divided
intervals, fuzzy set Ai
denotes a linguistic value of the passenger flow represented by a fuzzy
set, 1<i<8.
A1 denotes that passenger flow decrease is too large, A2 denotes that passenger flow decrease
is larger, A3 denotes that passenger flow decrease is micro-large, A4 denotes that passenger
flow decrease is less, A5 denotes that passenger flow increase is less, A6 denotes that
passenger flow increase is micro-large, A7 denotes that passenger flow increase is larger, A8
denotes that passenger flow decrease is too large.
Determine the membership function of fuzzy subset Ai using assign method, namely:
when
i
1
,1
1 2
1 2
1,
( )
0.5,
0 ,
x
u
A x
x
u
x
u
u
;when
i
2,
, 7
, 1 11 1
1, ( ) 0.5,
0 ,
i
i i i
i i i
x u
A x x u u
x u u u
; when
8
i
,8
8 7
7 8
1,
( )
0.5,
0 ,
x
u
A x
x
u
x
u
u
.Define fuzzy subset Ai as follows:
1
1 2 3 4 5 6 7 8
1
0.5
0
0
0
0
0
0
A
u
u
u
u
u
u
u
u
, 21 2 3 4 5 6 7 8
0.5
1
0.5
0
0
0
0
0
A
u
u
u
u
u
u
u
u
,3
1 2 3 4 5 6 7 8
0
0.5
1
0.5
0
0
0
0
A
u
u
u
u
u
u
u
u
, 41 2 3 4 5 6 7 8
0
0
0.5
1
0.5
0
0
0
A
u
u
u
u
u
u
u
u
,5
1 2 3 4 5 6 7 8
0
0
0
0.5
1
0.5
0
0
A
u
u
u
u
u
u
u
u
, 61 2 3 4 5 6 7 8
0
0
0
0
0.5
1
0.5
0
A
u
u
u
u
u
u
u
u
,7
1 2 3 4 5 6 7 8
0
0
0
0
0
0.5
1
0.5
A
u
u
u
u
u
u
u
u
, 81 2 3 4 5 6 7 8
0
0
0
0
0
0
0.5
1
A
u
u
u
u
u
u
u
u
- 326 -
Establish fuzzy logical relationships based on the fuzzed passenger flow change rates:
Aj Ap, ApAq, …, AsAt
Aq Ap, ApAs, …, AsAr
…
”AjAp”denotes that ”if the fuzzed passenger flow rate from period t-1 to t
is
Aj, the fuzzedpassenger flow rate from period t to t+1 will be Ap”. For example, information of passenger
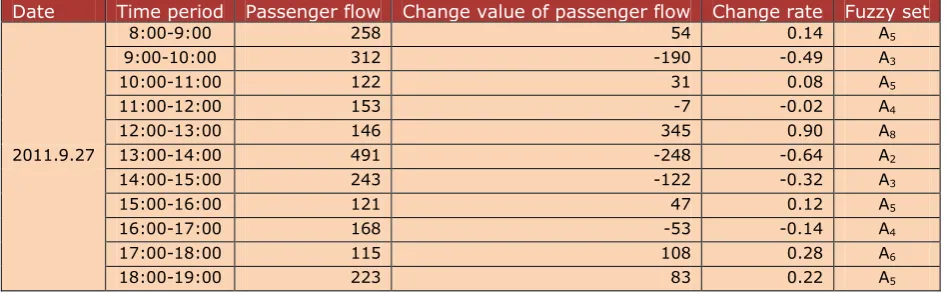
flow is shown in Table 1.
Date Time period Passenger flow Change value of passenger flow Change rate Fuzzy set
2011.9.27
8:00-9:00 258 54 0.14 A5
9:00-10:00 312 -190 -0.49 A3
10:00-11:00 122 31 0.08 A5
11:00-12:00 153 -7 -0.02 A4
12:00-13:00 146 345 0.90 A8
13:00-14:00 491 -248 -0.64 A2
14:00-15:00 243 -122 -0.32 A3
15:00-16:00 121 47 0.12 A5
16:00-17:00 168 -53 -0.14 A4
17:00-18:00 115 108 0.28 A6
18:00-19:00 223 83 0.22 A5
Table 1. Information of passenger flow
Following the above example, the fuzzy passenger flow change rate for 8:00-9:00 is A5, and
for 9:00-10:00 is A3. Hence, we can establish a fuzzy logical relationship is A5 A3. Similarly,
from Table 1, we can get fuzzy logical relationships are A5A3, A3A5, A5A4, A4A8, etc.
Therefore, the fuzzy logical relationships of the passenger flow change rate are shown in Table 2.
A5A3 A3A5 A5A4 A4A8 A8A2
A2A3 A3A5 A5A4 A4A6 A6A5
Table 2. Fuzzy logical relationships
From Table 2, fuzzy passenger flow change rate is A5 in previous period, in the following
- 327 -
3.2.Fuzzy passenger demand forecasting model
The establishment of fuzzy passenger demand forecasting model is based on fuzzy logical relationships and time series theory, and the steps are as follows:
Step1: Start with period l=n+1 to predict passenger flow.
Step2: Use Eq.(1) to calculate the passenger flow change rate v(n-1) in period n-1 to n, and fuzzy passenger flow change rate is Ai. We can find the next fuzzy passenger flow change rate Aj according to fuzzy logical relationships. ki is the number of thepassenger flow change rate Aj which belongs to passenger flow change rate range
u
i.
Step3: Calculate the passenger flow change rate in period l=n+1, which is1 1 2 2 3 3 4 4 5 5 6 6 7 7 8 8
8
1
( 1)
i i
k u k u k u k u k u k u k u k u
v l
k
.
Step4: Calculate predictive valuep l
( )
p l
(
1)
p l
(
1)
v l
(
1)
, and add predictive value to the data of passenger flow, repeat Step2 to Step3 with regard to l=l+1 untill=M.
Step5: Calculate the root mean squared error (RMSE) between the actual values andpredictive values, which is 2
1 1
[ ( ) ( )] M
i n
RMSE p i p i
M n
.3.3.Analysis of model effectiveness
- 328 -
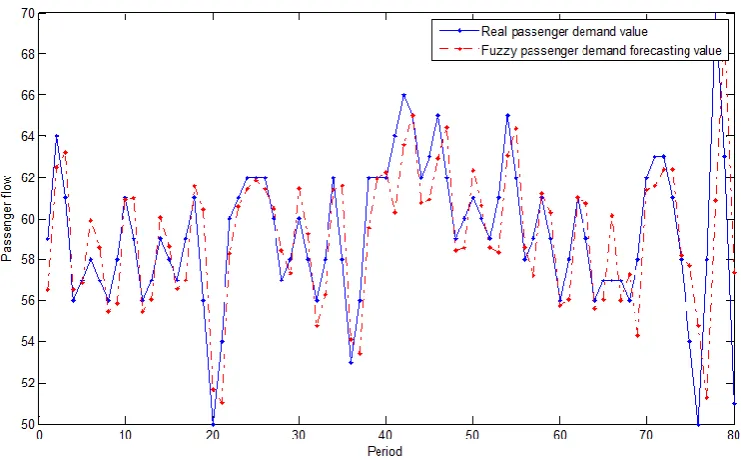
Figure 3. Comparison of predictive value and real value
Furthermore, the results show that the fuzzy passenger demand forecasting model has a better prediction value, compared with ARIMA model. Three statistics are used to compare, they are mean absolute error (MAE), mean absolute percentage error (MAPE) and root mean square error (RSME), as is shown in Table 3.
Prediction model MAE MAPE RMSE
ARIMA 8.64 0.096 4.56
Fuzzy passenger demand forecast 2.91 0.041 2.91
Table 3 The comparison of prediction model
4.Train dispatching optimization model
The whole procedure of the model including minimize the total operation cost of the train dispatching and unserved passenger volume. If the operation plan doesn’t satisfy the passenger demand, operation plan would be dispatched for passenger flow assignment, in order to attain the passenger demand.
4.1.Notation
Input data
l: The train type.
T: The planned operating period, i.e., one day.
Fl: The variable operating cost for train l running one kilometer.
F´
- 329 - Lij: The distance between stations i and j.
Ni,j: The required number of train l between stations i and j.
ul: The seat capacity of train l.
Uij: The unserved passengers volume between stations i and j.
Ck
ij: The carrying capacity between stations i and j on the railway line k.
D: The fixed overhead cost for one train.
Ct: The carrying capacity of station t for the planned operating period T.
Ck: The carrying capacity of section k for the planned operating period T. Decision variables
Xi,j,l: The number of train l between stations i and j.
yi,j,l: The number of the empty running train l between stations i and j.
xt
i,j,l: The number of train l stops at station t between stations i and j.
yt
i,j,l: The number of the empty running train l stops at station t between stations i and j.
xk
i,j,l: The number of train l runs in section k between stations i and j.
yk
i,j,l: The number of the empty running train l runs in section k between stations i and j.
4.2.Objective function
Train set configuration is to meet the demand of passenger flow outburst. In this case, the minimum total operation cost of the train dispatching and unserved passenger volume are the objective functions to meet the passenger demand.
Minimize the total operation cost, which includes the fixed overhead cost, variable operating cost for running and variable operating cost for the train empty running.
1 , , , , , , , ,
min
(
(
i j l i j l)
l ij i j l l ij i j l)
l i j j
z
D x
y
F L x
F L y
. Minimize the unserved passengers volume for successfully to meet the passenger demand.
2 , , , ,
min ( i j l l i j l) l i j j
z P u x
.4.3.Constraint conditions
The required number of trains restrictions:
, , , , ,
(
i j l i j l)
i j,
l
x
y
N
i
j
- 330 -
Station capacity restrictions:
, , , ,
(
i j lt i j lt)
tl i j j
x
y
C
. Section capacity restrictions:
, , , ,
(
k k)
i j l i j l k l i j j
x
y
C
. Train set configuration restrictions: if the round-trip trains are no-load, it can’t satisfy the condition of passenger flow outburst between stations i and j.
, , , ,
=0,
i j l j i l
y
y
i
j
.4.4.Model of the train dispatching optimization
1 , , , , , , , ,
min ( ( i j l i j l) l ij i j l l ij i j l) l i j j
z D x y F L x F L y
2 , , , ,
min ( i j l l i j l) l i j j
z P u x
. .
s t
, , , , ,
(
i j l i j l)
i j,
l
x
y
N
i
j
, , , ,
(
t t)
i j l i j l t l i j j
x
y
C
, , , ,
(
i j lk i j lk)
kl i j j
x
y
C
, , , ,
=0,
i j l j i l
y
y
i
j
, ,
,
, ,,
, ,0
t k i j l i j l i j l
x
x
x
, ,
,
, ,,
, ,0
t k i j l i j l i j l
y
y
y
The train dispatching optimization model is a nonlinear complementarity constraints program. An interior-penalty method (Dou, 2011; Fletcher et al., 2004; Hu & Ralph, 2004) is used to solve this difficult problem.
5.Case study
- 331 -
Date Time period Passenger flow Change value of passenger flow Change rate Fuzzy set
2011.9.27
8:00-9:00 258 54 0.14 A5
9:00-10:00 312 -190 -0.49 A3
10:00-11:00 122 31 0.08 A5
11:00-12:00 153 -7 -0.02 A4
12:00-13:00 146 345 0.90 A8
13:00-14:00 491 -248 -0.64 A2
14:00-15:00 243 -122 -0.32 A3
15:00-16:00 121 47 0.12 A5
16:00-17:00 168 -53 -0.14 A4
17:00-18:00 115 108 0.28 A6
18:00-19:00 223 83 0.22 A5
19:00-20:00 306 -32 -0.08 A4
2011.9.28
8:00-9:00 274 78 0.20 A5
9:00-10:00 352 -143 -0.37 A3
…… …… …… …… ……
2011.10.10
…… …… …… …… ……
18:00-19:00 196 39 0.10 A5
19:00-20:00 235 71 0.18 A5
2012.9.27
8:00-9:00 306 119 0.31 A6
9:00-10:00 425 -186 -0.48 A3
…… …… …… …… ……
2012.9.29
…… …… …… …… ……
18:00-19:00 178 75 0.19 A5
19:00-20:00 253 — — —
Table 4. Information of the historical passenger flow data
Figure 4. Passenger demand forecasting value
The passenger flow from Beijing to Jinan is 4088. Similarly, the passenger demand forecasting values are shown in Table 5.
capacity station station
Beijing Langfang Tianjin Jinan
Beijing - 3240 5120 4088
Langfang 3786 - 4050 2920
Tianjin 4910 4460 - 4865
Jinan 4540 2600 4265 -
- 332 -
Assume that the fixed overhead cost for one train is 10000 yuan. There is only one type train, and this type of train u1 can accommodate 1200 passengers. In addition, the required number of train l between stations i and j is N12=N21=2, N13=N31=4, N14=N41=3, N23=N32=3,
N24=N42=2, N34=N43=3, the carrying capacity of section between station i and station j is
shown in Table 6.(unit: train). The carrying capacity of station is shown in Table 7.(unit: train).
capacity station
station
Beijing Langfang Tianjin Jinan
Beijing — 10 9 7
Langfang 10 — 12 9
Tianjin 9 12 — 11
Jinan 7 9 11 —
Table 6. Section capacity
station Beijing Langfang Tianjin Jinan capacity 16 12 14 16
Table 7. Station capacity
In the process of train dispatching between stations i and j, the variable operating cost Fl·Lij
for running is shown in Table 8. (unit: yuan).
cost station
station Beijing Langfang Tianjin Jinan Beijing — 12000 26000 38000
Langfang 12000 — 13000 27000
Tianjin 26000 13000 — 15000
Jinan 38000 27000 15000 —
Table 8. Variable operating cost for running
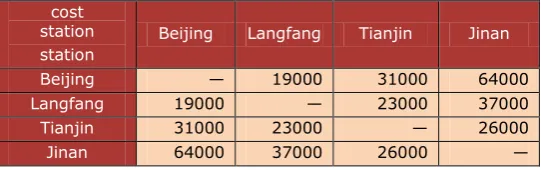
In the process of train dispatching between stations i and j, the variable operating cost F´l·Lij
for empty running is shown in Table 9. (unit: yuan).
cost station
station
Beijing Langfang Tianjin Jinan
Beijing — 19000 31000 64000
Langfang 19000 — 23000 37000
Tianjin 31000 23000 — 26000
Jinan 64000 37000 26000 —
Table 9. Variable operating cost for empty running
- 333 -
BJ LF TJ JN
Figure 5. Line plan of BJ station-JN station in high-speed railway
6.Conclusions
The train dispatching optimization model is a large-scale combinatorial optimization problem, there are many factors and the relationship between the factors is complex. Fuzzy set theory, portfolio optimization and train operation adjustment theory are applied in this paper. First, fuzzy passenger demand forecasting model is established to predictive passenger during holidays. The results showed that the fuzzy passenger forecasts predict is more accurate than ARIMA model. Then, train deployment theory in sudden large passenger flow is studied on considering the total operation cost of the train dispatching, unserved passenger volume, the required number of trains, station capacity, section capacity and train set configuration. Finally, train dispatching optimization model is established, the validity of this model is illustrated with a case study.
With the increase in passenger flow during holidays, train dispatching is influenced by more factors and there are more constraints to consider. Further discussion is need for model and more detailed analysis of the railway line is still need in the case.
Acknowledgement
This work has been supported by the National Natural Science Foundation of China (Grant: 61074151), the National Key Technology R&D Program (Grant: 2009BAG12A10), the Research Fund of the State Key Laboratory of Rail Traffic Control and Safety (Grant: RCS2008ZZ003, RCS2009ZT002), and the Research Fund of Beijing Jiaotong University (Grant: 2011YJS035).
References
Beaujon, G.J., & Turnquist, M.A. (1991). A model for fleet sizing and vehicle allocation.
Transportation Science, 25, 19-45. http://dx.doi.org/10.1287/trsc.25.1.19
- 334 -
Chen, J.L. (2008). Railway passenger traffic volume forecasting from Chongqing to Chengdu based on grey theory. China New Technologies and Products, 4, 20-21.
Chen, Y.R., Peng, Q.Y., & Jiang, Y.S. (2003). Research on a model for adjusting train diagram on double track railway with satisfactory optimization. Journal of the China Railway Society, 25(3), 8-12.
Dejax, P.J., & Crainic, T.G. (1987). A review of empty flows and fleet management models in freight transportation. Transportation Science, 21(4), 227-247.
http://dx.doi.org/10.1287/trsc.21.4.227
Dong, S.Q., Wang, J.Y., & Yan, H.F. (2005). Tabu search for train operation adjustment on double-track line. China Railway Science, 26(4), 114-119.
Dou, F. (2011). Study on train deployment model and algorithms during holidays. Beijing Jiaotong University.
Fabio, S. (2006). An integrated forecasting and regulation framework for light rail transit systems. Journal of Intelligent Transportation Systems, 7, 59-73.
Fletcher, R., & Leyffer, S. (2004). Solving mathematical program with complementarity constraints as nonlinear programs. Optimization Methods and Software, 19(1), 15-40.
http://dx.doi.org/10.1080/10556780410001654241
Ghoseiri, K., Szidarovszky, F., & Asgharpour, M.J. (2004). A multi-objective train scheduling model and solution. Transportation Research Part B, 38(10), 927-952.
http://dx.doi.org/10.1016/j.trb.2004.02.004
Guo, W., & Qiao, Y.Z. (2008). The forecasting research of railway passenger capacity based on neural network optimized by GA. Journal of Shandong University of Technology, 5, 25-27. Higgins, A., Kozan, E., & Ferreira, L. (1996).Optimal scheduling of trains on a single line track.
Transportation Research Part B, 30(2), 147-161. http://dx.doi.org/10.1016/0191-2615(95)00022-4
Hu, X.M., & Ralph, D. (2004). Convergence of a penalty method for mathematical programming with complementarity constraints. Journal of Optimization Theory and Applications, 123(2), 365-390. http://dx.doi.org/10.1007/s10957-004-5154-0
Kraay, D., Harker, P.T., & Chen, B. (1991). Optimal pacing of trains in freight railroads: Model formulation and solution. Operations Research, 39(1), 82-99.
- 335 -
Peter, N., Aura, R., & Tommaso, T. (1996). Modelling inter-urban transport flows in italy a comparison between neural network analysis and logit analysis. Transport Research, 6, 323-328.
Wang, F. (2006). Research of short-term passenger transportation volume forecasting methods.
Beijing Jiaotong University.
Yang, L.X., Li, K.P., & Gao, Z.Y. (2009). Train timetable problem on a single-line railway with fuzzy passenger demand. IEEE Transactions on Fuzzy Systems, 17(3), 617-629.
http://dx.doi.org/10.1109/TFUZZ.2008.924198
Zadeh, L.A. (1999). Fuzzy sets as a basis for a theory of possibility. Fuzzy Sets and Fuzzy Systems, 100, 9-34. http://dx.doi.org/10.1016/S0165-0114(99)80004-9
Zhang, Y.S., & Jin, W.D. (2005). Model and algorithm for train operation adjustment on single-track railways based on genetic algorithm. Journal of Southwest Jiaotong University, 40(2), 147-152.
Zhou, X.S., & Zhong, M. (2005). Bicriteria train scheduling for high-speed passenger railroad planning applications. European Journal of Operational Research, 167(3), 752-771.
http://dx.doi.org/10.1016/j.ejor.2004.07.019
Journal of Industrial Engineering and Management, 2013 (www.jiem.org)
El artículo está con Reconocimiento-NoComercial 3.0 de Creative Commons. Puede copiarlo, distribuirlo y comunicarlo públicamente
siempre que cite a su autor y a Intangible Capital. No lo utilice para fines comerciales. La licencia completa se puede consultar en