ISSN 2324-805X E-ISSN 2324-8068 Published by Redfame Publishing URL: http://jets.redfame.com
The Perceptions of Five Years Old Group Students’ about Scientists
Sümeyra Zeynep Et1, Esra Kabataş Memiş2 1Department of Educational Science, Kastamonu University, Kastamonu, Turkey
2Department of Science Education, Kastamonu University, Kastamonu, Turkey
Correspondence: Esra Kabataş Memiş, Department of Science Education, Kastamonu University, Kastamonu, Turkey.
Received: November 22, 2016 Accepted: January 10, 2017 Online Published: January 12, 2017
doi:10.11114/jets.v5i2.2167 URL: http://dx.doi.org/10.11114/jets.v5i2.2167
Abstract
The purpose of this research is to reveal the perceptions of students of five years old group about scientists. The practice was implemented with 76 students having education in five-age group continuing to various nursery schools located in the center of Kastamonu province. Before starting the practice, the teacher asked the questions of “Who is the scientist?” and made them thought with the aim of ensuring the awareness of students against scientist. Afterwards, the researchers asked the students to narrate their pictures while they collect the drawings. The paintings were coded by the researchers by using the descriptive analysis method. The codification was made individually at first and then together with all the researchers with the aim of ensuring the reliability of research. In the light of collected information, it was generally seen in the pictures of students that the work environment of scientists is constituted by the space and world and their gender is generally men and also, there was a small number of women scientist profile. It was also determined that the students emphasized the extraterrestrial life and drew the scientists as similar to astronauts and they used space crafts and planets in their paintings. In another finding, scientists were seen as the people who mostly conduct research and use potion in general. Another attractive research finding is that; a small number of students draw the scientist as person who use computer and study lesson. In the light of these findings, it can be told that the students were affected extremely from their environment (the movies and cartoon they watched, their families, etc.…).
Keywords: science, scientist, perception, draw a scientist test
1. Introduction
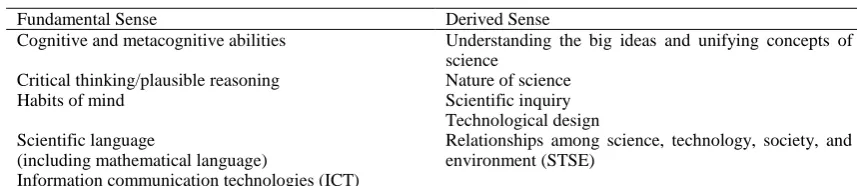
Table 1 .Meanings of scientific literacy (Yore et al., 2007)
Fundamental Sense Derived Sense
Cognitive and metacognitive abilities Understanding the big ideas and unifying concepts of science
Critical thinking/plausible reasoning Nature of science
Habits of mind Scientific inquiry
Technological design Scientific language
(including mathematical language)
Information communication technologies (ICT)
Relationships among science, technology, society, and environment (STSE)
The common ground of science program and these defined various meanings is the aim of growing the students as the individuals who can look with the eyes of scientists. This can be realized by having a positive image directed to the scientist (Kaya, doğan & Öcal, 2008). When the body of literature is investigated, it is seen that there have been too many researches regarding the perception of individuals about science and scientists in the last fifty years. The essential point of most of these researches is to determine the perception of children for science (Finson, 2002) and to show that the children have stereotyped ideas by this means (Scherz & Oren, 2006). It was stated in many studies that the children from various age groups have wrong ideas about scientific information (Kang, Scharmann & Noh, 2004) and thus, there is the need for more information about the ideas and thinking of children on science and scientific information (Kılıç, 2010).
A great number of studies were also conducted in our country in which the scientist images of students were investigated (Buldu, 2006; Deniş Çeliker & Erduran Avcı, 2015; Ekici, Doğan & Kaya, 2007; Güler & Akman, 2006; Nuhoğlu & Afacan, 2007; Kaya, Doğan & Öcal, 2008; Korkmaz & Kavak, 2010; Oğuz-Ünver, 2010; Öcal, 2007; Yontar Toğrol, 2000). These studies were conducted with the work groups from various levels such as teacher candidates (Ağgül-Yalçın, 2012), high - schoolers (Akcay (2011), secondary school students (Kara and Akarsu, 2015; Nuhoğlu and Afacan, 2011; Türkmen, 2008) and pre-school students (Özel, 2012). As stated in the study, the perceptions of students regarding the images of scientists can be affected from many various sources. For example; scientist are symbolized generally with their visual aspects and attitudes in television and books. These environments include the students and thus, help in growing their own ideas for scientists (Deniş Çeliker & Erduran Avcı, 2015). Especially in small ages, creating and developing the perceptions of students against science and scientists can be ensured by teachers reflecting their perceptions against science and scientist in class environment. Moreover, sometimes the students reflect the scientists as extraordinary people or legendary creatures (Çakmakçı, Tosun, Turgut, Örenler, Şengül & Top, 2011) instead of realistic people and sometimes with the stereotypical ideas (Ekici, Doğan & Kaya, 2007). In general, the stated ideas on stereotypical scientist are just like the people who work in laboratory which is full of technological devices and experiment materials, wear white coat and who is middle –aged, male and shock head. Chambers (1983)In the study made on 4800 children from United States, Australia and Canada, it was determined that the scientists are perceived generally as male and as people who wear laboratory coat, glasses, who has beard and shock head and who are busy with experiment materials. Similar results are given in many studies. It is very important for removing such stereotyped ideas to investigate the scientist images from early ages, to reveal the current conditions comprehensively and also to take the required precautions without losing any time (Küçük & Bağ, 2012).
Thus, the purpose of this study is to reveal the perceptions of students from five - age group who have education in pre-school. Depending on this purpose, the perception of students against scientists was defined with the paintings. The mostly used tool in determining their perception about scientist is also painting. Painting is the narration, expression and reflection tool which is stronger than the statements which the children try to express with words (Temel & Güllü, 2016).
2. Method
2.1 Research Model and Study Group
In this study conducted with the aim of determining the perceptions of student from the five – aged group against scientist, the qualitative research model was used. The study group of research is constituted by 76 students from five – age group who continue to have education in two pre-schools in center of Kastamonu province in 2015 – 2016 education year. In determining the study group of research, the purposive sampling method was used by the researchers because of allowing the study on definite and unapproachable individuals or situations (Erkuş, 2013).
2.2 Collecting the Data
distributed to the students with the aim of drawing and afterwards, the students were asked to draw the “scientist” in their imaginary world. This practice was implemented in one class hour. Within this duration, the researchers were present in the class for helping the students in providing required support (pencil sharpening, distributing the drawing papers, etc.) and preventing the students from affecting each When the students completed their drawings, the researchers made one on one interview with the children about drawings and asked them to narrate the paintings and took short notes regarding the drawings emphasized in paintings.
2.3 Analysis of Data
76 paintings gathered from the students attending to the research were analyzed in line with the content analysis method by researchers. As a result of conducted analysis, it was determined that there is no perception for scientists in drawings of 2 students and they were excluded from the study concept. The codifications were created by using the similar studies in literature. In addition, with the aim of increasing the reliability of codifications; the researchers made all the codifications individually at first and then collectively by comparison. The gathered findings were presented with frequency (f) analysis and samples of drawings of students.
3. Results
When the distribution of answers given by students against the question of “Who is scientist?”, four categories were created. These four categories are gender, physical characteristics, work environment and research symbols. The findings for each category were given in separate titles.
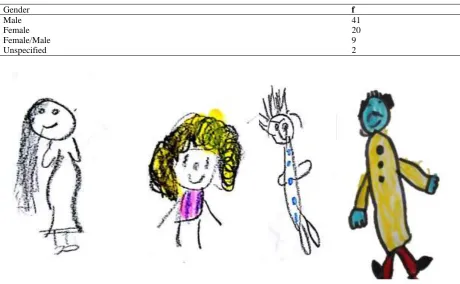
3.1 Gender of Scientist
When the drawings are investigated, the findings regarding the gender of scientist are given in Table 1. As a result of the gathered findings, while 41 students (54%) painted the scientist as male; 20 students (26.3%) painted the scientists as female. While 9 of students (11.8%) painted both the male and female scientists in their paintings; only 2 students (2,6%) did not use ant figure regarding gender. The samples of student’s drawings regarding the gender of scientist are given in Figure 1.
Table 1. Frequency distributions for gender
Gender f
Male 41
Female 20
Female/Male 9
Unspecified 2
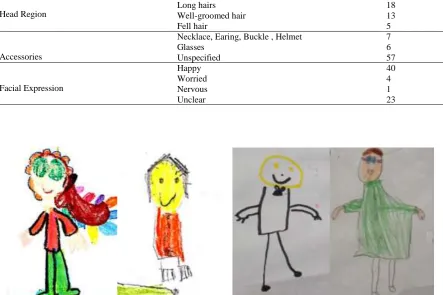
3.2 Physical Characteristics of Scientist
The distribution of physical characteristics of scientist painted by students in their drawings is given in Table 2. Physical characteristics are gathered under four distinct categories. These categories are the clothes, the head region, used accessories and the facial expression of scientist. When the clothes are investigated; it is determined that 22 students painted the scientists with daily clothes, 14 students painted them with laboratory coats, 3 students painted them with tie – bow tie – kerchief and 3 students painted them with astronaut clothes. When the head region is assessed; it is determined that; 20 students painted the scientist as bald, 21 students painted them with messy hair, 18 students painted them with long hairs, 13 students painted them as well – kept and 5 students painted them with fell hair. Another category created regarding the physical characteristic is the accessories used by scientists. When the drawings are examined, while 57 students did not put any accessories on scientists; 6 students perceived the scientists as people who wearing glasses; 7 students painted the scientist with accessories such as necklace, earing, buckle or helmet. An attractive finding is that; while more than half of the students (40 students) painted the scientist with happy facial expressions; 23 students did not use any expression and 4 students painted them with worried expression. Samples of students regarding the physical characteristics of scientist are given in Figure 2.
Table 2. Frequency distributions for physical characteristics
Physical characteristics f
Clothing Features
Daily Clothes 22
Laboratory Coats 14
Tie – Bow tie – Kerchief 3
Astronaut Clothes 3
Head Region
Messy hair 21
Bald 20
Long hairs 18
Well-groomed hair 13
Fell hair 5
Accessories
Necklace, Earing, Buckle , Helmet 7
Glasses 6
Unspecified 57
Facial Expression
Happy 40
Worried 4
Nervous 1
Unclear 23
Figure 2. Physical Characteristics of Scientist
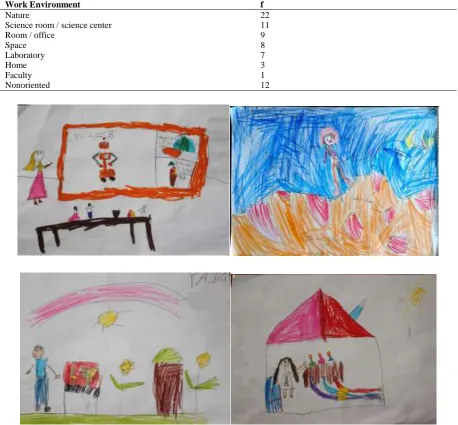
3.3 Work Environment of Scientist
Table 3.Frequency distributions of the work environment of scientist
Work Environment f
Nature 22
Science room / science center 11
Room / office 9
Space 8
Laboratory 7
Home 3
Faculty 1
Nonoriented 12
Figure 3. Work Environment of Scientist
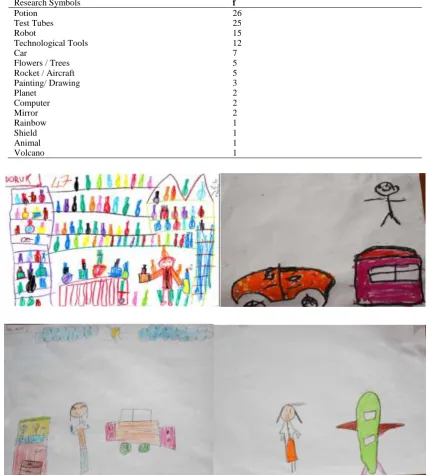
3.4 Research Symbols
Table 4. Frequency distributions for research symbols
Research Symbols f
Potion 26
Test Tubes 25
Robot 15
Technological Tools 12
Car 7
Flowers / Trees 5
Rocket / Aircraft 5
Painting/ Drawing 3
Planet 2
Computer 2
Mirror 2
Rainbow 1
Shield 1
Animal 1
Volcano 1
Figure 4.Research Symbols of Scientist
4. Discussion and Conclusion
though as the first step in preventing these wrong perceptions. In the light of this information, it is very important to determine the scientist image in the eyes of students from five-age group.
In this study, it was tried to determine the images of students from five – age group about scientist. The drawings of students regarding their perception about scientist were assessed by gender, physical characteristics, research symbols and work environment. When the drawings were assessed by gender, it was seen that while 41 (54%) of students participating the study painted the scientist as male; 20 of the students (26.3%) painted the scientist as female. While 9 (11.8%) of students showed both of the male and female scientists in their drawings; only 2 students (2,6%) did not use any figure regarding the gender. This result is in parallel with the study conducted by Özsoy and Ahi (2014).In the study conducted with the students from primary school (1, 2, 3, 4, and 5. Class), it was determined that %65.6 of students painted the scientist as male and %22.5 of students painted the scientist as female. In the study of Toğrol Yontar (2000), %72,5 of 443 primary school and high school students painted the scientist as male and 12,6% of them painted the scientist as female; in the research of Kara and Akarsu (2015), it was seen that 89 of 114 middle school (5, 6, 7 and 8. Class) students painted the scientist as male and 25 of them painted the scientist as female. Gathered results emphasizes that the scientist in the minds of students from various grades is male in general. As the reason of this, the wrong transmission in media and organs (cartoon, animation movies, scientist biographies, and news and TV series) as the science is an occupation only implemented by men and the wrong usage of “science men” instead of “scientist” can be stated. Moreover, within the scope of this study, the potion figures seen in the drawings of students show that they are generally impacted from media.
The drawings of students for scientist were investigated by physical characteristics, clothes, head region, accessory and facial expression. When the drawings of students, there is no decrease in the number of laboratory coats in terms of clothes and besides, it is an important result that there is no special cloth and there is the increase in daily cloth figures. While the result of this research is contrast with the researches implemented by Kara and Akarsu (2015) and Güler and Akman (2006); it is in parallel with the researches of Deniş Çeliker and Erduran Avcı’nın (2015).
In various researches implemented in our country, it is determined that the students generally perceive the scientist as person who has glasses, who is bald, who wears laboratory coat, who has beard of mustache, who works alone with chemical materials in laboratory, who is middle aged or aged and as men (Kara ve Akarsu, 2015; Korkmaz & Kavak, 2010; Güler & Akman, 2006).When these results are taken into consideration, another attractive result of research is that the students do not perceive the scientists as person who is bald, who wears glasses and laboratory coat and who is unhappy. The ideas of students and the scientists may have different physical appearances (well-kept hair, daily clothes, bow tie, and happiness), this may be interpreted as the indicator that this issue is perceived beyond the current classic perception.
When the drawings were investigated by work environment of scientists; it was seen that 22 of students painted the scientists in nature; 12 of them did not make show any location; 11 of students painted the scientist science center, 9 of students painted them in room/office, 7 of students painted them in laboratory, 8 of students painted them in space, 3 of students painted them in home and 1 student painted them in faculty. The results of this research is very important to show that the students perceive the scientists as people who also work outside the indoor areas; that the work environments are not limited with laboratories and that the students deem the science centers, offices, faculty and homes as venues where the scientists can work.
When the research results are assessed, it is seen that the perceptions of students regarding the research symbols used by scientists are different and mainly the potions and test tubes are used. Robots, technological devices, car, flower/tree, rocket /plane, picture, mirror, plate, computer and animal are the other valid research symbols. An attractive result gathered under this title is that; 1/3 of students used the potion figure in their drawings. In these drawings, it can be told that the students perceived the scientist as people who generate potion and who is busy with magic. This result is in parallel with the study implemented by Özsoy and Ahi (2014).
“scientist” and to help in gathering this perception. As stated in literature, when the results of researches implemented with the students from various grades are taken into consideration, it is seen that the students have a stereotyped perception about scientist. From this point of view, it is deemed as very important to determine the perceptions about scientist in early ages and to generate the planning that are well for making changing or development in current perceptions with the cooperation of family and school. Thus, it is though that this study is thought to provide important contributions to this literature.
References
[NRC] (1996). National science education standards. Washington, DC.
Ağgül, Y. F. (2012). Investigation of prospective teachers’ ımage of scientist with respect to some variables. Elementary Education Online, 11(3), 611-628.
Akçay, B. (2011). Turkish elementary and secondary students’ views about science and scientist. Asia Pacific Forum on Science Learning and Teaching, 12(1), 1-11.
Buldu, M. (2006). Young children’s perceptions of scientists: a preliminary study. Educational Research, 48(1), 121–132. http://dx.doi.org/10.1080/00131880500498602
Çakmakci, G., Tosun, O., Turgut, S., Orenler, S., Sengul, K., & Top, G. (2011). Promoting an inclusive image of scientists among students: Towards research evidence-based practice. International Journal of Science and Mathematics Education, 9(3), 627-655. https://doi.org/10.1007/s10763-010-9217-4
Chambers, D. W. (1983). Stereotypic images of the scientist: The draw a scientist test. Science Education, 67(2), 255-265. https://doi.org/10.1002/sce.3730670213
Deniş, Ç. H., & Erduran, A. D. (2015). Scientist Perception of Primary School Students: How Does Attendance to Scientific Activities Affect Scientist Perception? Mehmet Akif Ersoy University Journal of Education Faculty, 36, 90-104.
Doğan, B. N. (2005). Investigating science teachers' and high school students' views on the nature of science in Turkey. Doctoral Thesis, Gazi University, Institute of Educational Sciences, Ankara.
Doğanay, A., Demircioğlu, T., & Yeşilpınar, M. (2014). A need assessment study for an interdisciplinary curriculum about nature of science for prospective elementary teachers. Turkish Studies, 9(5), 777-798.
https://doi.org/10.7827/TurkishStudies.6725
Ekici, F., Doğan, A., & Kaya, O. N. (2007).Scientific images of primary school second graders (6th, 7th, 8th, and 5th graders). National Science and Mathematics Education Congress, Ankara.
Erkuş, A. (2013). Scientific research process for behavioral sciences. Ankara; Seçkin Publishing.
Eroğlu, B. (2012). A study about the nature of science effect on the preservice science teachers? Informal reasoning about global warming. Ph.D. Thesis, Gazi University, Institute of Educational Sciences, Ankara.
Finson, D. K. (2002). Drawing A Scientist: What We Do and Do Not Know After Fifty Years of Drawings. School Science and Mathematics. 102(7), 335–345. https://doi.org/10.1111/j.1949-8594.2002.tb18217.x
Güler, T., & Akman, B. (2006). 6 year old children’s vıews on scıence and scıentısts. Hacettepe University Journal of Education, 31, 55-56
Kang, S., Scharmann, L. C., & Noh, T. (2004). Examining students’ views on the nature of science: Results from Korean 6th, 8th, and 10th graders. Sci. Ed., 89, 314–334. http://dx.doi.org/10.1002/sce.20053
Kapancık, E. (2009). A longitudinal study of pre-service chemistry teacher's views about the nature of science. Master Thesis, Gazi University, Institute of Educational Sciences, Ankara.
Kara, B., & Akarsu, B. (2013). Determining of attitudes and the image of secondary school students about scientists. Journal of Science Education, 3(2), 90-116.
Kaya, O. N., Doğan, A., & Öcal, E. (2008). Turkish elementary school students’ images of scientists. Eurasian Journal of Educational Research,32, 83-100.
Kılıç, Ş. (2010). Children’s attıtudes and stereotypes towards science and scientists. Journal of Turkish Educational Sciences, 8(2), 439-455.
Küçük, M., & Bağ, H. (2012). A comparıson of the 4 and 5. Grade students’ scıentıst ımages. Bayburt University Journal of Education, 7(2), 125-138.
McMillan, J. H., & Schumacher, S. (2006). Research in education: Evidence-based inquiry (6th ed.). Boston: Pearson. Merriam, S. B. (2013). Qualitative research: A guide to design and ımplementation. (Trans. Edit.) Turan, S. Ankara:
Nobel.
Ministry of National Education (2005). Primary science and technology course 6th grade curriculum. Ankara: Education and Training Board.
Ministry of National Education (2013). Science Lesson (6th, 7th, and 8th grades) Education Program, Ankara, Turkey Nuhoğlu, H., & Afacan, Ö. (2007). Evaluation of the primary school students’ view about scientists. 16. Educational
Sciences Congress, Tokat, Turkey.
Nuhoğlu, H., & Afacan, Ö. (2011). Evaluation of the primary school students’ view about scientists.Journal of Kırşehir Education Faculty, 12(3), 279-298.
Öcal, E. (2007). Identification and description of 6, 7, 8. secondary school student's scientist image and schema. Master Thesis, Gazi University, Ankara.
Oğuz-Ünver, A. (2010). Perceptions of scientists: a comparative study of fifth graders and fourth year student teachers. Necatibey Faculty of Education Electronic Journal of Science and Mathematics Education,4(1), 11-28.
Özbek, D. (2013). The effect of the applications that were carried out within the scope of science technology and society course, on the perceptions of pre-service teachers toward understanding the aspects of nature. Master Thesis, Karadeniz Technical University, Institute of Educational Sciences, Trabzon.
Özel, M. (2012). Children's Images of Scientists: Does Grade Level Make a Difference? Educational Sciences: Theory and Practice, 12(4), 3187-3198.
Özsoy, S., & Ahi, B. (2014). Images of scientists through the eyes of the children. Necatibey Faculty of Education Electronic Journal of Science and Mathematics Education, 8(1). 204-230.
Patton, M. Q. (2014). Qualitative research and evaluation methods. (Trans. Ed.) Bütün, M. & Demir, S. B. Ankara: Pegem-A Publishing
Scherz, Z., & Oren, M. (2006). How to Change students’ images of science and technology. Sci. Ed., 90: 965–985. http://dx.doi/10.1002/sce.20159
Temel, C., & Güllü, M. (2016). Draw a Physical Education Lesson. Education and Science, 41(183), 351-361. http://dx.doi/10.15390/EB.2016.5106
Türkmen, H. (2008). Turkish primary students’ perceptions about scientist and what factors affecting the image of the scientists. Eurasia Journal of Mathematics, Science and Technology Education, 4(1), 55-61.
Yontar, T. A. (2000). Student ımages of the scıentıst. Education and Science, 25(118), 49-57.
Yore, L. D., Pimm, D., & Tuan, H. L. (2007). The literacy component of mathematical and scientific literacy. International Journal of Science and Mathematics Education, 5, 559-589.
http://dx.doi:10.1007/s10763-007-9089-4
Copyrights
Copyright for this article is retained by the author(s), with first publication rights granted to the journal.