ISSN 2324-805X E-ISSN 2324-8068 Published by Redfame Publishing URL: http://jets.redfame.com
Independent Validation and Clinical Utility Study of the Hellenic WISC-III
Using a Greek-Cypriot Sample
Andry Vrachimi Souroulla1, Georgia Panayiotou1
1Department of Psychology, University of Cyprus, Cyprus
Correspondence: Andry Vrachimi Souroulla, Department of Psychology, University of Cyprus, Cyprus.
Received: December 6, 2016 Accepted: January 6, 2017 Online Published: January 16, 2017 doi:10.11114/jets.v5i2.2048 URL: http://dx.doi.org/10.11114/jets.v5i2.2048
Abstract
The Hellenic WISC-III (Wechsler, 1997) is currently the only standardized and officially published tool for the assessment of the intelligence of children and adolescents in Greece. The test is also used with caution in Cyprus, among Greek speakers, but no specific norms exist for use in this country. The purpose of this study was to provide evidence of the qualities of the test using an independent Greek-Cypriot sample and to support its utility in the psychological evaluation of Greek speaking children in Cyprus. The participants were 151 public school children aged 9:1 to 15:8 years. Correlations between the subtests of the WISC-III and the Scale IQs and, also, correlations between scores on the WISC-III and achievement measures as well as the educational level of parents provided evidence of convergent - construct validity. Low correlations between scores on the WISC-III and measures of psychopathology supported the instruments divergent - construct validity. Also, an exploratory factor analysis further supported the construct validity of the test. Moreover, the study provided evidence in support of the predictive validity and clinical utility of the test by examining the cognitive profiles on the Hellenic WISC-III of children with learning difficulties and identifying the WISC-III subscale scores that best distinguish them. This evidence is very important for clinicians in Cyprus but, also, further supports the international evidence about the utility of the Wechsler ability scales.
Keywords: Hellenic WISC-III, validity, clinical utility 1. Introduction
The Wechsler Intelligence Scale for Children – Third Edition (WISC-III) is the most popular measure of children’s intelligence (Muniz, Bartram, Evers, Boben, Matesic & Glabeke, 2001; Wilson & Rechsly, 1996). It has been translated and adapted in many countries and languages worldwide, with the aim of simultaneously taking into consideration cultural differences, while retaining the high psychometric qualities of the instrument. Recently, in many countries, it has been superseded by newer versions of the test.
The Hellenic WISC-III (Wechsler, 1997), which is based on the English version (WISC-III UK; Wechsler, 1996), is currently the only standardized and officially published tool for the assessment of intelligence, for use in the Greek population. It retains the same structure as the USA and UK version, i.e., 13 subtests that measure different dimensions of cognitive ability (Wechsler, 1997) and result into two scale IQs, the Performance IQ (PIQ) and the Verbal IQ (VIQ), in addition to a Full Scale IQ (FSIQ). Evidence in support of the psychometric properties of the Hellenic test is published in its manual (Wechsler, 1997). Moreover, Georgas, Weiss, Vijver, and Saklofske (2003) and, also, Giannitsas and Milonas (2004) further provided strong evidence of the instrument’s qualities. However, not much independent evidence has been published in support of the instrument’s psychometric properties (Filippatou & Livaniou, 2005; Rotsika, Vlassopoulou, Rogkakou, Sini, Legaki, Pexlivanidou & Anagnostopoulos, 2006; Rotsika, Vlassopoulos, Legaki, Sini, Rogakou, Sakellariou, Pehlivanidou & Anagnostopoulos, 2009).
The test is also used with caution in Cyprus, among Greek speakers, but no specific norms exist for use in this country. Since Greek-Cypriot children were not part of the standardization sample, Greek norms may not be absolutely appropriate for use in Cyprus, while the widespread use of a local dialect makes the validity of the verbal scales debatable.
the Greek context, but also adds to the abundant international evidence for the utility and value of the Wechsler ability scales.
1.1 Construct Validity of the American WISC-III
Ample evidence exists in the literature supporting the psychometric value of the WISC-III as this was published in the USA. Evidence of convergent validity is reported in the manual of the WISC-III (Wechsler, 1991), in the form of significant inter-correlations between the subtests, which were found to range from a low .14 to a high .70. Also, average correlations between each of the Verbal Scale subtests and the VIQ ranged from .42 to .78, and those between the Performance Scale subtests and the PIQ ranged from .32 to .65, indicating that each subtest measures the same construct as the overall scale, but the subtests of the Verbal Scale have more in common than the Performance Subtests. Average correlations between each of the individual subtests and the FSIQ ranged from .31 to .74, and this evidence was used to support the WISC-III as a measure of general mental ability (Sattler, 2001). Moreover, correlations between WISC-III FIQ, VIQ & PIQ, and parent education, indicated that students whose parents had a higher level of education, had, also, higher mean IQs (Donders, 1996; Graniel & O’Donnell, 1991), further adding support to the convergent validity of the instrument. Recently, higher scores on the Italian WISC-III and especially VIQ were also found to be associated with higher level of parental education (Cianci, Orsini, Hulbert & Pezzuti, 2013). The convergent validity of the WISC-III was further supported through correlations with measures of achievement such as the Wide Range Achievement Test, 3rd Edition and the Wechsler Individual Achievement Test, and, also, with school grades (e.g., Slate, 1994; Smith, Smith & Smithson, 1995; Weiss & Prifitera, 1995).
Low to near zero correlations between the WISC-III and measures of psychopathology, the Adjustment Scales for Children and Adolescents (ASCA), have been reported as evidence of divergent validity, given that the instruments measure different and theoretically independent constructs (Canivez, Neitzel & Martin, 2005).
Internal structure evidence of a test is considered to be a crucial source for demonstrating its construct validity. Factor analysis constitutes one very important statistical approach to gather information in favor of the structural validity of a test (Benson, 1998). The factor structure of the WISC-III in the USA indicates that there is a general factor, the FSIQ reflecting “g” or a general, common source of variance in all measured abilities, and two sub factors, the VIQ, measuring verbal ability, comprehension, and crystallized intelligence, and the PIQ measuring nonverbal ability, perceptual organization and fluid intelligence (Sattler, 2001). The existence of these factors is based on the meaning of the subtests and is supported by the correlations of the subtests with the corresponding factors and, also, by the loadings of the subtests to the factors.
Also, a four-factor model is presented in the manual, based on a factor analysis of the standardization sample. The four factors-indices, are labeled: (1) Verbal Comprehension - VCI (Information, Similarities, Vocabulary, Comprehension), (2) Perceptual Organization - POI (Picture Completion, Picture Arrangement, Block Design, Object Assembly), (3) Freedom from Distractibility - FDI (Arithmetic, Digit Span), and (4) Processing Speed - PSI (Coding, Symbol Search; Wechsler, 1991). The four-factor model has been extensively studied and received support in independent replication studies with both normal and clinical samples (e.g., Blaha & Wallbrown, 1996; Donders & Warschausky, 1997; Grice & Logerquist, 1999; Maller & Ferron, 1997). However, other researchers called into question this structure (e.g., Kush, 1996; Reinecke, Beebe & Stein, 1999), mostly regarding the existence of the FDI. In order to clarify this issue, Sattler (2001), conducted a factor analysis using the standardization data and concluded that a four-factor model holds overall, but there is little support for the FDI for some ages.
1.2 Construct Validity of the Hellenic WISC-III
Psychometric evidence in support of the validity of the Hellenic WISC-III is similarly reported in this test’s manual. Intercorrelations between the 13 subtests for the standardization sample ranged from a low .12 to a high .60, values which are similar to the USA data. The intercorrelations between the Performance subtests were lower than those between the Verbal subtests, consistent to the findings from the USA (Georgas, Weiss, Vijver & Saklofske, 2003). Low correlations were found between father’s and mother’s education and performance on the subtests, IQ scores and index scores. Correlations on the subtests were on average .20 and on the IQs ranged from .13 to .36 (Georgas et al., 2003). These data supported the convergent validity of the Hellenic WISC-III.
In order to further assess the convergent validity of the WISC-III, performance on the WISC-III was correlated with school marks. The average correlations across all ages were .31 for VIQ, .22 for PIQ and .30 for FSIQ (Georgas et al., 2003). No published studies, to our knowledge, have supported the convergent validity of the Hellenic WISC-III using standardized achievement tests.
no evidence for the FDI, and Arithmetic contributed substantially to the VCI instead of the FDI. Researchers in Greece attributed this difference to the fact that in the Greek educational system, the teaching of mathematics emphasizes the use of analytical cognitive skills instead of the use of short term memory skills (Giannitsas & Milonas, 2004), which may explain the loading of Arithmetic on VCI. It has to be noted that the factor structure of the test was similar to that of the French adaptation (Gregoire, 2001).
1.3 Predictive Validity and Clinical Utility of the American WISC-III
Profile interpretation, i.e., interpretation of the subtest scores of the WISC-III has been a common clinical practice for diagnosis and educational placement. A study that surveyed nationwide practitioners indicated regular use of the profile analysis. Also, practitioners rated profile analysis as the most useful feature of the WISC-III (Pheiffer, Reddy, Kletzel, Schmelzer & Boyer, 2000). Despite of its popularity, however, much disagreement exists about the clinical utility of this approach, because of the controversial evidence that exists. Thus, some argue that only composite scores i.e., VIQs, PIQs and factor scores can be valid and reliable structures (Bray, Kehle & Hintze, 1998; Donders, 1996; McDermott, Fantuzzo & Glutting, 1990) that can be used to predict academic problems. On the other hand, the supporters of profile analysis argue that analysis on the level of the subtests can provide valuable information regarding the individual’s strengths and weaknesses (Kramer, 1993; Sattler, 2001). In spite of the controversy around this issue, further evidence regarding the predictive validity of the WISC-III can be added if it is found that certain profiles or combinations of scores can differentiate children with learning problems.
Studies with special groups i.e., children with Learning Disabilities (LD), Attention Deficit Hyperactivity Disorder (ADHD), Mental Retardation, Anxiety/Depression, Asperger Syndrome, Autism, suggested that index and subtest profiles could be useful diagnostic indicators. Among these indicators are differences between the normal and clinical samples in general cognitive performance, the direction of a significant discrepancy between the Verbal and Performance Scale, the rank ordering of subtest standard scores and the four Indices, FDI, POI, VCI and PSI (Mayes & Calhoun, 2003; Mayes & Calhoun, 2006; Mayes, Calhoun & Crowell, 1998; Tiholov, Zawallich & Janzen, 1996; Ward, Ward, Glutting & Hatt, 1999). In this line of work, researchers provided evidence in support of the diagnostic utility of the ACID/ACIDS profile, which refers to low scores on the Arithmetic, Coding, Information & Digit Span + Symbol Search subtests, and the SCAD profile which refers to low scores on the Symbol Search, Coding, Arithmetic & Digit Span subtests (Prifitera & Dersh, 1993; Wechsler, 1991), particularly in diagnosing ADHD children. Other researchers (e.g., Ward, Ward, Hatt, Young & Mollner, 1995) did not recommend the use of these profiles as a sole criterion for diagnosis in referred populations, but as confirmatory evidence.
As far as LD is concerned, there is evidence suggesting that the WISC-III can provide some useful information about the cognitive profile of these children. According to Mayes, Calhoun and Crowell (1998), students with LD scored lower on the FDI relative to FSIQ than children without LD, and the CAD profile was evident (i.e., lower scores in Coding, Arithmetic & Digit Span) in their mean scores, in contrast to the mean scores of the non learning disabled students. Also, the subtests with the lowest scores for students with LD were Digit Span, Arithmetic, Coding, Symbols and Block Design. Consistent with the above findings, Krane and Tannock (2001) suggested that low FDI scores may signal learning problems, particularly related to arithmetic, language and working memory difficulties. Also, Mayes and Calhoun (2004) identified an exclusive WISC-III profile for students with ADHD and learning disabled students among other clinical populations: Low Coding or FDI without low Comprehension. Additionally, Prifitera and Dersh (1993) reported for their learning disabled sample, higher POI scores than VCI scores and lower FDI and PSI scores. Recently, Moura, Simoes and Perreira (2014) found that children with developmental dyslexia had significantly lower FSIQ and VIQ scores compared to normal readers. Also, dyslexic children showed significantly lower VCI and PSI scores compared to WISC-III index scores. Moreover, children with dyslexia, scored significantly lower than normal readers in the subtests included in the FDI, ACID and SCAD profiles. This was also found for the composite scores. Finally, FDI, ACID or SCAD composite scores had a moderate accuracy in correctly discriminating dyslexic readers from normal ones (Moura, Simoes & Perreira 2014).
According to Sattler (2001), the subtest rank ordering of mean standard scores from the easiest to the hardest for learning disabled students was the following: Picture Completion, Picture Arrangement, Block Design, Object Assembly, Similarities, Comprehension, Vocabulary, Coding, Digit Span, Arithmetic and Information. Similarly, Digit Span and Information were two of the most difficult subtests in the study of Moura, Simoes and Perreira (2014), followed by Similarities, Symbol Search, Picture Completion and Arithmetic.
Knowledge (Information, Arithmetic, Vocabulary; Daley & Nagle, 1996). Prifitera and Derch (1993) supported that the Bannatyne’s pattern is useful for diagnostic purposes.
On the other hand, many studies have questioned the validity of profile analysis and its use for LD diagnostic purposes. More specifically, Slate (1995) indicated that IQ discrepancies, and higher PIQ than VIQ, are not diagnostic indicators of abnormality, but rather the rule of thumb. Additionally, results in the study of Moura, Simoes and Perreira (2014) revealed that the practical value of the VIQ-PIQ discrepancy was minimal for the differential diagnosis of dyslexic from normal readers. Also, the Bannatyne´s profile in the same study, though evident, was not useful for diagnostic purposes. Low diagnostic utility was also supported for the Bannatyne WISC-III pattern in the study of Smith and Watkins (2004). Moreover, Naglieri, Goldstein, Iseman and Schwebach (2003) found no differences on the WISC-III between children with ADHD and children with Anxiety /Depression. Other studies provided little or no support for the use of WISC-III subtest pattern in the diagnosis of LD (Daley & Nagle, 1996; Watkins, 1999; Watkins & Glutting, 2000). Also, the SCAD and ACID profiles were not found to be valid diagnostic indicators or important predictors of academic achievement (Watkins, Kush & Glutting, 1997; Watkins, Kush & Glutting, 1997).
1.4 Predictive Validity and Clinical Utility of the Hellenic WISC-III
The research on cognitive profiles of clinical samples on the Hellenic WISC-III is limited. A study with 118 children with LD found that their mean FSIQ, VIQ and PIQ, was lower than those of the standardization sample. Also, the highest mean scores were on Comprehension and Similarities and the lowest on Digit Span and Arithmetic. Scores on Picture Completion, Similarities, Vocabulary, Comprehension and Symbol Search were not different from the standardization sample, whereas there was a significant difference in all the other subtests. Moreover, there was no significant difference between PIQ and VIQ, and the direction of this difference was not consistent. Due to this finding, researchers concluded that the learning disabled population is not homogeneous and that students with LD have a variety of cognitive weaknesses (Rotsika et al., 2006).
In another study (Filippatou & Livaniou, 2006), the cognitive profiles of 114 children with ADHD, LD and language disorders were examined, using scores on the 10 main subtests of the WISC-III and the Digit Span. The study showed that the ACID profile was evident in all the three groups and the groups could not be accurately identified based on this indicator. Children with language disorders had lower attainments on VIQ and FSIQ, and Vocabulary and Similarities could discriminate this group from the other two groups. Both ADHD and learning disabled groups scored lower on Coding. In addition, the LD group scored lower on Information. However, the two groups could not be identified based only on their performance on the WISC-III.
Rotsika and colleagues (2009) provided additional evidence regarding the cognitive profiles on the Hellenic WISC-III. Their sample consisted of 180 learning disabled children and adolescents. In accordance to their previous results (Rotsika et al., 2006), the lowest means were on Digit Span and Arithmetic. The highest means were on Similarities and Picture Completion, whereas Rotsika and colleagues (2006) found that the easiest subtests were Comprehension and Similarities. Also, 18.3 % had a significant higher VIQ, while 20 % had a significant higher PIQ. Due to the fact that the direction of the differences between VIQ and PIQ was not stable, the researchers concluded that the Greek children with LD present various cognitive deficits.
1.5 The Present Study
The present study was undertaken in order to examine the psychometric properties of the Hellenic WISC-III with a sample of Greek-Cypriot children and adolescents in Cyprus. Specifically, the study examined the associations among the subtests and between the subtests and Scale IQs. Also, it examined the correlations of the Hellenic WISC-III scores with measures of achievement, with teachers’ judgments regarding the academic level of their students and the educational level of the parents. These results were used to provide evidence in the domain of the convergent - construct validity of the test. Also, low correlations with measures of child psychopathology would add evidence for the divergent- construct validity of the test.
The question whether the empirical analysis of its components supports the structure proposed by its developer across a variety of test takers in different countries, is particularly important. This is due to the fact that differences in scoring between the scales and the various factors have been used diagnostically in the everyday practice with individual clients. For example, a VIQ-PIQ discrepancy may be used to generate hypotheses regarding the possibility of a brain injury or lower scores on the PSI may signal for problems with fine motor skills or cognitive flexibility (e.g., Sattler, 2001). Thus, another purpose of this study was to investigate the factor structure of the Hellenic WISC-III in order to add to the evidence regarding the construct validity of the test. Hence, factor analysis was expected to demonstrate the basic domains of ability measured by the test and to establish that these constructs also exist in the Hellenic version.
children with LD. The research in LD diagnostic indicators is even more useful in countries such as Greece and Cyprus, where tests for the assessment of achievement are scarce. The clinicians’ practice is to maximize the diagnostic data derived from the only officially standardized test of intelligence, the WISC-III. Thus, they attempt to interpret indicators, such as large discrepancies between VIQ and PIQ and subtest patterns, in order to have a greater insight and to add to the evidence about clinical abnormality. Also, profile analysis at the subtest level is supposed to provide a better understanding about a child’s strengths and weaknesses, in order to better guide treatment and educational programming. Identification of the cognitive profiles of Greek-Cypriot learning disabled children on the Hellenic WISC-III, apart from supporting the clinical utility of the test, was expected to support the test’s predictive validity by demonstrating its ability to predict related but independent constructs such as learning and school achievement.
2. Method
2.1 Participants
A total of 151 Greek-Cypriot children and adolescents served as participants. All of them were participants in a research project which investigated their cognitive, emotional and social profiles in Cyprus. The age of the students ranged from 9:1 years to 15:8 years. Their mean age was 11:11 years. Specifically for age 9, n = 6, for age 10, n = 44, for age 11, n = 42, for age 12, n = 18, for age 13, n = 21, for age 14, n = 16 and for age 15, n = 4. Of them, 79 were boys and 72 were girls. Ninety one were students in primary schools and 60 were students in secondary schools. Of the 151, 104 (68.87 %) were selected from rural areas and 47 from cities.
Twenty two children and adolescents were drawn from the total sample of the 151 children as children with low academic achievement. The criteria for the selection of these 22 students were the following: low scores on the achievement test (Quicktest; Wechsler, 1996) comparatively to their peers (i.e., at least one SD below their peers’ mean scores) and, also, an FSIQ of at least 79 in order to exclude children with mental retardation. Moreover, parents and teacher reports had to agree that the children exhibited learning difficulties. Because of the strictness of these criteria, it is assumed that this sample of children showing school difficulties does not differ substantially from formally diagnosed samples of learning disabled students.
2.2 Instruments
Participants were administered a large battery of measures in the context of the larger research project. For the purposes of this study, measures were selected for their fit with the purposes of establishing the convergent, divergent and predictive validity of the test, for their availability and standardization in the Greek language and for their age appropriateness and brevity. The following tests were used: subtests of the Hellenic WISC-III (Wechsler, 1997), the Wechsler Quicktest (Wechsler, 1996), the Child Behavior Checklist-CBCL/Youth Self Report-YSR (Achenbach & Rescorla, 2001) and teachers´ ratings regarding their students´ academic performance.
2.2.1 WISC-III (Wechsler, 1997)
The ten main subtests of the Hellenic WISC-III plus Mazes (n = 151 participants) were administered to the participants. 2.2.2 Wechsler Quicktest (Wechsler, 1996)
This is a brief measure of academic achievement in the areas of Word Reading, Spelling and Mathematical Reasoning. It was selected as a well-established brief measure of academic achievement and because it is the only available standardized achievement measure available in Cyprus. The test was translated, adapted into Greek and field-tested in a Greek-Cypriot sample of children and adolescents, in order to provide preliminary evidence as to its promise and potential for use in the Greek-Cypriot population. Initial data exist that support its psychometric properties in Greek (Vrachimi - Souroulla, Panayiotou, Kokkinos & Lamprianou, 2011). The Quicktest was administered to 135 participants (89 % of the sample) mostly due to time constraints for some of the child participants.
2.2.3 CBCL-YSR (Achenbach & Rescorla, 2001)
band scales, i.e., Internalizing and Externalizing problems and, also, a total problem score. The psychometric qualities of the Greek YSR and CBCL are also established (Roussou, 2003). In the present study YSR and CBCL were administered to the children and their parents respectively.
2.2.4 Teachers’ Ratings
Teachers provided ratings in the context of a telephone interview regarding their students’ academic performance in a scale from 1 to 10, where 10 was equivalent to the best performance. Teachers’ ratings were available for 116 children (77 %). As mentioned above, school grades have been used to support the construct validity of the WISC-III in the USA and Greece (e.g., Georgas et al., 2003; Slate, 1994) since one of the primary purposes of an intelligence test is to predict school achievement. Here, teachers´ ratings were used instead of school grades because no formal grading system exists for students in the primary education. The validity of teachers’ judgments compared to standardized achievement scores was verified in many studies (e.g., Kenny & Chekaluk, 1993; Sofie & Riccio, 2002). The utility of teachers as tests has been supported in the Cyprus context as well (Vrachimi-Souroulla, Panayiotou & Kokkinos, 2009).
2.3 Procedure
Permission to collect data from elementary and high schools was obtained from the Ministry of Education and Culture in Cyprus. Parents or legal guardians provided informed consent for the assessment and all the data were collected anonymously to protect the identity of individual students. The WISC-III and the Quicktest were individualized administered during two test sessions in the Psychology Laboratory at the University of Cyprus, by well-trained graduate students in the field of School Psychology. The YSR and the CBCL were completed by the students and by one or both parents, correspondingly, during the two sessions.
3. Results
3.1 Construct Validity of the Hellenic WISC-III based on the Greek-Cypriot sample
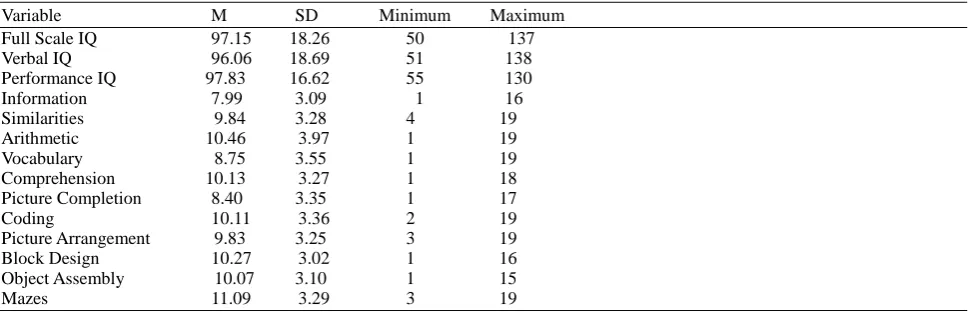
Table 1. Standard Score Means, Standard Deviations, and Ranges for the WISC-III FSIQ, PIQ, VIQ and subtests
Variable M SD Minimum Maximum
Full Scale IQ 97.15 18.26 50 137
Verbal IQ 96.06 18.69 51 138 Performance IQ 97.83 16.62 55 130 Information 7.99 3.09 1 16 Similarities 9.84 3.28 4 19
Arithmetic 10.46 3.97 1 19
Vocabulary 8.75 3.55 1 19
Comprehension 10.13 3.27 1 18
Picture Completion 8.40 3.35 1 17
Coding 10.11 3.36 2 19
Picture Arrangement 9.83 3.25 3 19
Block Design 10.27 3.02 1 16
Object Assembly 10.07 3.10 1 15
Mazes 11.09 3.29 3 19
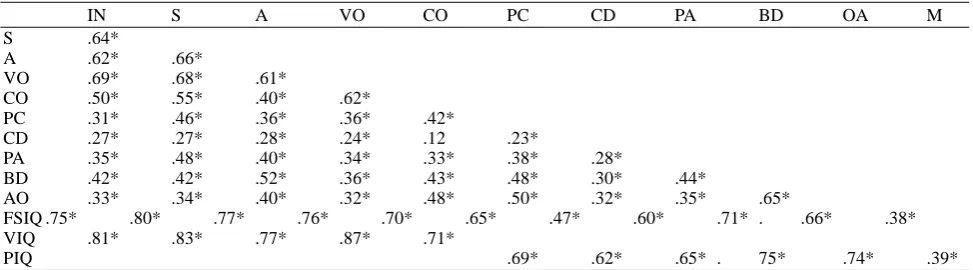
Descriptive statistics for the FSIQ, VIQ, PIQ and the subtests are presented in Table 1. Table 2 presents inter-correlations between the subtests and correlations between the subtests and Scale IQs, in support of the instrument’s divergent validity. Correlations between the 11 subtests ranged from a low .12, between Comprehension and Coding, to a high .69. All correlations, except the one between Comprehension and Coding, were significant at the .01 level. The highest inter-correlations were between Vocabulary and Information, Vocabulary and Similarities, Similarities and Arithmetic, Similarities and Information, Arithmetic and Information, Vocabulary and Arithmetic, and Comprehension and Vocabulary. The lowest inter-correlations were between Comprehension and Coding, Mazes and Information, Mazes and Coding, Mazes and Vocabulary, and Mazes and Similarities, showing that the strength of the correlations is larger among subtests that are expected to fall on the psame scale than across scales.
Table 2. Correlations among WISC-III subtests and between subtests and WISC-III scale scores
IN S A VO CO PC CD PA BD OA M
S .64*
A .62* .66*
VO .69* .68* .61*
CO .50* .55* .40* .62*
PC .31* .46* .36* .36* .42*
CD .27* .27* .28* .24* .12 .23*
PA .35* .48* .40* .34* .33* .38* .28*
BD .42* .42* .52* .36* .43* .48* .30* .44*
AO .33* .34* .40* .32* .48* .50* .32* .35* .65*
FSIQ .75* .80* .77* .76* .70* .65* .47* .60* .71* . .66* .38* VIQ .81* .83* .77* .87* .71*
PIQ .69* .62* .65* . 75* .74* .39*
Note: IN = Information; S = Similarities; A = Arithmetic; VO = Vocabulary; CO = Comprehension; PC = Picture Completion; CD = Coding; PA = Picture Arrangement; BD = Block Design; OA = Object Assembly; M = Mazes *p < .01
Table 3. Correlations between FSIQ, VIQ, PIQ, and the Quicktest and teachers’ ratings FSIQ VIQ PIQ
Quick test Reading subtest .24* .25* .14 Quick test Spelling subtest .43* .49* .23*
Quick test Maths subtest .68* .70* .48*
Teachers’ ratings on Greek .65* .65* .47* Teachers’ ratings on Maths .65* .62* .48* *p < .01
Table 3 displays correlations between the FSIQ, VIQ and PIQ, and scores on the achievement measures, and with teachers’ ratings of students’ academic performance. There was only one non-significant correlation between the Reading Subtest of the Quicktest and the PIQ. The highest correlations were between the Maths subtest of the Quicktest and the WISC-III scale scores. More specifically, the highest correlation was between the Maths subtest and VIQ, followed by FSIQ and PIQ. Correlations between the FSIQ, VIQ and PIQ and the teachers’ ratings of their students’ academic performance were all significant and substantial (see Table 3).
Further evidence for the convergent validity of the test provided the correlations between father’s and mother’s educational level and the performance of their child on the WISC-III. Scale scores on the WISC-III were significantly correlated with the educational level of parents. More specifically, the correlation between the FSIQ and the educational level of the mother and the father of the child was .34 (p < .01). The correlation between the VIQ and the educational level of the mother and the father was .32 and .31 respectively (p < .01). There was, also, a significant correlation between the PIQ and the educational level of the mother (r = .26, p < .01). However, the correlation between PIQ and paternal educational level was not significant.
As expected, the correlation between scales of the WISC-III and measures of child psychopathology from the CBCL were non-significant and low, thus supporting the divergent validity of the test, i.e., for Anxious/Depressed, Somatic and Attention/Hyperactivity problems, Delinquent/Aggressive behavior and Eating Problems correlations ranged from -.01 to .16. Only one significant correlation was found between depression and the FSIQ (r = .19, p < .05).
The WISC-III subtests were factor analyzed using the maximum Likelihood method for extracting factors. This method was the same as in the U.S.A., UK and Greek standardizations. The Exploratory Factor Analyses (EFA) using the Oblimin rotation resulted in two factors with eigenvalues greater than 1.0, which accounted for 58.75 % of the variance. The content of the two factors was the same as the content of the Verbal and Performance Scales as described in Sattler (2001) and elsewhere.
Table 4 presents the factor loadings, eigenvalues and variance explained by the two factors. A Varimax rotation of the factors was also performed. Results of this analysis were similar to those of the Oblimin rotation, although with lower loadings.
A forced one factor solution of the 11 subtests resulted in a factor with an eigenvalue 4.87 that accounted for 48.66 % of the variance. The loadings of the subtests ranged from .35 (Coding) to .82 (Similarities). A forced two-factor solution of the 10 main subtests resulted again to the two previously reported well-defined factors. Finally, an EFA was run only on the non-referred children (n = 93). Results from this analysis, using both the Varimax and the Oblimin rotation, indicated the existence of the two well-defined factors. An EFA using the sample of referred children was not performed because of the small number of children in this group (n = 58).
Table 4. Maximum Likelihood Oblimin Factor Loadings, Eigenvalues and Variance Explained
WISC-III Subtest Factor 1 Factor 2
Information .80
Similarities .83
Arithmetic .76
Vocabulary .85
Comprehension .67
Picture Completion .65
Coding .42
Picture Arrangement .51
Block Design .78
Object Assembly .82
Mazes .45
Eigenvalue 5.15 1.31
Variance explained 46.82 11.94
3.2 Predictive Validity and Clinical Utility of the Hellenic WISC-III
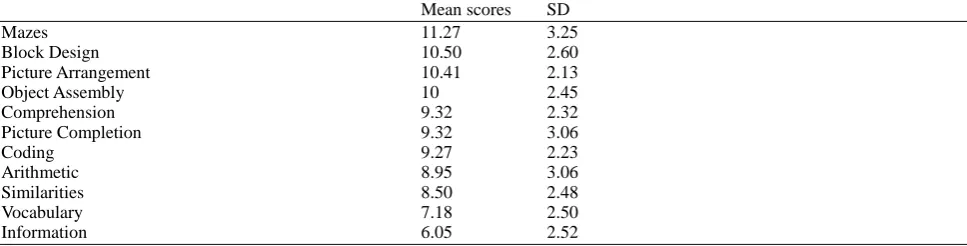
Table 5. Mean scores and standard deviations on the WISC-III subtests of children with low academic achievement
Mean scores SD
Mazes 11.27 3.25
Block Design 10.50 2.60
Picture Arrangement 10.41 2.13
Object Assembly 10 2.45
Comprehension 9.32 2.32
Picture Completion 9.32 3.06
Coding 9.27 2.23
Arithmetic 8.95 3.06
Similarities 8.50 2.48
Vocabulary 7.18 2.50
Information 6.05 2.52
Table 5 presents the mean scores and standard deviations of children with low academic achievement on the 10 main subtests and the Mazes. The easiest subtests were three Performance subtests: Mazes, Block Design and Picture Arrangement. The mean scores for these subtests were 11.27, 10.50 and 10.41 respectively. The most difficult subtests for this group of children were three Verbal subtests: Information, Vocabulary and Similarities. The mean scores for these subtests were 6.05, 7.18 and 8.50 respectively.
Mean FSIQ, VIQ and PIQ scores for children with low academic achievement were 91.91 (SD = 10.44), 87 (SD = 11.57) and 99.23 (SD = 12.09) correspondingly. A t test revealed a significant difference between the above VIQ score and VIQ scores of our total sample in Cyprus (t = -2.31, p <. 05) but not between the FSIQ and PIQ scores. Also a t test showed significant differences between scores of the children with low academic achievement and the scores of our total sample for Information (t = -3.11, p < .05) , Vocabulary (t = -2.06, p < .05), Similarities (t = -2.00, p < .05) and Arithmetic (t = -2.21, p < .05) but not between the rest of the subtests.
Furthermore, 59 % of the children with low academic achievement exhibited a significant discrepancy of 11 or more points between their VIQ and PIQ. Of them the 92.31 % had a higher PIQ than their VIQ. A significant difference was found between VIQ and PIQ (t = -3.84, p = .000).
Based on the Bannatyne subtest categorization scheme, children with low academic performance had indeed higher scores in the Spatial category (Picture Completion, Block Design, Object Assembly), intermediate scores in the Verbal Conceptual Category (Similarities, Vocabulary, Comprehension), and the lowest scores in the Acquired Knowledge (Information, Arithmetic, Vocabulary).
so as to examine whether they can successfully categorize the two groups of children, with and without low academic achievement. The logistic regression models indicated that the VIQ could identify the students with low academic achievement with an accuracy of 81.8 %, and the matched group with an accuracy of 59.1 %. Also, the significantly higher PIQ than VIQ could identify students with low academic achievement with an accuracy of 54.5 %, and the matched group with an accuracy of 81.8 %. Moreover, scores on the five subtests of the WISC-III, i.e., Information, Vocabulary, Similarities, Arithmetic and Coding could correctly identify the 77.3 % of the students with low academic achievement and the 72.7 % of the matched group. Using the Backward, Wald analyses, the final logistic regression model, which included only Information, could identify students with low academic achievement with an accuracy of 72.7 %, and the matched group with an accuracy of 68.2 %. The correct identification percentage for the first group was the same, if the analyses included the three subtests, Arithmetic, Information and Coding. As mentioned earlier, these three subtests are used to form the LD indicator ACID (Digit Span is missing). Using the Bannatyne’s categorizations, the Spatial Category and Acquired Knowledge could better identify the 77.3 % of the students with low academic achievement, and the 81.8 % of the matched group.
4. Discussion
The purpose of the present study was to provide evidence in support of the psychometric properties of the Hellenic WISC-III, using data from the administration of the test to a sample of Greek-Cypriot children and adolescents.
Firstly, the construct validity of the test was examined. As expected, the inter-correlations between the 11 subtests that were administered in the present study were almost all significant and supported the construct validity of the Hellenic WISC-III. More specifically, the inter-correlations between the 11 subtests of the Hellenic WISC-III were similar to the inter-correlations found between the 13 subtests of the WISC-III in USA (Wechsler, 1991) and Greece (Georgas et al., 2003). Also, as one would expect for subtests that are purported to measure the same construct, among the highest correlations in the present study were those between Vocabulary and Information, Vocabulary and Similarities, and Information and Similarities, as also found for the standardization sample of the WISC-III in USA and Greece. The pattern of the lowest correlations was, also, similar with that obtained in USA and Greece (Georgas et al., 2003; Sattler, 2001). The lowest inter-correlations were between Mazes and the other 10 subtests. Low correlations were, also, found in our sample between Coding and the other subtests of the WISC-III administered in this study a finding that is also similar to prior evidence (e.g., Sattler, 2001).
Moreover, the higher correlations among the Verbal Scale subtests, as compared to the Performance Scale subtests, and, also between each of the Verbal Scale subtests and the VIQ, than each of the Performance Scale subtests and the PIQ were in accordance with previous findings (Georgas et al., 2003; Wechsler, 1991). As noted by other researchers, these findings indicate that the Verbal Scale subtest have probably more in common with each other, than the Performance Scale subtests (Sattler, 2001). The pattern of the correlations between each of the 11 subtests and the FSIQ was also similar with that in the USA, since the five standard Verbal Scale subtests, plus Block Design were more highly correlated to the FSIQ than the other subtests. Similarly, Vocabulary had the highest correlation with the VIQ and Block Design had the highest correlation with the PIQ, again in accordance with previous findings using the standardization sample in USA. The correlations between the subtests and the FSIQ support the use of the WISC-III as a measure of general intelligence ability (Sattler, 2001).
Furthermore, the convergent - construct validity of the WISC-III was supported through correlations with measures of achievement i.e., scores on the Quicktest (Wechsler, 1996) and teachers’ ratings of students’ performance. Another measure of the convergent validity of the test was the correlations with the educational level of the parents. These findings were, also, in accordance with findings using the WISC-III in the USA and Greece (e.g., Donders, 1996; Georgas et al., 2003; Graniel & O’Donnell, 1991; Slate, 1994; Smith, Smith & Smithson, 1995; Weiss & Prifitera, 1995) and also in Italy (Cianci, Orsini, Hulbert & Pezzuti, 2013).
educational emphasis of each curriculum. Therefore this study lends support to the claim of Giannitsas and Milonas (2004) and Georgas et al., (2003) that the emergent factor structure of the WISC-III is in part affected by the way each content area is taught within the particular curriculum, a finding that ought to be verified in other cultures as well. This study, cannot examine whether the educational system emphasizes more the use of short memory skills (e.g., Georgas et al., 2003), since the Digit Span subtest was not administered and the existence of FDI could not be verified.
In the present study it was not viable to examine whether a three or a four factor solution is supported because of the limitation that the entire 13 subtests of the WISC-III were not administered to our sample. It has to be noticed, however, that the two primary factors of VCI and POI did not emerge, even if the eight subtests that usually yield these two factors were administered along with the rest of the two main subtests. Given these results, and the previous results from Greek factor analytic studies on the Hellenic WISC-III, the practice of factor interpretation of the obtained scores with Greek-Cypriot students may not be at this point empirically supported, beyond the interpretation of VCI and POI. The interpretation of VCI and POI, however, may not add substantial explanatory power to that provided by VIQ and PIQ. The interpretation of the two remaining factors will only be warranted after the collection and factor analysis of further data in Cyprus, which include all subtests. These findings should be taken into serious consideration by clinicians who use this test in the Greek-Cypriot context to avoid over-interpretation of test results through reliance on unreliable data. Overall, the results of the factor analysis supported the construct validity of the Hellenic WISC-III and, also, indicated that the WISC-III FSIQ, VIQ and PIQ can be thought of as independent indices of intelligence. Based on empirical evidence, these structures can be interpreted in the context of the psychometric evaluation of children and adolescents in both Greece and Cyprus.
The low to near zero correlations between scores of the Hellenic WISC-III and measures of psychopathology were in agreement with previous findings using the WISC-III in USA (Canivez, Neitzel & Martin, 2005). These findings provided evidence in support of the divergent construct validity of the test, since intelligence and psychopathology are two theoretically distinct constructs.
The interpretation of indicators, such as large discrepancies between VIQ and PIQ, and subtest patterns has been a common clinical practice among practitioners in the area of LD identification and diagnosis. According to the findings of this study, the subtests with the highest standard scores for the students with low academic achievement were Block Design, Picture Arrangement, Object Assembly and Picture Completion. These results are in line with the rank ordering provided by Sattler (2001). Also, similar with Sattler (2001) are the results for the subtests with the lowest scores: Here the subtests with the lowest scores were Information, Vocabulary, Similarities, Arithmetic and Coding, and according to Sattler (2001) the subtests with the lowest scores were Information, Arithmetic, Digit Span, Coding and Vocabulary. In the present study, Digit Span was not administered. The findings regarding the lower scores on Arithmetic are also in line with the findings of Rotsika and colleagues (2006) and Rotsika and colleagues (2009) and findings regarding the low scores in Information agree with those of Filippatou and Livaniou (2006) and Moura and colleagues (2014). Also, the results regarding Arithmetic are in accordance with the research of Mayes and colleagues (1998), Mayes and Calhoun (2004) and Moura and colleagues (2014). The latter study found, in addition, lower scores on Similarities, in agreement with the present findings. The study of Mayes and colleagues (1998) also reported low scores on Block Design, which is not, however, in agreement with the findings of the present study.
Rotsika and colleagues (2006) reported lower FSIQ, VIQ and PIQ scores for their LD sample, comparatively to the scores of the standardization sample. In the present study this was only true for VIQ, in part because of the fact that low achievement students were selected so as to have at least average FIQ. Selecting participants with learning difficulties using this inclusion criterion is important for identifying the subtests that best differentiate these students, because otherwise results can be confounded by the inclusion of students who may be low achievers because of overall lo w cognitive ability. This methodological difficulty potentially explains in part the difference in results from some of the previous Greek findings (e.g., Rotsika et al., 2006). Present results indicate that in the Cypriot sample of learning disabled participants, VIQ was lower than PIQ. These results are, also, in agreement with previous findings (e.g., Prifitera & Dersh, 1993) and show this to be a valid indicator of LD status.
Furthermore, our findings provide support for the Bannatyne’s categorizations as an index of learning difficulties, since the highest scores for our low academic achievement sample were in the Spatial Category (Picture Completion, Block Design, Object Assembly), the intermediate scores in the Verbal Conceptual Category (Similarities, Vocabulary, Comprehension), and the lowest scores in the Acquired Knowledge (Information, Arithmetic, Vocabulary) (Daley & Nagle, 1996). Digit Span was not administered, thus the Sequencing Category (Arithmetic, Digit Span, and Coding) was not examined.
The Bannatyne’s categorizations, i.e. high scores on the Spatial Category and low scores on the Acquired Knowledge, could, also, identify well the students with low academic achievement. Higher PIQs than VIQs could moderately identify the students with low academic achievement. These indicators support the existing literature regarding the diagnostic utility of the WISC-III (e.g., Prifitera & Dersh, 1993; Ward et al., 1995) and point to the significance of administering these subscales, particularly Information, when evaluating students with potential LD. However, these results do not support the use of LD indicators as sole criterions for LD diagnosis as these differences would need to be substantiated with other information such as that provided by a valid achievement test and clinical interviews. Having used such a test for selecting our low achieving participants in this study may have provided clearer information regarding their cognitive profiles in comparison to previous Greek studies.
Overall, clinicians from Cyprus can feel assured that the Hellenic WISC-III measures the same constructs and behaves in a similar and adequate psychometric way when applied in Greek-Cypriot population, as it does when applied in Greece and internationally. FSIQ, VIQ and PIQ can be safely utilized as indices of intelligence in the context of the psychometric evaluation of children and adolescents, whereas clinicians should not over interpret POI and FDI, unless these structures are further supported in the future. Additionally, low scores on the Verbal Scale and/or low scores on Arithmetic, Coding and Information or low scores only on Information, as well as higher PIQs than VIQs can be used as valid indicators of low academic achievement and LD. It is recommended, however, that the above indicators are used during the diagnostic procedure along with valid achievement tests, clinical interviews and other sources of information. Moreover, strengths and weaknesses as shown by the profile analysis can guide intervention selection and implementation. It should be noted however, though this finding needs further replication, that scores from Cypriot students were by a few percentile points lower on most verbal scales, especially Information and Vocabulary and on VIQ, PIQ and FSIQ. This finding should be noted when interpreting results, primarily at the margins of typical and atypical functioning, so that students are properly diagnosed and categorized for purposes of receiving services. The study also adds to the international literature of the clinical utility of some well-established indices to be used as additional evidence and part of a global and multi-level assessment of LD.
Among the limitations of the present study was the fact that the supplementary subtests of Digit Span and Symbol Search were not administered, basically due to time constraints of some of the parents of our sample and, therefore, it was not possible to assess the hypotheses regarding the popular LD indicators of ACID, ACID, SCAD and CAD or the existence of the four indices of the WISC-III. Future studies could analyze data from the administration of all the 13 subtests of this tool in Cyprus and verify the evidence that exists internationally. Also, our sample included only a small number of children with low academic achievement and not with a formal diagnosis of LD. However and due to the strict criteria which were used here, it is assumed that our group of low academic achievers is similar to formally diagnosed LD students.
To conclude, the results, taken together support the construct validity of the Hellenic WISC-III when used in the Greek-Cypriot population. The study also supports the ability of various WISC-III indices, in its Hellenic version as well, to differentiate children with learning difficulties, providing strong support for its predictive and clinical utility in the Greek-Cypriot population. The study, also, adds to the existing international evidence regarding the psychometric qualities of this battery.
References
Achenbach, T. M., & Rescorla, L. A. (2001). Manual for the ASEBA school-age forms & profiles. Burlington, VT: University of Vermont, Research Center for Children, Youth & Families.
Benson, J. (1998). Developing a strong program of construct validation: A test anxiety example. Educational
Measurement: Issues and Practice,17, 10-22. https://doi.org/10.1111/j.1745-3992.1998.tb00616.x
Blaha, J., & Wallbrown, F. H. (1996). Hierarchical factor structure of the Wechsler Intelligence Scale for Children-III.
Psychological Assessment, 8, 214-219. https://doi.org/10.1037/1040-3590.8.2.214
Bray, M. A., Kehle, T. J., & Hintze, J. M. (1998). Profile analysis with the Wechsler Scales. Why does it persist; School
Psychology Quarterly, 19, 209-220. https://doi.org/10.1177/0143034398193002
Canivez, G. L. (1995). Validity of the Kaufman Brief Intelligence Test: Comparisons with the Wechsler Intelligence Scale for Children-Third Edition. Assessment, 2, 101-111.
Canivez, G. L., Neitzel, R., & Martin, B. E. (2005). Construct validity of the Kaufman Brief Intelligence Test, Wechsler Intelligence Scale for Children-Third Edition, and Adjustment Scales for Children and Adolescents. Journal of
Psychoeducational Assessment, 23, 15-34. https://doi.org/10.1177/073428290502300102
https://doi.org/10.1016/j.lindif.2013.09.009
Daley, C. E., & Nagle, R. J. (1996). Relevance of WISC-III indicators for assessment of Learning Disabilities. Journal
of Psychoeducational Assessment, 14, 320-333. https://doi.org/10.1177/073428299601400401
Donders, J. (1996). Cluster subtypes in the WISC-III standardization sample: Analysis of factor index scores.
Psychological Assessment, 8, 312-318. https://doi.org/10.1037/1040-3590.8.3.312
Donders, J., & Warschausky, S. (1997). WISC-III factor index score patterns after traumatic head injury in children.
Child Neuropsychology, 3, 71-78. https://doi.org/10.1080/09297049708401369
Filippatou, D. N., & Livaniou, E. A. (2005). Comorbidity and WISC-III profiles of Greek children with Attention Deficit Hyperactivity Disorder, Learning Disabilities, and Language Disorders. Psychological Report, 97, 485-504. https://doi.org/10.2466/pr0.97.6.485-504
Georgas, J., Paraskevopoulos, I. N., Besevegis, E., & Giannitsas, N. D. (1997). The Hellenic WISC-III. Athens: Psychometric Laboratory, University of Athens.
Georgas, J., Weiss, L. G., Vijver, F., & Saklofske, D. H. (2003). Culture and children’s intelligence. Cross-culture
analysis of the WISC-III. San Diego: CA Academic Press.
Giannitsas, N. D., & Milonas, K. (2004). Factor analysis of the Greek WISC-III: Domains of cognitive development.
Psychology,11, 422-443.
Graniel, M. L., & O' Donnell, L. (1991). Children’s WISC-III scores: Impact of parent education and home environment. San Antonio: The Psychological Corporation.
Gregoire, J. (2001). Factor structure of the French adaptation of the WISC-III: Three or four factors; International Journal of Testing, 1, 271-281. https://doi.org/10.1080/15305058.2001.9669475
Grice, J. W., Krohn, E. J., & Logerquist, S. (1999). Cross-validation of the WISC-III factor structure in two samples of children with Learning Disabilities. Journal of Psychoeducational Assessment, 17, 236-248. https://doi.org/10.1177/073428299901700304
Kenny, D. T., & Chekaluk, E. (1993). Early reading performance: A comparison of teacher-based and test-based assessments. Journal of Learning Disabilities, 26, 227-236. https://doi.org/10.1177/002221949302600403
Kramer, J. H. (1993). Interpretation of Individual Subtest Scores on the WISC-III. Psychological Assessment, 5,
193-196. https://doi.org/10.1037/1040-3590.5.2.193
Krane, E., & Tannock, R. (2001). WISC-III third factor indexes learning problems but not Attention Deficit/Hyperactivity Disorder. Journal of Attention Disorders, 5, 69-78. https://doi.org/10.1177/108705470100500201
Kush, J. C. (1996). Factor structure of the WISC-III for students with Learning Disabilities. Journal of
Psychoeducational Assessment, 14, 32-40. https://doi.org/10.1177/073428299601400103
Maller, S. J., & Ferron, J. (1997). WISC-III factor invariance across deaf and standardization samples. Educational and
Psychological Measurement, 57, 987-995. https://doi.org/10.1177/0013164497057006008
Mayes, S. D. Calhoun, S. L., & Crowell, E. W. (1998). WISC-III profiles for children with and without Learning
Disabilities. Psychology in the Schools, 35, 309-316.
https://doi.org/10.1002/(SICI)1520-6807(199810)35:4<309::AID-PITS1>3.0.CO;2-V
Mayes, S. D., & Calhoun, S. L. (2003). Analysis of WISC-III, Stanford-Binet: IV, and Academic Achievement Test Scores in children with Autism. Journal of Autism and Developmental Disorders, 33, 329-341. https://doi.org/10.1023/A:1024462719081
Mayes, S. D., & Calhoun, S. L. (2004). Similarities and differences in Wechsler Intelligence Scale for Children-Third Edition (WISC-III) profiles: Support for subtest analysis in clinical referrals. The Clinical Neuropsychologist, 18,
559-572. https://doi.org/10.1080/13854040490888530
Mayes, S. D., & Calhoun, S. L. (2006). WISC-IV and WISC-III profiles in children with ADHD. Journal of Attention
Disorders, 9, 486-493. https://doi.org/10.1177/1087054705283616
Mayes, S. D., Calhoun, S. L., & Crowell, E. W. (1998). WISC-III freedom from distractibility as a measure of attention in children with and without Attention Deficit Hyperactivity Disorder. Journal of Attention Disorders, 2, 217-227. https://doi.org/10.1177/108705479800200402
theory and practice. Journal of Psychoeducational Assessment, 8, 209-302. https://doi.org/10.1177/073428299000800307
Moura, O., Simoes, M.R., & Pereira, M. (2014). WISC-III Cognitive Profiles in Children with Developmental Dyslexia: Specific Cognitive Disability and Diagnostic Utility. Dyslexia, 20, 19-37. https://doi.org/10.1002/dys.1468
Muniz, J., Bartram, D., Evers, A., Boben, D., Matesic, K., & Glabeke, K. (2001). Testing practices in European countries. European Journal of Psychological Assessment, 17, 201-211. https://doi.org/10.1027//1015-5759.17.3.201
Naglieri, J. A., Goldstein, S., Iseman, J. S., & Schwebach, A. (2003). Performance of children with Attention Deficit Hyperactivity Disorder and Anxiety/Depression on the WISC-III and Cognitive Assessment System (CAS).
Journal of Psychoeducational Assessment, 21, 32-42. https://doi.org/10.1177/073428290302100103
Pheiffer, S.I., Reddy, L.A., Kletzel, J.E., Schmelzer, E.R., & Boyer, L.M. (2000). The practitioner’s view of IQ testing and profile analysis. School Psychology Quarterly, 15, 376-385. https://doi.org/10.1037/h0088795
Prifitera, A., & Dersh, J. (1993). Base rates of WISC-III diagnostic subtest patterns among normal, learning-disabled, and ADHD samples. Journal ofPsychoeducational Assessment, WISC-III Monograph, 43-55.
Reinecke, M. A., Beebe, D. W., & Stein, M. A. (1999). The third factor of the WISC-III: it’s (probably) not Freedom from Distractibility. Journal of the American Academy of Child and Adolescent Psychiatry, 38), 322-329. https://doi.org/10.1097/00004583-199903000-00020
Rotsika, V., Vlassopoulos, M., Legaki, L., Sini, A., Rogakou, E., Sakellariou, K., Pehlivanidou, H., & Anagnostopoulos, D. C. (2009). The WISC-III profile in Greek children with Learning disabilities: Different language, similar difficulties. Journal of International Testing, 9, 271-282. https://doi.org/10.1080/15305050903106891
Rotsika, V., Vlassopoulou, M., Rogkakou, E., Sini, A., Legaki, L., Pexlivanidou, H., & Anagnostopoulos, D. C. (2006). Performance of children with Learning Disabilities on the WISC-III. Psychology,13, 56-66.
Roussos, A., Karantanos, G., Richardson, C., Hartman, C., Karajiannis, D, Kyprianos, S., Lazaratou, H., Mahaira, O., Tassi, M., & Zoubou, V. (1999). Achenbach´s Child Behavior Checklist And Teacher´s Report Form in a normative sample of Greek children 6-12 years old. European Child & Adolescent Psychiatry, 8, 165-172. https://doi.org/10.1007/s007870050125
Roussou, A. (2003). Manual for the ASEBA school-age forms and profiles. Athens: Ellinika Grammata.
Sattler, J. M. (2001). Assessment of children. Cognitive applications (4th ed.). San Diego: J. M. Sattler, Publisher, Inc. Slate, J. R. (1994). WISC-III correlations with the WIAT. Psychology in the Schools, 31, 278-285.
https://doi.org/10.1002/1520-6807(199410)31:4<278::AID-PITS2310310405>3.0.CO;2-T
Slate, J. R. (1995). Discrepancies between IQ and index scores for a clinical sample of students: Useful diagnostic
indicators. Psychology in the Schools, 12, 103-108.
https://doi.org/10.1002/1520-6807(199504)32:2<103::AID-PITS2310320205>3.0.CO;2-L
Smith, C. B., & Watkins, M. W. (2004). Diagnostic Utility of the Bannatyne WISC-III Pattern. Learning Disabilities
Research and Practice, 19, 49-56. https://doi.org/10.1111/j.1540-5826.2004.00089.x
Smith, T. D., Smith, B. L. & Smithson, M. M. (1995). The relationship between the WISC-III and the WRAT-3 in a sample of rural referred children. Psychology in the Schools, 32, 291-295. https://doi.org/10.1002/1520-6807(199510)32:4<291::AID-PITS2310320407>3.0.CO;2-Z
Sofie, C. A., & Riccio, C. A. (2002). A comparison of multiple methods for the identification of children with learning disabilities. Journal of Learning Disabilities, 35, 234-244. https://doi.org/10.1177/002221940203500305
Tiholov, T. T., Zawallich, A., & Janzen, H. L. (1996). Diagnosis based on the WISC-III Processing Speed factor.
Canadian Journal of School Psychology, 12, 23-34. https://doi.org/10.1177/082957359601200105
Vrachimi-Souroulla, A., Panayiotou, G., & Kokkinos, C. (2009). The role of the teacher in identifying Learning Disabilities. A study using the McCarney Learning Disability Evaluation Scale (LDES). Journal of Learning
Disabilities, 42, 483-493. https://doi.org/10.1177/0022219409335217
Vrachimi-Souroulla, A., Panayiotou, G., Kokkinos, C., & Lamprianou, I. (2011). Achievement testing with the Wechsler Quicktest: an examination of its psychometric properties and applied utility with a Greek-Cypriot sample.
Educational Psychology. An International Journal of Experimental Educational Psychology, 31, 105-121.
https://doi.org/10.1080/01443410.2010.519827
ACIDS, and SCAD profiles in a referred population. Psychology in the Schools, 32, 267-276. https://doi.org/10.1002/1520-6807(199510)32:4<267::AID-PITS2310320405>3.0.CO;2-Q
Ward, T. J., Ward, S. B., Glutting, J. J., & Hatt, G. V. (1999). Exceptional LD profile types for the WISC-III and WIAT.
School Psychology Review, 28(4), 629-643.
Watkins, M. W. (1999). Diagnostic utility of WISC-III subtest variability among students with Learning Disabilities.
Canadian Journal of School Psychology, 15, 11-20. https://doi.org/10.1177/082957359901500102
Watkins, M. W., & Glutting, J. J. (2000). Incremental validity of WISC-III profile elevation, scatter, and shape information for predicting reading and math achievement. Psychological Assessment, 12, 402-408. https://doi.org/10.1037/1040-3590.12.4.402
Watkins, M. W., Kush, J. C., & Glutting, J. J. (1997). Discriminant and predictive validity of the WISC-III ACID profile among children with Learning Disabilities. Psychology in the Schools, 34, 309-319. https://doi.org/10.1002/(SICI)1520-6807(199710)34:4<309::AID-PITS2>3.0.CO;2-G
Watkins, M. W., Kush, J. C., & Glutting, J. J. (1997). Prevalence and diagnostic utility of the WISC-III SCAD profile among children with disabilities. School Psychology Quarterly, 12, 235-248. https://doi.org/10.1037/h0088960 Wechsler, D. (1991). Wechsler Intelligence Scale for Children, Third Edition, WISC-III. The Psychological Corporation. Wechsler, D. (1996). Wechsler Quicktest Manual. The Psychological Corporation. U.K.: Harcourt Brace Jovanovich. Wechsler, D. (1996). WISC-III UK.Wechsler Intelligence Scale for Children: Manual. The Psychological Corporation.
U.K.: Harcourt Brace Jovanovich.
Weiss, L. G., & Prifitera, A. (1995). An evaluation of differential prediction of WIAT achievement scores from WISC-III FSIQ across ethnic and gender groups. Journal of School Psychology, 33, 297-304. https://doi.org/10.1016/0022-4405(95)00016-F
Wilson, M. S., & Rechsly, D. J. (1996). Assessment in school psychology training and practice. School Psychology Review, 25, 9-23.
Copyrights
Copyright for this article is retained by the author(s), with first publication rights granted to the journal.