Issues
ISSN: 2146-4138
available at http: www.econjournals.com
International Journal of Economics and Financial Issues, 2017, 7(2), 469-476.
Audit Fee and Audit Quality: An Empirical Analysis in Family
Firms
Saeid Homayoun
1*, Maryam Hakimzadeh
21Faculty of Education and Economics, University of Gävle, Kungsbäcksvägen 47, SE-80176 Gävle, Sweden, 2Department of
Accounting, Firoozabad branch, Islamic Azad University, Firoozabad, Iran. *Email:sadhon@hig.se
ABSTRACT
The purpose of this research is to investigate the relationship between audit fee and audit quality in family firms on the Tehran stock exchange. The study period is from 2007 to 2014. The sample consists of 30 family firms and 30 non-family firms. To test our hypotheses, the following methods were used: Two-independent-samples t-test mean comparison and regression model. The results of this research show that there is a significant difference between audit fee in family and non-family firms, and that also family and non-family firms do not significantly differ in terms of size and auditor expertise. The results show that family firms pay lower audit fees compared to non-family firms, such that with increased family ownership, the audit fee decreases.
Keywords: Family Firms, Audit Fee, Audit Firm Size, Quality, Audit Firm Expertise
JEL Classification: M4
1. INTRODUCTION
Over the past years, many studies have investigated the factors
influencing audit quality and fee. Few studies have examined the
effect of ownership concentration, especially family ownership and control on audit fee and quality. Studies show that there are two views about the effect of family control and ownership on audit
fee and quality. The agency theory states that family firms may
decrease or increase agency problems (Khan and Subramaniam,
2012). According to this theory, however, there are motives for family firms to maximize personal interests and to influence the process of financial reporting which result in increased agency
costs. As a result, increased agency costs require risk evaluation and high audit efforts and therefore a higher audit fee. On the other hand, family ownership can also be considered for the
improvement of internal monitoring and reduction of conflicts
of interests between manager and owner, therefore resulting in decreased audit risk evaluation and audit fees (Khan and
Subramaniam, 2012).
Also, family shareholders may influence firm audit quality in two
ways. Based on the agency theory, demand for high-quality audit services has a direct relationship with increased agency costs
(Khan and Subramaniam, 2012). DeAngelo (1981) believes that large audit firms provide higher audit quality due to their greater reputation and legal risks. Chrisman et al. (2004) state that firms
with family control have lower agency costs. These results reveal
that family firms have lower demands for audit quality (Khan and Subramaniam, 2012), so there is less of a chance that they will use large audit firms. Other studies state that agency costs are higher in family firms (e.g., Morck and Yeung, 2003). The consensus
based on these studies is that demand for audit quality and also
the probability of choosing a large audit firm is higher in family firms (Khan and Subramaniam, 2012).
Today, family firms constitute a majority of all firms. Based on scientific research, businesses with some kind of family ownership or management constitute about 65-90% of all the businesses worldwide (Gersick et al., 1997). In many countries, several indices have been provided to define such firms, and due to the importance of these firms, many studies have been conducted on
them. Shareholders, potential investors, creditors, and others like
Iran are seldom investigated and little information is available about them, research about them seems important.
Audit fees and the audit quality of audit firms in family and non-family firms should be compared. Based on this research, the
main reason for the difference between audit fee and audit quality
in family and non-family firms, is the different agency costs in these firms, which is due to the existence of family shareholders. As past research has shown, one of the factors influencing the decisions of investors, creditors, and other stakeholders is firms’ agency costs (Sajadi et al., 2012). Therefore, the results of this research can influence the decisions of investors and other
stakeholders.
The purpose of this research is to investigate audit fee and audit
quality in family firms to discover whether there is a significant relationship between audit fee and audit quality in family firms.
This research places investors, creditors, and other stakeholders in the process of audit fee value and also demands for audit quality
in family firms.
2. REVIEW OF THE RESEARCH
LITERATURE
Although research related to the selection of an auditor and audit
fee has been well developed, the relationship between family firms
and audit fee and auditor selection has received less attention. The
decision to employ a high-quality audit firm lessens some worries about the quality of financial statements. This characteristic leads
to the creation of two competing theories on the effect of family
ownership in profit benefit: Orientation effect theory and balance
effect theory.
The probability of the effect of balance in family firms, concentration on the long-term survival and reputation of a
family firm, and personal relationships with creditors and other
shareholders may decrease agency costs, because the sustainable
and long-term presence of family members in the firm and their willingness to keep the family name may cause family firms to
have a good, long-term relationship with non-family shareholders
and creditors (Anderson and Reeb, 2003). This indicates that
family members are less likely to act opportunistically and
influence the financial reporting process (Wang, 2006). From the perspective of the demanding party, it is expected that firms with
controlling shareholders, in particular family control, require less auditing, which is related to low audit fees. It can also be argued that the presence of family members in the board of directors
and management team and the firm’s reputation can have a positive effect on the firm (Khan and Subramaniam, 2012). Such
circumstances may decrease audit risk evaluation, with auditors regarding the unit under investigation; from the perspective of suppliers, auditors may in turn use less auditing effort to minimize auditing risk, which results in lower audit fees (Khan
and Subramaniam, 2012). Ho and Kang (2010) showed that low audit fees in family firms accompany their low demand for audit
services, which is due to the lower intensity of agency problems
(between owners and managers) and higher intensity of another
type of these problems (between controlling and non-controlling
shareholders) in these firms.
According to the orientation effect theory, family firms have
lower efficiencies because ownership concentration creates motives for controlling shareholders to obtain the capital of other
shareholders (Morck et al., 1988). Family members usually have
important positions in the management team and board of directors
of a firm. Therefore, these firms may have a weaker corporate
governance because the supervision of the board of directors
is useless (Khan and Subramaniam, 2012). Also, Gomez-Meija et al. (2001) stated that family control may inhibit information
disclosure to other shareholders. In other words, family members
can influence the process of financial reporting (Wang, 2006). Such
conditions may increase the audit risk evaluation, with auditors regarding the unit under investigation. From the perspective of the suppliers, auditors may in turn work harder to minimize audit risk, which increases audit fees. It can also be argued that due to the presence of family members and other stakeholders, including non-family shareholders and bondholders, maybe higher agency costs get created, and therefore the family members may demand an independent auditor to decrease agency costs (Khan
and Subramaniam, 2012).
Also, family shareholders may influence audit quality in two ways (Ho and Kang, 2010). Based on the agency theory, demand for
audit quality has a direct relationship with agency costs. Francis
(2004), after investigating the auditing literature, states that high-quality auditors (which usually include large audit firms) are used
in areas with a high potential for agency cost (and therefore a
greater need for monitoring) and with a high level of information asymmetry. This shows that family firms can use high-quality
auditors to specify the validity of audit disclosures and to ensure the high quality of the disclosure. Consequently, the use of
high-quality auditors may limit expropriation by majority shareholders.
Since family ownership may improve internal monitoring and
decrease conflicts of interest between managers and owners, family firms are less likely to use large audit firms due to decreased agency costs (Khan and Subramaniam, 2012). Also, it has been stated that family firms are greatly motivated to acquire personal benefits, such as their natural inclination to influence the process of financial reporting, which increases agency costs (Anderson and Reeb, 2003). Therefore, family firms are more likely to employ large audit firms to ensure high audit quality (Khan and Subramaniam, 2012).
Many studies have been performed about this subject. Twelve that are directly and indirectly related to subject of the present research can be summarized as follows:
• Ho and Kang (2010) concluded that on average, family firms are less likely to select large audit firms as their auditors. Also, compared to non-family firms, family firms pay lower audit
fees.
• He (2010), in a master’s thesis titled “auditor choice, audit fees and internal governance in family firms,” investigated the
governance, owners are more likely to select expert auditors.
The positive relationship between family ownership and
selection of an expert audit with strong internal mechanism
becomes stronger, and the negative relationship between family ownership and audit fee in the presence of strong internal governance disappears.
• Khan et al. (2011) investigated the effect of ownership
concentration on audit fees in the emerging economy of Bangladesh. Their results showed that audit fees have a
significant negative relationship with family ownership and
institutional investors.
• Johl and Khan (2011) investigated audit fees in 500 Australian firms. Their sample included firms with family and external control. They concluded that family firms pay lower audit fees compared to non-family firms. Also, their results revealed that companies with family and external ownership pay a higher audit fee to large audit firms.
• In his research work, Kang (2012) showed how the ownership structure of family firms and agency issues influences the selection of expert auditors of the industry and the level of audit fee. His results showed that family firms are more likely to select expert auditors and undergo a lower cost of audit fee compared to non-family firms.
• Khan and Subramaniam (2012) investigated the relationship
between family ownership and audit fee and auditor selection
in Australian firms. According to their results, family firms pay a greater fee compared to non-family firms. Also the
percentage of family ownership is related to higher audit fee.
Their results also revealed that compared to non-family firms, family firms are more likely to select large audit firms and pay a higher audit fee to large audit firms compared to other audit firms.
• Zureigat (2012) investigated the relationship between ownership structure and audit quality. He considered three
indices for ownership structure – institutional ownership, outside ownership, and concentration of ownership – and compared audit quality with the size of audit firm.
He discovered that firms with outside and institutional shareholders have a significant positive relationship with audit quality, whereas concentration of ownership has a significant
negative relationship with audit quality.
• Yaşar (2013) investigated the effect of audit firm size on profit management in Turkey. His results showed no significant relationship between audit firm size and profit management.
There was no difference between the audit quality of four
large audit firms and four small audit firms in discovering profit management in Turkey.
3. RESEARCH HYPOTHESES
Family firms can increase or decrease agency problems. However, family firms can have lower efficiency, because they expropriate capital from other shareholders (Shleifer and Robert, 1997). Such firms may inhibit the flow of accounting information to shareholders who may influence the overall risk evaluation. It has also been stated that family firms are very likely to use large audit firms to ensure audit quality and decrease agency costs. However, family firms can be more efficient than other firms
because in these firms, family owners are on the same path as other shareholders (Anderson and Reeb, 2003) and are less likely to influence the process of financial reporting. Such conditions
may generally decrease the risk evaluated by auditors and also
audit fees. This also suggests that family firms are less likely to use large audit firms when family members provide high-quality
monitoring internally.
Based on what has been said, we derive two hypotheses for this research:
H1: There is no significant difference between the audit fee of family and non-family firms.
H2: Demand for audit quality in family firms is remarkably higher than non-family firms.
To evaluate audit quality, the two indices of audit firm size and audit expertise are used.
4. SELECTION OF THE FIRMS AND
COLLECTING THEIR DATA
To perform this research, first we required a definition of what family firms are. Chua et al. (1999) reviewed more than 250 articles about family firms to provide a specific definition of family firms and stated that there is no specific and clear definition of family firm and each researcher in his/her own research has provided a definition. Family firms can be defined based on various aspects.
Regarding the percentage of share ownership, different views
have been provided. In the definitions provided, ownership of a minimum of 5% and maximum of over 50% by family members
is stated as a condition.
Here we provide a definition for family firms based on Iranian
regulations. Different definitions have provided different percentages for ownership in family firms. For a certain
percentage to be stated for Iran, first we must notice under what conditions shareholders have remarkable influence in a firm. After that, based on this remarkable influence, a family firm can be defined. According to Paragraph 8 of Standard No. 20 of Iranian
Accounting Standards Committee, ownership of a minimum of
20% of a firm’s share by the members of a family is one of the conditions of family firms. Moreover, membership of family members in the board of directors of a firm is another criterion considered for family firms.
Also, Namazi and Mohammadi (2010) defined family firms as follows: Family members own 20% of the shares either individually or collectively, and/or one of the family members,
either blood-related or by marriage, is a member of the board of
directors or is the executive director and actively participates in the firm’s board of directors, and at least two generations of the family have a role in controlling the firm.
• One or more of the members of one or two families own at least 20% of the firm’s shares, unless despite the ownership of a minimum of 20% of the firm shares, they do not have a significant influence or control in the firm;
• At least 50% of the members of the board of directors are
members of the same family;
• Somehow, the significant influence or control over the firm
by the family members is proven even if the ownership of the
family members is less than 20%.
Since most definitions in the literature related to family firms consider the percentage of shares owned by the first family as the criterion for considering the firm as a family firm, we
have adopted Namazi and Akbari’s (2011) definition for this
research.
A firm that does not meet any of the criteria for family firms, is considered a non-family firm.
To investigate family and non-family firms and determine the study
sample, the statistical sample was selected using the systematic elimination method based on the criteria below:
1. The firm was present in the stock market from 2007 to 2014.
2. Fiscal year ended in mid-March.
3. The firm did not change its fiscal year from 2007 to 2014 and
had no operational interruptions lasting longer than 6 months.
4. The financial intermediary firms are removed due to the specific nature of the activity.
5. Status in terms of being a family or non-family firm is completely clear.
The sample included 30 family firms and 30 non-family firms during the 7-year period of 2007-2014. The research had a quasi-experimental design and a casual approach (through past information). In this research, a library method was used
to collect data. To write and collect the information required for the theoretical foundations, mostly specialized Farsi and English journals were used. To collect other data, mostly
databases from Tehran stock exchange, audited financial statements, explanatory notes, stock exchange reports, and the
two data analysis software packages called Rahavard Novin
and Tadbir Pardaz were used.
Model:
In this research, the following model was used to test each
hypothesis. Both models were adopted from Khan (2015).
Model 1:
AuditFee Familycon FirmSpecificControls IndustryC
= + +
+
β β β
β
0 1 2
3 oontrols+β4YearControls+ε
Model 2:
AuditorChoice Familycon FirmSpecificControls Indu
= + +
+
α α α
α
0 1 2
3 sstryControls+α4YearControls+ε
Where
AuditFee = Audit fee
AuditorChoice = Auditor choice
Familycon = An index variable that equals 1 if the firm is a family-firm and 0 otherwise
Familyown = Non-family institutional ownership
FirmSpecificControls = Firm-specific controls
IndustryControls = Industry control
YearControls = Years under study.
5. VARIABLE MEASUREMENT METHOD
5.1. Dependent Variables
The dependent variables in this research were audit fee and auditor choice.
• Audit fee: This variable is measured through the natural logarithm of the fee paid by the firm in exchange for
independent audit services.
• Two processes are considered for the auditor choice model: 1. Audit firm size. From the perspective of auditors, an audit
firm’s size is one of the characteristics influencing audit quality. DeAngelo (1981) believes that larger audit firms
provide higher quality audit services, because they like to gain a better reputation in the job market and since the number of their customers is high, they do not worry
about losing them. It is believed that such firms provide
higher quality audit services due to having access to more resources and facilities to train their auditors and requiring various tests of them.
2. Auditor choice for the desired industry. Recent research has found a positive relationship between the industry in
which an auditor is expert in and his/her audit reporting
quality. In other words, auditors that are specialized in their industry can provide better auditing, because they are
better able to identify and deal with the industry-specific problems. Moreover, the more the audit firm obtains experience in a specific industry, due to the creation
of a positive reputation, it becomes more interested in providing high-quality audit services.
Willenborg (2002) shows that due to two major reasons, an audit firm must be specialized in a specific industry. The first reason is the effect that this expertise has on improving the effectiveness of auditing and the second reason is the effect that this expertise has on increasing the efficiency of auditing. An industry-expert auditor is a hypothetical variable that equals 1 if it exists and 0 otherwise.
5.2. Independent Variable
The independent variable in this research is family control. If
the firm is a family firm, this variable equals 1; and the variable equals 0 if it is non-family. When we investigate the relationship
between family ownership and audit fee, we use the hypothetical variable of family ownership, which shows the percentage of the share belonging to family members.
5.3. Control Variables
• Non-family institutional ownership. This variable is obtained
shareholders of a firm except for the family members. • Audit complexity. The ratio of inventory and receivables is a
criterion for the complexity of audit work.
• Inventory ratio. This ratio is obtained by dividing inventory by total firm assets.
• Receivables ratio. This ratio is obtained by dividing total
accounts receivable and other receivables by total assets.
• Firm size. In this research, in order to estimate the firm size, the natural logarithm of total assets at the end of fiscal year
is used.
• Financial leverage. In this research, the ratio of total debt to total assets is used as the index of financial leverage. • Profitability. To measure the profitability of firms, the variable
of the return of total assets (ratio of net profit to total assets)
was used.
• Other control variables. Institutional ownership, state ownership, board of directors’ independence, type of
audit, hypothetical year-end, hypothetical non-audit fees, hypothetical subsidiaries.
6. DATA ANALYSIS
The purpose of this research is to answer the following question: Do the reward and characteristics of the board of directors of
family firms significantly differ from that of non-family firms in the stock exchange market, or not? First, we provide the descriptive
statistics of the variables. Then the research hypotheses are investigated and tested using the mean comparison method and regression model.
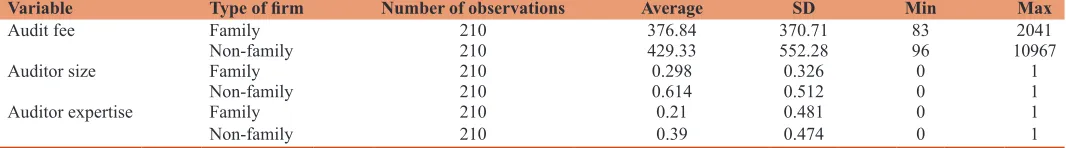
6.1. Descriptive Statistics
There were 60 firms in the sample investigated in the time period of 2007-2014, which constitutes 420 observations (firm-year). The first dependent variable is audit fee. The minimum fee in the firms studied equals 83 million Iranian Rials and the highest fee equals 10,967 million Iranian Rials. The mean for this variable equals 641.5 million Rials. Auditor size and expertise are two-dimensional variables. If the firm auditor is an audit firm, the number of 1 will be assigned to it as a large auditor, otherwise a 0 is given. If the auditor is an expert in the industry, he/she is allocated a value of 1, otherwise a 0. In Table 1, the descriptive statistics
information are provided based on family and non-family firms.
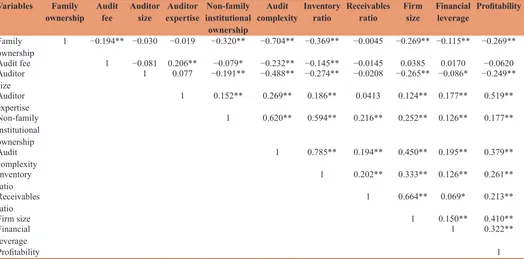
6.2. Pearson Correlation Coefficients
Table 2 provides the Pearson correlation coefficients between the research variables. The coefficients marked with (*) are significant at 95%; those marked with (**) are significant at 99%. Negative
coefficients indicate the presence of an inverse relationship
between two variables, whereas positive coefficients indicate
the presence of a direct relationship between two variables. As is observed, the family and non-family ownership correlation
coefficient with the variables of audit fee, auditor size, and auditor expertise are −0.194, −0.030, and −0.019, respectively.
6.3. Multicollinearity Test of Variance Inflation Factor
(VIF)
A multicollinearity test was performed in a regression model. If the multicollinearity in a regression model is high, it means that there is a high correlation between independent variables, and it is possible
that despite the high value of the model’s coefficient of determination,
the model does not have high credibility. For this purpose, the multicollinearity of the regression model of this research was tested and the results of the test are given in Table 3. In this Table 3, the
values related to the index of VIF investigate the existence of multicollinearity. The closer the value of this index is to 1, the less
of a multicollinearity problem there is in the model. If the value of
the index is greater than 5, it means that there is a multicollinearity
problem in the model that should be eliminated. As is seen, the indices of multicollinearity of the variables are all close to 1; therefore, it can be said that there is no multicollinearity problem in the model.
6.4. Testing Hypothesis 1
H1: There is a significant difference between the audit fee of family and non-family firms.
To test this hypothesis, the two methods of two-independent-samples t-test comparison and regression model with panel data were used.
6.5. Two-independent-samples t-test Mean Comparison
Table 4 shows the comparison of audit fee in family and non-family
firms. Based on the results from testing H1 shown in Table 4, the
degree of significance related to the mean difference of the two samples equals 0.000. Therefore, in general, at a confidence level of 95%, there is a significant difference between the audit fee of family and non-family firms. This result shows that on average, family firms pay lower audit fees. Therefore, H1 is accepted.
This comparison is given individually for the two periods of
2007-2010 and 2011-2014.
As is observed, in both investigated periods there is a significant difference between the audit fee in family and non-family firms. In both periods, the average fee in family firms is less than that of non-family firms.
Table 1: Descriptive statistics of the research variables based on family and non‑family firms
Variable Type of firm Number of observations Average SD Min Max
Audit fee Family 210 376.84 370.71 83 2041
Non-family 210 429.33 552.28 96 10967
Auditor size Family 210 0.298 0.326 0 1
Non-family 210 0.614 0.512 0 1
Auditor expertise Family 210 0.21 0.481 0 1
Non-family 210 0.39 0.474 0 1
6.6. Regression Model
In the regression model (Table 5), the relationship between family
ownership and the dependent variable of audit fee is investigated.
All the independent and control variables’ coefficients in the equation are zero. Therefore, the significance of the regression
equation must be tested. This is done using the F statistic. As is seen in Table 5, the value of the F statistic and the degree of significance related to this statistic equals 130.04 and 0.000, which shows that H0, which stated that the whole model is insignificant (zero being of all the coefficients) is rejected, and in fact the estimated regression model is generally significant.
As is seen, the value of significance of the coefficient related to the independent variable equals 0.012 and is less than the expected error (5%). Therefore, statistically, there is a significant relationship between family ownership and audit fee. The coefficient of the variable of family ownership percentage equals −0.041. Therefore, there is an inverse and significant relationship between family
ownership and audit fee.
The coefficient of determination of the model equals 0.46, which explains 48% of the changes of the dependent variable by the variables included in the model. The degree of significance of the F statistic related to the significance of the overall regression model equals 0.000, which shows that the overall regression model is significant.
It should be mentioned that in the primary estimation of the model,
given the low value of the Durbin-Watson statistic, the problem of autocorrelation existed between the research variables. If the value of the Durbin-Watson statistic is in the range of 1.5-2.5, it
can be said that there is no autocorrelation problem. Therefore,
the new coefficient of Durbin-Watson became equal to 1.93, the
autocorrelation problem was eliminated, and the new regression was estimated.
6.7. Testing Hypothesis 2
H2: Demand for audit quality in family firms is significantly higher than that of non-family firms. To test this hypothesis, Table 3: Multicollinearity test between independent and
explanatory variables
Variable Tolerance index VIF index
Family ownership 0.736 1.35
Non-family institutional ownership 0.981 1.01
Audit complexity 0.953 1.05
Inventory ratio 0.759 1.31
Receivables ratio 0.913 1.09
Firm size 0.985 1.04
Financial leverage 0.979 1.04
Profitability 0.841 1.19
Non-family institutional ownership 0.798 1.28
Audit complexity 0.904 1.08
VIF: Variance inflation factor
Table 4: Comparative test of audit fee in family and
non‑family firms for two different periods
Period Average
fee t-statistic significanceDegree of differenceMean 2007-2010
Family
firms 351.2 4.52 0.000 53.6
Non-family
firms 404.8
2011-2014 Family
firms 381.5 5.84 0.000 71.2
Non-family
firms 452.7
Table 2: Correlation coefficients between research variables Variables Family
ownership Audit fee Auditor size expertiseAuditor institutional Non-family ownership
Audit
complexity Inventory ratio Receivables ratio Firm size Financial leverage Profitability Family
ownership 1 −0.194** −0.030 −0.019 −0.320** −0.704** −0.369** −0.0045 −0.269** −0.115** −0.269** Audit fee 1 −0.081 0.206** −0.079* −0.232** −0.145** −0.0145 0.0385 0.0170 −0.0620 Auditor
size 1 0.077 −0.191** −0.488** −0.274** −0.0208 −0.265** −0.086* −0.249**
Auditor
expertise 1 0.152** 0.269** 0.186** 0.0413 0.124** 0.177** 0.519**
Non-family institutional ownership
1 0.620** 0.594** 0.216** 0.252** 0.126** 0.177**
Audit
complexity 1 0.785** 0.194** 0.450** 0.195** 0.379**
Inventory
ratio 1 0.202** 0.333** 0.126** 0.261**
Receivables
ratio 1 0.664** 0.069* 0.213**
Firm size 1 0.150** 0.410**
Financial
leverage 1 0.322**
Profitability 1
the two methods of two-independent-samples t-test comparison and regression model with panel data were used. In Table 6, comparison of the characteristics of the board of directors in family
and non-family firms is given.
Based on the results from testing the second hypothesis, the degree
of significance related to the mean difference of the two samples for the variable of auditor size equals 0.864 and is more than the test error level 5% (0.05) and thus is insignificant. As a result, family and non-family firms do not significantly differ in terms of auditor size. Also, the degree of significance related to the mean difference of the two samples for the variable of auditor expertise
is 0.241. Therefore, in general, at a confidence level of 95%, there is no significant difference between the auditor expertise of family and non-family firms (Tables 7 and 8).
6.8. Regression Model
Table 9 shows the relationship between family ownership and auditor size.
In Table 9 showing the regression model, the relationship between family ownership percentage and the dependent variable of auditor
size is investigated. As is seen, the degree of significance of the coefficient related to the independent variable of family ownership equals 0.503 and is higher than the expected error level (5%). Therefore, statistically, there is no significant relationship between
family ownership and auditor size.
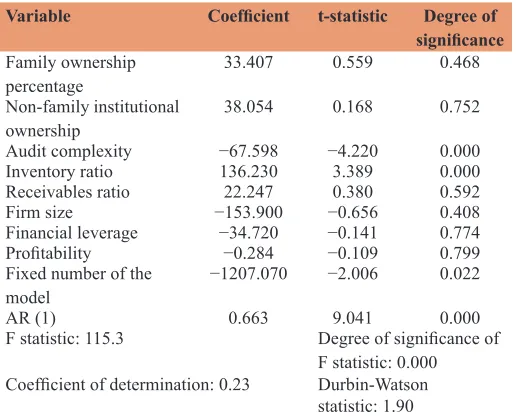
6.9. Regression Model
Table 10 shows the relationship between family ownership and auditor expertise.
In the regression model in Table 10, the relationship between
family ownership percentage and the dependent variable of
auditor expertise is investigated. As is seen, the degree of significance of the coefficient related to the independent variable of family ownership equals 0.468 and is higher than the expected Table 5: Regression model of family ownership and audit
fee
Variable Coefficient t-statistic Degree of
significance
Family ownership
percentage −0.041 −2.218 0.012
Non-family
institutional ownership 0.276 3.479 0.000
Audit complexity −0.015 −2.858 0.003
Inventory ratio 0.081 0.294 0.719
Receivables ratio −0.730 −2.114 0.025
Firm size 0.005 −3.196 0.000
Financial leverage −0.463 −2.175 0.021
Profitability 1.151 0.420 0.626
Fixed number of the
model −1508.490 −2.804 0.003
AR (1) 1.386 10.598 0.000
F statistic: 130.04 Degree of significance of F statistic: 0.000 Coefficient of determination: 0.46 Durbin-Watson
statistic: 1.93
Table 6: Comparative test of the characteristics of the
board of directors in family and non‑family firms Variable Mean t-statistic Degree of
significance differenceMean Auditor size
Family firms 0.016 0.134 0.864 0.012
Non-family
firms 0.004
Auditor expertise
Family firms 0.356 1.32 0.241 0.296
Non-family
firms 0.652
Table 7: Comparative test of auditor size in family and
non‑family firms
Period Mean
fee t-statistic significanceDegree of differenceMean 2007-2010
Family firms 0.284 0.893 0.498 0.095
Non-family
firms 0.379
2011-2014
Family firms 0.301 0.912 0.504 0.039
Non-family
firms 0.340
Table 8: Comparative test of auditor expertise in family
and non‑family firms
Period Mean
fee t-statistic significanceDegree of differenceMean 2007-2010
Family firms 0.398 0.451 0.695 0.023
Non-family
firms 0.421
2011-2014
Family firms 0.361 0.598 0.647 0.025
Non-family
firms 0.386
Table 9: Regression model of family ownership and auditor size
Variable Coefficient t-statistic Degree of
significance
Family ownership
percentage 35.868 0.600 0.503
Non-family
institutional ownership 40.858 0.181 0.808
Audit complexity −72.579 −4.531 0.000
Inventory ratio 146.268 3.638 0.000
Receivables ratio 23.886 0.408 0.635
Firm size −165.240 −0.704 0.438
Financial leverage −37.278 −0.151 0.831
Profitability −0.305 −0.117 0.858
Fixed number of the
model −1296.012 −2.154 0.023
AR (1) 0.712 9.707 0.000
F statistic: 118.4 Degree of significance of F statistic: 0.000 Coefficient of determination: 0.25 Durbin-Watson
error level (5%). Therefore, statistically, there is no significant relationship between family ownership and auditor expertise.
7. CONCLUSION
Based on the results from testing H1, there is a significant difference between the audit fee of family and non-family firms. This shows that on average, family firms pay less for audit fees.
According to the agency theory, however, there are motives for
family firms to maximize their personal benefits and influence the process of financial reporting, which results in increased agency
costs. As a result, increased agency costs require risk evaluation and high audit efforts, which result in higher audit fees. On the other hand, family ownership can also be considered for the
improvement of internal control and decreasing the conflict of
interests between managers and owners, and therefore results in decreased audit risk evaluation and also decreased audit fee, as our research shows.
Based on the results from testing the second hypothesis, family
and non-family firms do not significantly differ in terms of auditor size and expertise. This comparison was done separately for the two periods of 2007-2010 and 2011-2014, which showed similar
results.
Regarding audit firm size, based on the calculations performed, almost 64% of firms use an audit firm for their auditing services, so their audit quality does not significantly differ.
REFERENCES
Anderson, R.C., Reeb, D.M. (2003), Founding-family ownership and firm performance: Evidence from the S&P 500. The Journal of Finance, 2, 103-116.
Chrisman, J.J., Chua, J.H., Litz, R.A. (2004), Comparing the agency costs of family and non-family firms: Conceptual issues and exploratory
evidence. Entrepreneurship: Theory and Practice, 28, 354-355. Chua, J.H., Chrisman, J.J., Sharma, P. (1999), Defining the family business
by behavior. Entrepreneurship Theory and Practice, 23(4), 19-39. DeAngelo, L. (1981), Auditor size and audit quality. Journal of Accounting
and Economics, 13, 183-189.
Francis, J.R. (2004), What do we know about audit quality? The British Accounting Review, 36(4), 345-368.
Gersick, K.E., Davis, J.A., McCollom, H.M., Lansberg, I. (1997), Generation to Generation: Life Cycles of the Family Business. Boston: Harvard Business School Press.
Gomez-Mejia, L., Nunez-Nickel, M., Gutierrez, I. (2001), The role of family ties in agency contracts. Academy of Management Journal, 44, 81-95.
He, S. (2010), Auditor choice, audit fees and internal governance in family firms (Master's thesis, Lingnan University, Hong Kong). Retrieved from http://dx.doi.org/10.14793/fin_etd.
Ho, J.L.Y., Kang, F. (2010), Auditor Choice and Audit Fees in Family Firms: Evidence from the S&P 1500. Irvine, CA: The Paul Merage School of Business, University of California.
Johl, S., Khan, A. (2011), Audit Pricing In Private Firms: The Effects of Family and Forign Control. Victoria, Australia: School of Accounting Economics and Finance, Deakin University. Available from: http:// www.afaanz.orgJohl & Khan.
Kang, F. (2012), Industry Specialist Auditors and Audit Fees in Family Firms: Evidence from the S&P 1500. Irvine: University of California. Khan, A. (2015), Audit fees, auditor choice and stakeholder influence:
Evidence from a family-firm dominated economy. The British Accounting Review, 47(3), 304-320.
Khan, A., Subramaniam, N. (2012), Family Firm, Audit Fee and Auditor Choice: Australian Evidence. Financial Markets and Corporate Governance Conference.
Khan, A.R., Hossain, D.M., Siddiqui, J. (2011), Corporate ownership concentration and audit fees: The case of an emerging economy. Advances in Accounting, 27, 125-131.
Khan, R., Hossain, A.M., Siddiqui, J. (2011), Corporate ownership concentration and audit fees: The case of an emerging economy. Advances in Accounting, 27(1), 125-131.
Morck, R., Shleifer, H., Vishny, R. (1988), Management ownership and market valuation: An empirical analysis. Journal of Financial Economics, 20, 293-315.
Morck, R., Yeung, B. (2003), Agency problems in large family business groups. Entrepreneurship: Theory and Practice, 27, 367-382. Namazi, M., Akbari, J. (2011), Reviewing the Performance and Capital
Structure of Family and Nonfamily Firms Listed in the Tehran Stock Exchange. Master’s Thesis. University of Shiraz.
Namazi, M., Mohammadi, M. (2010), Evaluate earnings quality and efficiency of family and nonfamily firms listed in the Tehran stock exchange. Advanced Accounting, 3, 159-194.
Sajadi, S.H., Hajizadeh, S., Nickkar, J. (2012), The impact of agency costs and the quality of financial reporting on risk capital Godardian stock companies. Review of Accounting and Auditing, 19(3), 42-21. Shleifer, A., Robert, W.V. (1997), A survey of corporate governance. The
Journal of Finance, 52, 737-783.
Wang, D. (2006), Founding family ownership and earnings quality. Journal of Accounting Research, 44, 3.
Willenborg, M. (2002), Discussion of brand name audit pricing, industry specialization, and leadership premiums post-big 8 and 6 mergers. Journal of Accounting and Economics, 33, 91-115.
Yaşar, A. (2013), Big four auditors’ audit quality and earnings management: Evidence from Turkish stock market. International Journal of Business and Social Science, 4(17), 153-163.
Zureigat, Q. (2012), The effect of ownership structure on audit quality: Evidence from Jordan. International Journal of Business and Social Science, 2(10), 38-46.
Table 10: Regression model of family ownership and auditor expertise
Variable Coefficient t-statistic Degree of
significance
Family ownership
percentage 33.407 0.559 0.468
Non-family institutional
ownership 38.054 0.168 0.752
Audit complexity −67.598 −4.220 0.000
Inventory ratio 136.230 3.389 0.000
Receivables ratio 22.247 0.380 0.592
Firm size −153.900 −0.656 0.408
Financial leverage −34.720 −0.141 0.774
Profitability −0.284 −0.109 0.799
Fixed number of the
model −1207.070 −2.006 0.022
AR (1) 0.663 9.041 0.000
F statistic: 115.3 Degree of significance of F statistic: 0.000 Coefficient of determination: 0.23 Durbin-Watson