Efficiency of Foreign Banks Operating in India:
DEA Analysis
Dr Namita RajputAssociate Professor, Sri Aurobindo College, University of Delhi
E-mail: [email protected]
Kamna Chopra (Corresponding author)
Assistant Professor, Sri Aurobindo College, University of Delhi
E-mail: [email protected]
Shelly Oberoi
Research Scholar, Annamalai University
E-mail: [email protected]
Received: May 6, 2014 Accepted: July 27, 2014 Published: December 1, 2014
doi:10.5296/ajfa.v6i2.5591 URL: http://dx.doi.org/10.5296/ajfa.v6i2.5591
Abstract
Indian financial sector has observed various modifications in the policies and prudential norms to raise the banking standards in India to the international strength. Various financial reforms have taken place in 1991 which improved flexibility and operational autonomy in the banking sector. In 1992, on the recommendation of Narasimham committee, a series of developments were instigated. In 1993-94, the approval was accepted for the entry of new private banks and foreign banks in Indian banking sector. After the post reform era, the operations of Foreign Banks (FBs) received a considerable boost. The Reserve Bank of India liberalized its policy for foreign banks implying new opportunities for growth and different representations in India. The present study makes an attempt to measure and compare the efficiency scores of Public Sector Banks (PSBs), Private Sector banks and FBs operating in India during 2008-2013 using frontier based non-parametric technique, i.e., DEA, the result demonstrates that the efficiency of FBs has shown continuous improvement in comparison with PSBs and Private Banks following the route of deregulation with modest drifts.
Introduction
Bank of Scotland N.V has 24 branches. The other banks that have a double digit branch existence are Deutsche Bank (18) & DBS Bank (12).Considering the current scenario, an assessment of performance and efficiency level is needed about the working of FBs. This paper is an attempt to offer insights with respect to functioning and profitability of FBs in India and will also plot the efficiency level in post-liberalized regime.
In the above backdrop, the focus of the paper is to compare the efficiency of the foreign owned banks with PSBs and Private Banks operating in India and also to determine how the efficiency of FBs have improved in the recent time period. The paper is organized as follows. Section 1 i.e. the present section gives the insights of Indian Banking Industry and entry of FBs in India followed by Section 2 which gives a review of the existing literature in the areas of efficiency measurement of foreign banks in the Indian context. Research objectives are exposed in Section 3. Section 4 identifies database and methodology used. Interpretation of the results and analysis of this paper are summarized in Section 5. Conclusion will be the part of Section 6. References used in the study will be a part of the last Section.
Review of Literature
allowed new banks to be started in the private sector as per the recommendations of Narasimham committee. There was the domination of Indian banking industry by public sector banks. But now the situations have changed new generation banks with use of technology and professional management has gained a rational position in the banking industry. Brijesh K. Saho, Anandeep Singh (2007), this paper attempts to scrutinize, the performance trends of the Indian commercial banks for the period: 1997-98 - 2004-2005. Our broad empirical findings are pinpointing in many ways. First, there is a signal of an affirmative gesture about the effect of the reform process on the performance of the Indian banking sector by the increasing average annual trends in technical efficiency for all ownership groups. Second, the higher cost efficiency accrual of private banks over nationalized banks indicate that nationalized banks, though old, do not reflect their learning experience in their cost minimizing behavior due to X-inefficiency factors arising from government ownership. This finding also highlights the possible stronger disciplining role played by the capital market indicating a strong link between market for corporate control and efficiency of private enterprise assumed by property right hypothesis. And, finally, concerning the scale elasticity behavior, the technology and market-based results differ significantly supporting the empirical distinction between returns to scale and economies of scale, often used interchangeably in the literature. Vradi, Vijay, Mauluri, Nagarjuna (2006), in his study on´” Measurement of efficiency of banks in India” concluded that in modern world performance of banking is more important to stable the economy in order to see the efficiency of Indian banks. We have seen the fore indicators i.e. profitability, productivity, assets quality and financial management for all banks such as public sector, private sector banks in India for the period 1999-2000 to 2002-2003. There is an adoption of development envelopment analysis for measuring the efficiency of banks leading to a conclusion that public sectors banks are more efficient then other banks in India. Petya Koeva (July 2003), in his study on “The Performance of Indian Banks” concluded that during Financial Liberalization period new empirical evidence has been seen due to the impact of financial liberalization on the performance of Indian commercial banks. The analysis focuses on examination of the behavior and determinants of bank intermediation costs and profitability during the liberalization period has been focused by the analysis. The empirical results suggest that ownership type has a major effect on some performance indicators and that the observed augment in competition during financial liberalization has been related with lower intermediation costs and a profitability of the Indian banks.
Research Objectives
To analyze the overall performance of FBs operating in India (as a group) in comparison with PSBs and Private Banks.
To gauge the efficiency of each bank towards the elements of efficiency and overall performance.
To achieve the above objectives following empirical hypotheses are formulated:
Hypothesis 1: Efficiency of foreign banks (as a group) has improved during the recent time period from 2008-2009 to 2012-2013 in comparison with PSBs and Private Banks.
Hypothesis 2: Efficiency measures have resulted in higher efficiency level of each individual banking unit of foreign sector banks.
Data and Methodology
4.1. Database
The study has measured the efficiency level of all FBs operating in India during the last Eight years from 2008-2009 to 2012-2013. The focal point of the paper is to assess the efficiency scores of the banks using DEA analysis. While there are 43 FBs that are working currently in India but due to the limitation of incomplete data of twelve banks, the paper excluded such banks from the sample. Those banks are Australia and Newzealand banking group, Commonwealth bank of Australia, Credit Suisse AG, First Rand Bank, Industrial and commercial bank of China, National Australia Bank, ReboBank International, Sber Bank, Sumitomo Mitsui Banking Corporation, United Overseas Bank, Westpac Banking Corporation, and Woori Bank. In this study, the sample size of 31 FBs is taken which is adequately large to take care of the constrictions imposed by the requirement of the DEA model.
4.2. Methodology
u1 y1 + u2 y2 + …….unyn,
v1x1 +v2x2 +…...vnxn,
Where u, v are the weights for the outputs,
(y1…yn) and inputs x (x1……..xn), respectively
Assume that for each of the N firms there are data on K inputs and M outputs and represented by the column vectors xi and yi respectively for the ith firm. This may be expressed as (u’ yi/ v’ xi), where u is an MX1 vector of output weights and v is a KX1 vector of input weights. To arrive at the optimal weights, we define the following linear programming problem as:
Max u,v ( u’ yi/ v’ xj), (1)
Subject to
u’yj / v’xj 1, j = 1, 2 ... n,
u, v 0 (1)
Solving (1) will involve finding values for u and v such that the efficiency measure for each firm is maximized. A notable difficulty with this particular model formulation is that it can have an infinitenumber of solutions. Thus, an additional constraintis added, v’xi = 1 so that this problem can be avoided. The new model, known as the transformation model, thus becomes:
Max , v ( ’ yi), (2)
Subject to, v’ xi = 1
’ yj – v’ xj 0, j= 1, 2 ...N,
, v 0 (2)
To reflect the transformation, u has been replaced by and v has been replaced by v. This form in equation (2) is known as the multiplier form of the DEA linear programming problem. Using duality in linear programming, one can derive an equivalent envelopment form of this problem:
Min , , (3)
Subject to, -yi +Y 0
Xi - X 0 (3)
0, where is a scalar and is a NX1 vector of constants
DMU. A separate frontier will emphasize the changes taking place in the macro economy and the supervisory policies of RBI. DEA gives us the relative efficiency measure of the DMUs. DEA results are sampled specific. They don’t reflect the absolute efficiency measures. This means that the best performing DMU out of the group will be shown as 100 percent efficient. The rest of the DMUs will be benchmarked against this one. Another expressing way of this is to say that an efficient unit doesn’t necessarily produce the maximum output viable for a given level of input (Miller & Noulas, 1996). In this paper, we have taken an intermediation approach. Hence, deposits, investments, operating expenses and number of employees are used as inputs whereas return on assets (ROA), interest income and non-interest income together as Net Profits are taken as outputs.
Interpretation of Results
Hypothesis 1: Efficiency of foreign banks (as a group) has improved during the recent time period from 2005-2006 to 2009-2013 in comparison with PSBs and Private Banks.
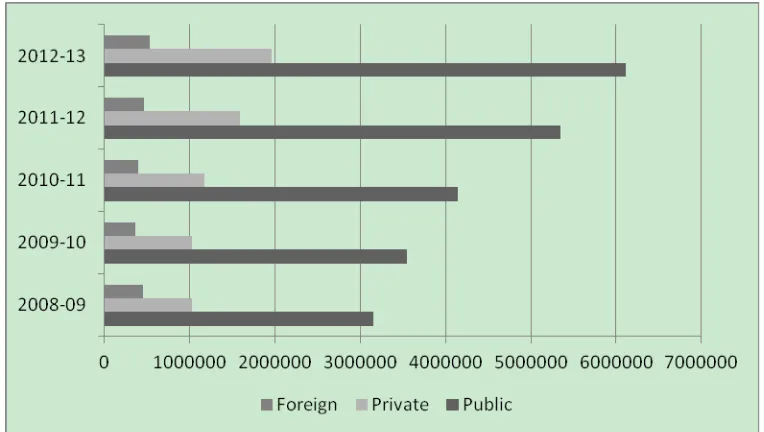
Figure 1. Trends of Net Profits of PSBs, Private Sector Banks and Foreign Banks
Figure 2. Trends of Efficiency Scores of PSBs, Private Sector Banks and Foreign banks
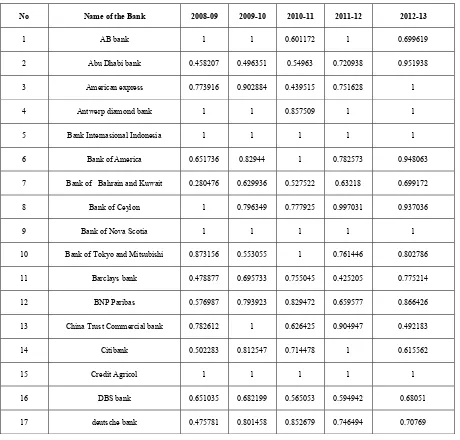
Hypothesis 2: Efficiency measures have resulted inhigher efficiency level of each individual bankingunit of foreign sector banks.
100% efficient. The number of efficient foreign banks has increased over the assessment years, 7 out of 31FBs confirmed the escalating level of efficiency. Hence, our hypothesis is accepted for 9 foreign banks which showed increasing trend in the efficiency and rejected in remaining 22 banks with the inverse picture exhibited in the results.
Summary and Conclusion
With India rising as a major Information Technology service provider in the 21st century, many global banks have entered in India; primarily to take advantage of the low-cost technology and Available Manpower. Some foreign banks also created centres of excellence that provided services at the higher end of the value chain. Foreign banks have made substantial contribution to the Indian banking sector over the years by bringing capital and global best practices as well as grooming talent. Foreign banks has shown an increasing trend of efficiency through their efficient working style and better customer service except in 2009-10 which was mainly due to the global Financial crisis. Over the last five years, there is persistent increase in the Net profits of PSBs and Private Banks in comparison with foreign banks but as far as Efficiency scores are concerned foreign banks has shown substantial improvement. Indian banks need to improve their technological orientation, to continue their efforts to reduce the percentage of NPAs in order to augment their profitable efficiency in the near future. At the same time, they should stay in the game for impending acquisition opportunities as and when they appear in the near term. Our result exhibits that in case of foreign banks the efficiency has been tremendous and consistent throughout the period of study, especially four foreign banks .i.e. Bank Internasional Indonesia, Credit Agricol bank, Krung Thai Bank and Nova Scotia bank. The foreign banks have dominated the list of the highly efficient banks as compared to all scheduled commercial banks. Participation of foreign banks in the growth curve of the Indian economy in future years will provide foreign banks a launch pad for greater business expansion.
References
Altunbus, Y, Evans, L and Molyneux, P. (2000). Bank Ownership and Efficiency. Journal of Money, Credit and Banking, 33(4), 926-954. http://dx.doi.org/10.2307/2673929
Annual Report. (2003). Reserve Bank of India, Mumbai.
Barr & Siems. (1994). Forecasting Bank Failure: A Non-Parametric Approach. Recherches Economiques de Louvain, 60, 411-29
Carlin, W and Landesmann, M. (1997). From Theory into Practice? Restructuring and Dynamism in Transition Economies. Oxford Review of Economic Policy, 13(2), 77-89.
Denizer, C, Tarimcilar, M and Dinc, M. (2000). Measuring Banking Efficiency in the Pre-and Post-Liberalization Environment: Evidence from the Turkish Banking System. World Bank Policy Research Paper, No 2476.
Economic Research Reports, 98-32, New York: CV Starr Centre for Applied Economics, New York University.
Galal, A. Jones, L, Tandon, P and Vogelsang, I (1994).Welfare Consequences of Selling Public Enterprises: An Empirical Analysis, Oxford, UK: Oxford University Press. Gazette of India-Extraordinary Notification, Part II, Sec 3 (ii) (1991 and 1997). Committee on Banking Sector Reform, Narasimham Committee, Ministry of Finance, Government of India.
Jones, Derek C and Mygind, Niels (1999). The Nature and Determinants of Ownership Changes after Privatization: Evidence from Estonia. Journal of Comparative Economics, 27,
422-441. http://dx.doi.org/10.1006/jcec.1999.1604
La Porta, R and Lopez-de-Silanes, F (1997). The Benefits of Privatization—Evidence from Mexico. Viewpoint 117, Washington, DC: World Bank.
Mohan (2005). India's experience with financial sector development. In: Basu P (ed) India's Financial Sector: Recent Reforms, Future Challenges, Macmillan India Ltd., New Delhi
Muniappan (2003). Management Challenges in Banking. Address at the NIBM Annual Day, January 6.
Narasimham, M. (1991). Report of the Committee on the Financial System, Government of India
Narasimham, M. (1998). Report of the Committee on Banking Sector Reforms, Government of India.
Neeraj Swaroop (2011). Stan Chart's regional chief executive for India and South Asia, RBI.
Rajput & Gupta (2010). Efficiency, Productivity and Soundness of the Banking Sector in India: Data Envelopment Analysis. BVIMR, Management Edge, December issue 2011.
Reddy (2002). RBI and banking sector reforms. Reserve Bank of India Monthly Bulletin (December), 99-1008.
Roma Mitra Debnath, Ravi Shankar (2008). Measuring performance of Indian banks: an application Data Envelopment Analysis.
Sahoo et al. (2007). Productive performance evaluation of the banking sector in India using data envelopment analysis. International Journal of Operations Research, 4(2), 63-79.
Appendix
Table I: Net Profits and Efficiency scores of foreign banks (as a group)
YEAR Net Profits Efficiency Scores
2008-09 452160 1
2009-10 363410 0.847199824
2010-11 395049 1
2011-12 468925 0.939770526
2012-13 534613 1
Source: RBI publication, a profile of banks
Table II. DEA Efficiency scores of foreign banks (Individual)
No Name of the Bank 2008-09 2009-10 2010-11 2011-12 2012-13
1 AB bank 1 1 0.601172 1 0.699619
2 Abu Dhabi bank 0.458207 0.496351 0.54963 0.720938 0.951938
3 American express 0.773916 0.902884 0.439515 0.751628 1
4 Antwerp diamond bank 1 1 0.857509 1 1
5 Bank Internasional Indonesia 1 1 1 1 1
6 Bank of America 0.651736 0.82944 1 0.782573 0.948063
7 Bank of Bahrain and Kuwait 0.280476 0.629936 0.527522 0.63218 0.699172
8 Bank of Ceylon 1 0.796349 0.777925 0.997031 0.937036
9 Bank of Nova Scotia 1 1 1 1 1
10 Bank of Tokyo and Mitsubishi 0.873156 0.553055 1 0.761446 0.802786
11 Barclays bank 0.478877 0.695733 0.755045 0.425205 0.775214
12 BNP Paribas 0.576987 0.793923 0.829472 0.659577 0.866426
13 China Trust Commercial bank 0.782612 1 0.626425 0.904947 0.492183
14 Citibank 0.502283 0.812547 0.714478 1 0.615562
15 Credit Agricol 1 1 1 1 1
16 DBS bank 0.651035 0.682199 0.565053 0.594942 0.68051
18 Hongkong and Shanghai bank 0.472976 0.579553 0.535199 0.466043 0.498516
19 HSBS bank Oman 0.290802 0.661437 0.569308 1 1
20 JP Morgan chase bank 1 0.358754 1 0.975539 1
21 JSC VTB bank 1 0.788584 1 0.883756 1
22 Krung Thai bank 1 1 1 1 1
23 Mashreq bank 0.735466 1 1 0.940777 1
24 Mizuho Corporation bank 0.475165 0.713082 0.958932 1 0.891328
25 Royal bank of Scotland 0.548023 0.842036 0.650288 0.569072 0.52036
26 Shinhan bank 0.544028 1 0.895405 1 0.89409
27 Societe Generale 0.493528 0.351455 0.630969 0.550888 0.693161
28 Sonali bank 0.597904 0.527954 0.26438 0.797799 1
29 Standard Chartered bank 0.509163 0.939145 0.716881 0.674554 0.699164
30 State bank of Mauritius 0.689526 1 0.65126 0.89717 1
31 UBS AG 0.603175 0.561402 0.878827 0.641769 1