RESEARCH
Effect of split application of different
N
rates on productivity and nitrogen use
efficiency of bread wheat (
Triticum aestivum
L.)
Fresew Belete
1,2*, Nigussie Dechassa
1, Adamu Molla
3and Tamado Tana
1Abstract
Background: Bread wheat is an important staple and cash crop grown by smallholder farmers in the central high-lands of Ethiopia. However, the productivity of the crop is constrained by low soil fertility and poor nitrogen fertilizer management in the area. For example, there is limited information on optimum rates and timing of nitrogen fertilizer application in the area. Therefore, a field experiment was conducted for two consecutive years (2014 and 2015) under rain-fed condition to determine the effect of N fertilizer rate and timing of application on grain yield and nitrogen use
efficiency of bread wheat. Factorial combinations of three N levels and five application times plus one control were
laid out in a randomized complete block design with four replications.
Results: The optimum grain yield (6060.04 kg ha−1) was recorded when 240 kg N ha−1 was applied ¼ at sowing, ½ at tillering and ¼ at booting, and it showed no significant additional response to N fertilizer above this rate. Higher N
level (360 kg N ha−1) always increased N content in the grain and nitrogen uptake by wheat crop. The best recovery
of nitrogen (59.74%) by wheat was found when 120 kg of nitrogen was applied (¼ at sowing, ½ at tillering and ¼ at booting). The nitrogen use efficiency traits decreased with increased N rate (120–360 kg N ha−1) indicating poor N uti-lization. The split application of nitrogen (¼ at sowing, ½ at tillering and ¼ at booting) produced the highest nitrogen use efficiency traits.
Conclusion: The application of 240 kg N ha−1 in three split doses (T
5) was required to obtain optimum wheat yield. In
addition, increasing the rate of nitrogen beyond 120 kg N ha−1 decreased nitrogen use efficiency traits.
Keywords: Efficiency, Recovery, Split, Uptake, Yield
© The Author(s) 2018. This article is distributed under the terms of the Creative Commons Attribution 4.0 International License (http://creat iveco mmons .org/licen ses/by/4.0/), which permits unrestricted use, distribution, and reproduction in any medium, provided you give appropriate credit to the original author(s) and the source, provide a link to the Creative Commons license, and indicate if changes were made. The Creative Commons Public Domain Dedication waiver (http://creat iveco mmons .org/ publi cdoma in/zero/1.0/) applies to the data made available in this article, unless otherwise stated.
Background
Bread wheat (Triticum aestivum L.) is one of the most important cereal crops in the world in terms of area cov-erage and production. It is a major source of nutrition for humans and livestock, estimated to contribute as much as 60 million tonnes of protein per year [1]. The total worldwide production of wheat in 2012 was around 671 million tonnes on an area of 215 million ha [2]. In Ethio-pia, wheat is grown approximately by 4.8 million farm-ers on 1.6 million hectares representing 13.33% of total crop area [3]. Data aggregated at a worldwide level over
several decades have shown a strong link between agri-culture production and fertilizer use [4]. Of the nutrients, nitrogen (N) is frequently regarded as the single most important mineral nutrient limiting crop production in many agricultural crops worldwide, and it is needed in large amount, as it constitutes 1–4% of the plant dry mat-ter [5]. However, the average yield of wheat in Ethiopia is very low; it is about 2.5 ton/ha as compared to the world’s average of about 3.4 ton/ha [2]. The low mean national yield of wheat is mainly the result of depleted soil fertility, especially nitrogen (N) deficiency, which is often encoun-tered in cool wet areas or in soils that are frequently water logged such as the highland Vertisols. Therefore, greater usage of chemical fertilizer has been advocated as
Open Access
*Correspondence: [email protected]
1 School of Plant Sciences, College of Agriculture and Environmental
a primary means of increasing wheat grain yield in Ethio-pia [6].
Although N is the key element in increasing produc-tivity and the increase of agricultural food production worldwide over the past four decades, a small fraction of this fertilizer is taken up by the plant [7], being 33% for wheat [8]. Poor N recovery is a function of N flows to competing pathways such as gaseous N losses, leaching and biological immobilization and in-efficiencies in crop N uptake and utilization [9, 10]. However, adoption of appropriate N fertilizer management practices is reported to increase N recovery up to 70–80% [11]. Split appli-cation of N is one of the methods to improve N use by the crop while reducing the nutrient loss through leach-ing, denitrification, runoff and volatilization [12]. Some research findings indicated that late season N application as dry fertilizer material was effective in attaining higher N recovery and use efficiency [13]. In addition, determin-ing the right N fertilizer rates and timing of application is decisive factor in obtaining higher yields [14].
In many parts of the world, limited research has been done on the effect of split application of N for wheat and its association with grain yield and NUE [15], which is also true in Ethiopia where information on the sub-ject is meager. Besides, matching crop N demand with available soil N has been challenging for wheat produc-ers in Enewari due to the susceptibility of Vertisols to water logging, which leads to denitrification, leaching and runoff losses during heavy rainfall [12]. Accord-ing to Molla [16], this forced farmers of Enewari to apply as large as 256 kg N ha−1 (some even apply more)
which is by far higher than the blanket recommendation (87 kg N ha−1). However, the optimum rate of nitrogen
fertilizer for wheat production in the study area and its
time of application are not yet investigated. This study was, therefore, conducted to determine the effect of N levels and time of application on yield and nitrogen use efficiency of bread wheat.
Methods The study site
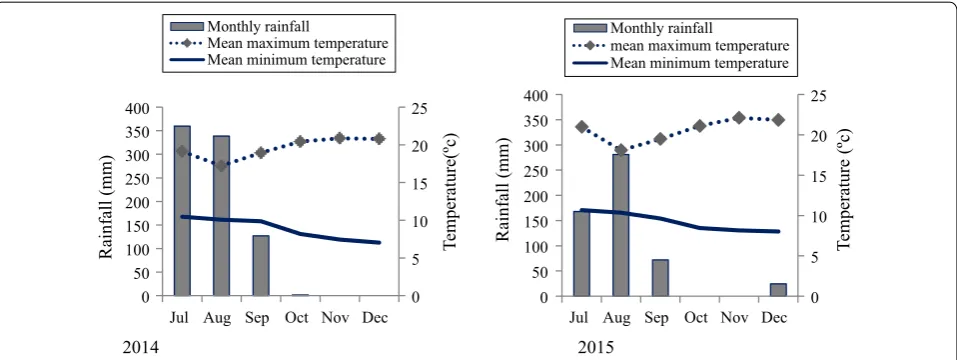
The study was conducted for two consecutive years dur-ing 2014 and 2015 main croppdur-ing seasons in the district of Moretina Jiru at the Enewari experimental field station in the central highlands of Ethiopia. Enewari is located at 9° 52′ N latitude, 39° 10′ E longitude at an altitude of 2680 meters above sea level. This area is typical of the rain-fed wheat-growing regions of Ethiopia with average annual rainfall of 1153.69 mm. The dominant soil type of the area is Vertisols which are known for their high water logging and drainage problems. Figure 1 shows monthly total rainfall and monthly mean temperatures at the experimental site over the 2-year study period.
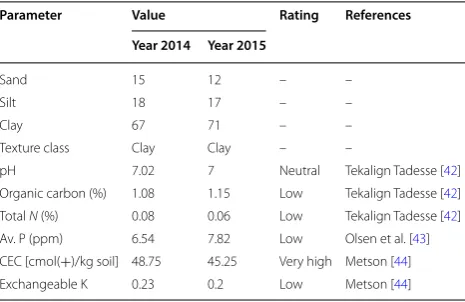
Prior to planting, the surface (0–20 cm) soil samples from ten spots across the experimental field were col-lected, composited and analyzed for determining selected soil physicochemical properties at Debre Berhan Agricul-tural Research Center following the procedure outlined by [17]. Values for the selected physicochemical proper-ties are presented in Table 1.
Description of the study materials
Fertilizer sources were urea (46% N) for nitrogen fer-tilizer and triple superphosphate (46% P2O5) for
phosphorus fertilizer. A wheat variety called Menze (HAR-3008) was used as a test crop which was devel-oped and released by DBARC (Debre Berhan Agriculture Research Center) in 2007. It has been widely promoted
2014 2015
0 5 10 15 20 25
0 50 100 150 200 250 300 350 400
Jul Aug Sep Oct Nov Dec
Te
mperature(ºc)
Rainfall (mm)
Monthly rainfall
Mean maximum temperature Mean minimum temperature
0 5 10 15 20 25
0 50 100 150 200 250 300 350 400
Jul Aug Sep Oct Nov Dec
Te
mperature
(ºc
)
Rainfall (mm)
Monthly rainfall
mean maximum temperature Mean minimum temperature
Fig. 1 Monthly total rainfall and average maximum and minimum temperatures in 2014 and 2015 growing seasons at Enewari, central highlands of
for its resistance to yellow rust and with a yield poten-tial of 1900–3300 kg ha−1 high yielder in Moretina Jiru
district, Enewari area. The variety is medium in maturity (154 days), with a medium stature of 64 cm [18].
Treatments and experimental design
The treatments consisted of complete factorial com-binations of three N fertilizer rates and five split N applications, plus one unfertilized control. The three N-fertilization levels were 120, 240 and 360 kg N ha−1.
The five N split application timings were adjusted accord-ing to Zadoks decimal growth stage for wheat [19] at the time when the moisture is available for nutrient disso-lution and absorption. These application timings were: T1=N applied ½ at sowing and ½ at tillering (Zadok
scale 21–22); T2= all N applied at tillering (Zadok scale
21–22); T3=N applied ½ at tillering (Zadok scale 21–22)
and 1/2 at booting (Zadok scale 41–45); T4=N applied
1/3 at sowing, 1/3 at tillering (Zadok scale 21–22) and 1/3 at booting (Zadok scale 41–45); and T5=N applied
1/4 at sowing, ½ at tillering (Zadok scale 21–22) and 1/4 at booting (Zadok scale 41–45).
These treatments were laid out in a Randomized Com-plete Block Design (RCBD) with four replications. The gross plot size of each treatment was 2 m × 3 m (6 m2)
accommodating eight rows spaced 20 cm apart. The plot size for planting was 1.6 m × 3.0 m (4.8 m2), and four
cen-tral rows were used for data collection and measurement. The distance between the plots and replications was kept at 0.5 m and 1 m apart, respectively.
Crop management
Wheat seed was sown by drilling in rows at the recom-mended rate of 150 kg ha−1 on July 24 in both years.
Each year, all the wheat plots were supplied with tri-ple superphosphate (TSP) at a recommended rate of 138 kg P2O5 ha−1 [20]. Similarly, the N was applied in
the form of urea (as per the treatment) at planting and the later stage splits were applied by side dressing at the specified Zadoks growth stages. Plots were kept free of weeds by hand weeding. No insecticide or fungicide was applied since there was no outbreak of any insect or disease incidence. Harvesting was done manually using hand sickle in late December.
Data collection and measurements
In both years, gain yield (kg ha−1) was determined
from the harvested net plot area of 2.4 m2 and was
adjusted to 12.5% moisture content. At crop matu-rity, a subsample from each net plot was harvested at ground level, oven-dried at 70 °C until constant weight was reached for dry weight determination and parti-tioned into straw and grain. The dried samples were milled and the grain and straw N content of the plant samples was determined using the micro-Kjeldahl method as stated by American Association of Cereal Chemists (AACC) [21]. Total grain N uptake (GNUP) in kg ha−1 was calculated by multiplying grain yields by
N content percentage. Total nitrogen uptake (TNUP) was calculated as the sum of the respective GNUP and SNUP values.
Nitrogen use efficiency traits
The following N-efficiency parameters were calculated for each treatment following Fageria [22]:
1. Agronomic efficiency (AE, kg kg−1) =Gf−Gu
Na , where
Gf is the grain yield of the fertilized plot (kg), Gu is
the grain yield in the unfertilized plot (kg) and Na is
the quantity of N applied.
2. Agro-physiological efficiency (APE, kg kg−1) =Gf−Gu
Nf−Nu, where Gf is the grain yield of the fertilized plot (kg),
Gu is the grain yield in the unfertilized plot (kg), Nf is
the N accumulation in the fertilized plot (kg) and Nu
is the N accumulation in the unfertilized plot (kg). 3. Apparent recovery efficiency (ARE, %) =Nf−Nu
Na ∗100, where Nf is the N accumulation by straw and grain in
the fertilized plot (kg), Nu is the N accumulation by
the straw and grains in the unfertilized plot (kg) and
Na is the quantity of N applied (kg).
4. The nitrogen harvest index (NHI) was determined as the ratio of nitrogen uptake by grain and nitrogen uptake by grain plus straw as described by [22]. Table 1 Soil physicochemical properties at the depth
of 0–20 cm during the years of 2014 and 2015 before sowing of bread wheat
Parameter Value Rating References
Year 2014 Year 2015
Sand 15 12 – –
Silt 18 17 – –
Clay 67 71 – –
Texture class Clay Clay – –
Data analysis
After verifying the homogeneity of error variances, com-bined analysis of variance was done using the procedure of SAS [23], and to facilitate factorial analysis, the control was excluded. Mean comparisons were done by Duncan’s multiple range tests Gomez and Gomez [24] at the 5% level.
Results Grain yield
Grain yield was significantly affected by the main effects of year, N rate, time of application as well as the inter-action effect of N rate × time of application. What is more, the interaction effect of year ×N rate, year × time of application and year ×N rate × time of application
did not affect this parameter (Table 2). The split appli-cation of the different N fertilizer rates significantly (P < 0.01) affected grain yield. The highest grain yield was obtained in response to the application of 360 kg N ha−1
in three splits of ¼ at sowing, ½ at tillering and ¼ at boot-ing, which was in statistical parity with the grain yield obtained in response to the application of 240 kg N ha−1
¼ at sowing, ½ at tillering and ¼ at booting (Table 3).
Nitrogen uptake Grain N uptake
Grain N uptake (GNUP) was significantly influenced by the rate and timing of N application. The interaction effect of N rate × time of application and year × time of application also revealed a significant effect on nitrogen
Table 2 Mean squares of analysis of variance for year, N fertilizer rate and time of N application, and their interaction
Y year, Rep replication, N N rate, T timing of N application, Df degree of freedom, GY grain yield, GNUP grain nitrogen uptake, TNUP total nitrogen uptake, AE agronomic efficiency, RE recovery efficiency, APE agro-physiological efficiency, NHI nitrogen harvest index
*Significant at the 0.05 probability level; **Significant at P < 0.01 probability level
Source DF GY GNUP TNUP AE RE APE NHI
Y 1 3,386,971** 789.77** 6813.22** 506.38** 4492.67** 270.07ns 839.08**
Rep (Y) 6 61,018 30.39 120.53 18.85 35.95 51.62 18.28
N 2 12,053,826** 22,875.82** 43,818** 2090.92** 2817.12** 3064.21** 120.10**
T 4 7,906,065** 4969.21** 10,914** 127.93** 1622.94** 287.29** 108.04**
N × T 8 1,127,802** 720.28** 1632.7** 6.12ns 68.09* 11.19ns 26.01*
Y × N 2 233836ns 211.25ns 552.37* 43.59** 142.47* 0.26ns 31.07*
Y × T 4 311205ns 254.56* 59.89ns 4.32ns 24.27ns 167.89** 43.21**
Y × N × T 8 231,387ns 70.27ns 115.94ns 4.89ns 32.98ns 6.73ns 11.28ns
Error 84 130,052 94.9 124.13 3.07 27.57 11.52 9.13
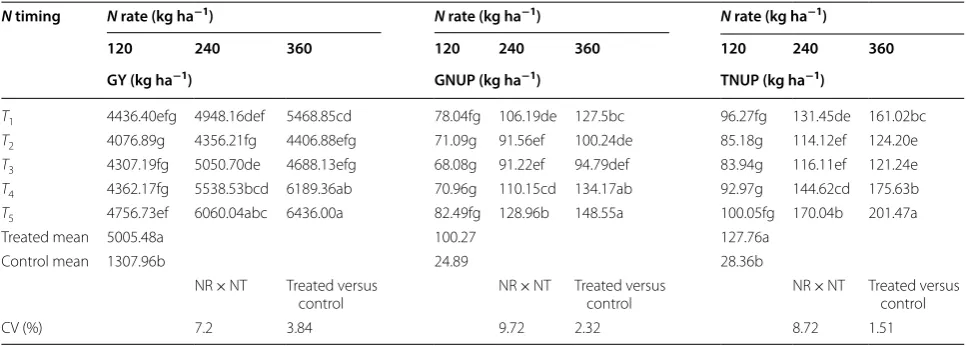
Table 3 Grain yield (GY), grain nitrogen uptake (GNUP) and total nitrogen uptake (TNUP) as influenced by the interaction effect of N fertilizer rate and time of N application
Means followed by the same letters for the same parameter are not significantly different at P≤ 0.05
CV Coefficient of variation, NR nitrogen rate, NT time of nitrogen application
T1=N application of ½ at sowing and ½ at tillering; T2=N application at tillering; T3=N application of ½ at tillering and ½ booting; T4=N application 1/3 at sowing, 1/3 at tillering and 1/3 at booting; and T5=N application ¼ at sowing, ½ at tillering and ¼ at booting
N timing N rate (kg ha−1) N rate (kg ha−1) N rate (kg ha−1)
120 240 360 120 240 360 120 240 360
GY (kg ha−1) GNUP (kg ha−1) TNUP (kg ha−1)
T1 4436.40efg 4948.16def 5468.85cd 78.04fg 106.19de 127.5bc 96.27fg 131.45de 161.02bc
T2 4076.89g 4356.21fg 4406.88efg 71.09g 91.56ef 100.24de 85.18g 114.12ef 124.20e
T3 4307.19fg 5050.70de 4688.13efg 68.08g 91.22ef 94.79def 83.94g 116.11ef 121.24e
T4 4362.17fg 5538.53bcd 6189.36ab 70.96g 110.15cd 134.17ab 92.97g 144.62cd 175.63b
T5 4756.73ef 6060.04abc 6436.00a 82.49fg 128.96b 148.55a 100.05fg 170.04b 201.47a
Treated mean 5005.48a 100.27 127.76a
Control mean 1307.96b 24.89 28.36b
NR × NT Treated versus
control NR × NT Treated versus control NR × NT Treated versus control
uptake by the grain. However, the effect of year, year ×N rate and year ×N rate × time of application on grain nitrogen uptake was nonsignificant (Table 2). Nitro-gen uptake by the grain tended to increase in response to the level of N as it rises from 120 to 360 kg ha−1 in
both growing years. The maximum grain N uptake value (148.55 kg ha−1) was obtained when 360 kg N ha−1 was
applied in three splits (¼ at sowing, ½ at tillering and ¼ at booting) while the lowest value (68.0 kg ha−1) was
recorded when 120 kg N ha−1 was applied equally at
tillering and booting (T3) (Table 3). With regard to the
interaction effect of year × time of N application, split application of N three times at sowing, tillering and booting (T5) produced the highest N uptake value in
both growing years while the lowest grain N uptake (78.61 kg ha−1) was recorded when N was applied equally
at tillering and booting (T3) in the year 2014 (Table 4).
Total N uptake
The analysis of variance indicated that year, N rate, time of N application had highly significant effect on total
nitrogen uptake of wheat. Likewise, the interaction of N rate × time of N application, year ×N rate also revealed a significant effect on total nitrogen uptake. But, the interaction effect of year ×N rate × time of application (Table 3) was not significant. The highest total N uptake value (201.47 kg ha−1) was attained when 360 kg N ha−1
was applied three times at sowing, tillering and booting (T5) while the lowest (83.94 kg ha−1) was recorded when
120 kg N ha−1 was applied equally at tillering and booting
(T3) (Table 3). The year ×N rate interaction shows that
wheat N uptake had the highest value (165.4 kg N ha−1)
in the year 2015 at the highest N rate while the lowest value (88.3 kg N ha−1) was recorded in 2014 at a rate of
120 kg N ha−1 which was statistically similar to that of
2015 under the same N rate (Table 4).
Nitrogen use efficiency traits Agronomic efficiency
Nitrogen agronomic efficiency (AE) represents the abil-ity of the plant to increase yield in response to N applied [25]. AE varied significantly according to year, N rates and timing of application, as well as by the interaction of year ×N rate. The interaction between year × time of application, N rate × time of application and year ×N rate × time of application did not show a significant effect on this parameter (Table 2). In 2015, the year with the highest grain yield, the value recorded for AE was sig-nificantly higher than 2014 under all N rates. The appli-cation of 120 kg N ha−1 produced the highest AE value
(28.8 kg ha−1) in 2015. The lowest (10.47 kg kg−1) value
was recorded when 360 kg N ha−1 was applied in 2014
(Table 5).
Nitrogen agro‑physiological efficiency
Nitrogen agro-physiological efficiency (APE) represents the ability of a plant to transform N acquired from fer-tilizer into economic yield (grain) [26]. APE was also influenced by the main effects of N rate and time of application and by the interaction of year × time of N application. However, the effect of year, the interaction of N rate × time of application and year ×N rate × time of N application had no significant effect on this index (Table 2). As to the interaction of year × time of N appli-cation, the highest APE (49.75 kg kg−1) was obtained
when N was applied in equal split at sowing and tillering in the year 2014 while the lowest value (35.4 kg kg−1) was
recorded in response to the application of nitrogen only once at tillering (T2) in 2015 (Table 6).
Nitrogen apparent recovery efficiency
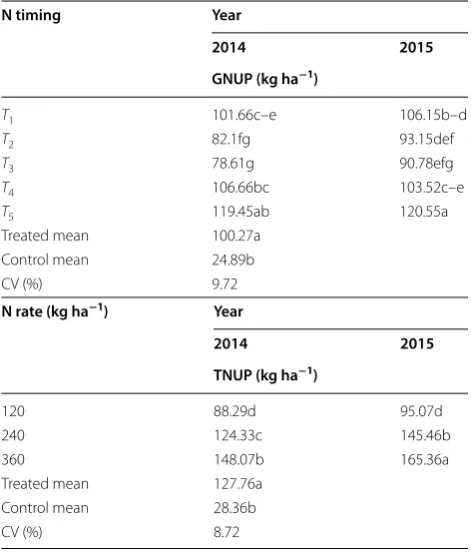
Nitrogen apparent recovery efficiency (RE) depends on the congruence between plant N demand and the quantity of N released from applied N [27]. RE varied Table 4 Interaction effect of the year ×N rate and year ×N
timing on GNUP and TNUP of bread wheat
Means followed by the same letters for the same parameter are not significantly different at P≤ 0.05
CV Coefficient of variation, NR nitrogen rate, NT time of nitrogen application
T1=N application of ½ at sowing and ½ at tillering; T2=N application at tillering;
T3=N application of ½ at tillering and ½ booting; T4=N application 1/3 at sowing, 1/3 at tillering and 1/3 at booting; and T5=N application ¼ at sowing, ½ at tillering and ¼ at booting
N timing Year
2014 2015
GNUP (kg ha−1)
T1 101.66c–e 106.15b–d
T2 82.1fg 93.15def
T3 78.61g 90.78efg
T4 106.66bc 103.52c–e
T5 119.45ab 120.55a
Treated mean 100.27a
Control mean 24.89b
CV (%) 9.72
N rate (kg ha−1) Year
2014 2015
TNUP (kg ha−1)
120 88.29d 95.07d
240 124.33c 145.46b
360 148.07b 165.36a
Treated mean 127.76a
Control mean 28.36b
significantly according to year and treatment (N appli-cation timing and N fertilizer rates) as well as by the interaction of N rate × time of N application (P < 0.05) and year ×N rate (P < 0.05). But, the interaction effect of year × time of N application and year ×N rate × time of
N application did not affect recovery efficiency of nitro-gen (Table 2). With regard to the interaction effect of year ×N rate, the highest RE (59.85%) was recorded in the year 2015 with the application of 120 kg N ha−1. The
lowest RE (31.5%) was recorded with the application of 360 kg N ha−1 in 2014 (Table 5). As to the interaction of
N rate × application timing, the highest RE (59.7%) was obtained from the application of 120 kg N ha−1 three
times in split (¼ at sowing, ½ at tillering and ¼ at boot-ing). However, the lowest value (25.64%) was obtained from the application of 360 kg N ha−1 two times equally
at tillering and booting (T3) which is statistically similar
to the recovery efficiency recorded when the highest level of nitrogen was applied only once at tillering (Table 7). Table 5 Interaction effect of year ×N rate on agronomic efficiency (AE), apparent recovery efficiency (RE) and nitrogen harvest index (NHI) of bread wheat
Means followed by the same letters for the same parameter are not significantly different at P≤ 0.05
CV Coefficient of variation
N rate (kg ha−1) Year Year Year
2014 2015 2014 2015 2014 2015
AE (kg kg−1) RE (%) NHI (%)
120 22.58b 28.75a 44.69c 59.85a 84.13a 78.07cd
240 14.1d 18.25c 37.36d 50.92b 82.13ab 75.60d
360 10.47e 12.47d 31.5e 39.48d 79.32bc 76.05d
CV (%) 9.86 11.94 3.82
Table 6 Interaction effect of year ×N timing on agro-physiological efficiency (APE) and nitrogen harvest index (NHI) of bread wheat
Means followed by the same letters for the same parameters are not significantly different at P≤ 0.05
CV Coefficient of variation
T1=N application of ½ at sowing and ½ at tillering; T2=N application at tillering;
T3=N application of ½ at tillering and ½ booting; T4=N application 1/3 at sowing, 1/3 at tillering and 1/3 at booting; and T5=N application ¼ at sowing, ½ at tillering and ¼ at booting
Year Year
2014 2015 2014 2015
N timing APE (kg kg−1) NHI (%)
T1 37.21d 38.43cd 82.8a 78.05bc
T2 45.23ab 35.4d 83.35a 80.06ab
T3 49.75a 42.2bc 81.43ab 78.34bc
T4 39.62cd 39.35cd 81.43ab 71.72d
T5 36.61d 38.02cd 80.31ab 74.69cd
CV (%) 8.45 3.82
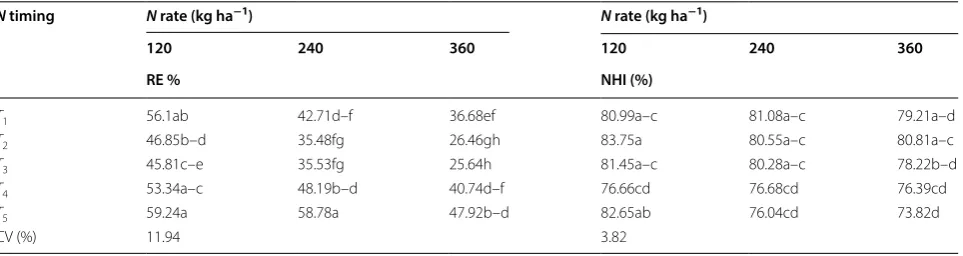
Table 7 Apparent nitrogen recovery efficiency (RE) and nitrogen harvest index (NHI) as influenced by the interaction effect of N fertilizer rate and time of N application
Means followed by the same letters for the same parameter are not significantly different at P≤ 0.05
CV Coefficient of variance
T1=N application ½ at sowing and ½ at tillering; T2=N application at tillering; T3=N application ½ at tillering and ½ booting; T4=N application 1/3 at sowing, 1/3 at tillering and 1/3 at booting; and T5=N application ¼ at sowing, ½ at tillering and ¼ at booting
N timing N rate (kg ha−1) N rate (kg ha−1)
120 240 360 120 240 360
RE % NHI (%)
T1 56.1ab 42.71d–f 36.68ef 80.99a–c 81.08a–c 79.21a–d
T2 46.85b–d 35.48fg 26.46gh 83.75a 80.55a–c 80.81a–c
T3 45.81c–e 35.53fg 25.64h 81.45a–c 80.28a–c 78.22b–d
T4 53.34a–c 48.19b–d 40.74d–f 76.66cd 76.68cd 76.39cd
T5 59.24a 58.78a 47.92b–d 82.65ab 76.04cd 73.82d
Nitrogen harvest index
Nitrogen harvest index is a measure of N partitioning in the crop, which provides an indication of how efficiently the plant utilized the acquired N for grain production [26]. Nitrogen harvest index (NHI) was significantly influenced by year, N rate and timing of N application. A generally significant effect of two-way interactions was also observed. However, the interaction effect of year ×N rate × time of application was not significant (Table 2). With regard to the interaction effect of year ×N rate, the highest value of NHI (84.13%) during the first growing year (2014) and the lowest value (75.6%) of NHI in the second growing year (2015) for wheat were recorded with the application of 120 kg N ha−1 and 360 kg N ha−1,
respectively (Table 5). In general, application of nitro-gen beyond 120 kg N ha−1 did not significantly affect
NHI in the second growing season while the applica-tion of 360 kg N ha−1 significantly produced lower NHI
as compared to the application of 120 kg N ha−1. With
regard to the year × time of N application, the highest NHI (83.35%) was recorded when the whole nitrogen was applied only once at tillering (T2) which was statistically
similar to the rest timing treatments in 2014, while the lowest NHI (71.72%) was recorded with the split applica-tion of nitrogen three times (T4) in 2015 (Table 6). As to
the interaction effect of N rate × time of application, the highest value (83.75%) was recorded due to the applica-tion of 120 kg N ha−1 only once at tillering (T
2), while
the lowest nitrogen harvest index (73.82%) was produced from the application of 360 kg N ha−1 three times in split
(¼ at sowing, ½ at tillering and ¼ at booting) (Table 7).
Discussion
Variations in climatic conditions registered during the cropping periods (Fig. 1) induced large variations in grain yield and the efficiency of N use by wheat. This agrees with Lopez-Bellido [28], who found a relation-ship between nitrogen fertilizer, wheat yield and seasonal trend, where there is a decline in yield during the wet years while little or no effect of N fertilizer during the dry years.
Grain yield
In the current experiment, increase in the N rate up to 240 kg N ha−1 and splitting it three times (T
5) had a
positive effect on grain yield of wheat and were not sig-nificantly different with the application of 360 kg N ha−1
with the same timing averaged over years. In general, the highest grain yield obtained in this experiment exceeds the yield obtained in response to the application of 120 kg N ha−1 all at once at tillering by 57.8% (Table 3).
Compared to the grain yield obtained from the control
plot, the grain yields obtained from the aforementioned most productive treatments were superior by 392.1% and 372%, respectively (Table 3). The optimum wheat grain yield was obtained in response to applying 240 kg N ha−1
applied in three splits ¼ at sowing, ½ at tillering stage of growth and ¼ at booting. This optimum yield exceeds the national average wheat yield of the country by about 152.5%, which is about 2.4 ton ha−1 [3]. It also exceeds
the world’s average yield of 3.4 t ha−1 by about 78% [29].
This indicates that evaluated N rates positively affected grain yield. This dramatic yield increase with N fertilizer application is the reason why farmers in the study area use higher rates of nitrogen (256 kg ha−1) than the
blan-ket recommendation (87 kg ha−1). The increased grain
yield due to the increased application of nitrogen might be attributed to the high concentration of N in the leaves which increased and prolonged the photosynthesis abil-ity of the plant which leads to an increase in grain yield. In agreement with the present result, Abedi [30] reported that different N rates (120, 240 and 360 kg ha−1) had a
significant effect on grain yield increment in wheat (46% at N= 120, 72% at N= 240, and 78% at N= 360) com-pared to control.
The result of the current experiment also revealed that the application of N three splits yielded more grain than application of nitrogen only once at tillering or just in two splits. The increase in grain yield due to the trice split application of nitrogen might be the better match-ing of N availability with the crop needs during the grow-ing period. Similarly, higher grain yield of wheat was reported when N was applied in three splits (at planting, tillering and post-anthesis) compared with two splits (at planting and tillering) and one-time application (at plant-ing) Brian [31]. Contrary to the current result, Chen and Neil [32] reported that split application of N did not affect wheat grain yield significantly. Similarly, there was a report where applications of all N rates at plant-ing and twice split application timplant-ing showed the same significance effect on grain yield (each 5.4 t ha−1) with
8% higher yield over trice split N timing [33]. The low-est value of grain yield in this experiment was recorded with the full application of N only at tillering, where the applied N was likely susceptible to leaching, denitrifica-tion and runoff loss as the amount of rainfall was higher during this period.
Nitrogen uptake
In this study, the highest GNUP was 118% higher than the lowest value which was obtained with the applica-tion of 120 kg N ha−1 equally at tillering and booting
(Table 3). The overall higher grain N uptake due to the split application of the highest N rate (360 kg N ha−1) at
more efficient N mobilization to the grain at grain filling stage. This is in conformity with Jan [34] who reported higher efficiency of N partitioning to the grain when N was supplied in splits (at planting, tillering and stem elon-gation). Similarly, Fageria and Baligar [35] reported that split applications of nitrogen fertilizer cause high amount of nitrogen content to be taken by the grain rather than by straw of wheat. The present experiment also revealed nitrogen fertilizer rates significantly increased wheat N uptake. Uptake values were similar in both growing years at lower N rate, whereas significant differences were recorded between all fertilizer rates, rising as ferti-lizer rates increased. This might be because application of extra N through increased levels increased the concen-tration of N in the soil and led to greater absorption of nutrients, which ultimately resulted in vigorous growth of bread wheat in terms of higher dry matter accumula-tion and enhanced the total uptake of nitrogen. The result also revealed that the split application of the highest dose (360 kg N ha−1) and applying it three times (T
5) increased
wheat N uptake. The increased N uptake of wheat due to the split application of nitrogen (T5) could be ascribed to
the continuous supply of N which may have increased the synchrony between plant N demand and supply from the soil coupled with the reduction of N losses via denitrifica-tion, leaching or runoff [4]. This proposition is consistent with the report of N uptake by wheat crop which is signif-icantly enhanced when application of the highest dose of N fertilizer was done and synchronized with the time of high demand of the plant for uptake of the nutrient [36].
Nitrogen use efficiency traits
The present study demonstrated that a significant varia-tion existed in the nitrogen use efficiency traits for year, rate and timing of N applications. In 2015, the year with the highest grain yield had the highest AE and RE of wheat under the rate of 120 kg ha−1 which were
nota-bly higher than the year 2014 under the same N rate. The increase in AE and RE in the second growing sea-son might be due to the absence of water logging which reduces the availability of nitrogen which is the problem of the first growing season. In general, AE diminished as the N fertilizer rates increased in both growing sea-sons, with significant differences among all the levels of nitrogen. This result is in agreement with the finding of Roberts [37] who reported that increase in N fertilizer rates resulted in a decline in agronomic efficiency. Higher AE could be obtained if the yield increment per unit N applied is high because of reduced losses and increased uptake of N [25]. Nitrogen agronomic efficiency value ranging from 10 to 30 is common, and values higher than 30 indicate efficiently managed systems [26]. Consistent with this suggestion, in this study N application resulted
in AE between 10.47 and 28.75 kg kg−1 in both the
grow-ing seasons, showgrow-ing the importance of appropriate man-agement system in wheat production.
The highest APE recorded in this study during the first wet growing season (2014) as a result of splitting nitrogen equally at tillering and booting implies that there was a higher loss of nitrogen in treatments where N was applied during sowing time. However, in the second growing year (2015), time of application had less impact on APE since the loss of nitrogen was minimized as a result of reduc-tion in waterlogging problem due to a lower amount of rainfall. In addition, the higher APE due to the split appli-cation of nitrogen in two splits (at tillering and booting) in both growing seasons might be attributed to adequacy of available nitrogen during grain development stage that might have increased the assimilation and redistribution of N from the vegetative plant component to wheat grain. In contrast to the present finding, lower nitrogen utiliza-tion efficiency was reported in the early N applications at planting and tillering compared with additional split application at anthesis [34].
The current experiment also revealed that the highest value of 59.8% for recovery efficiency (RE) was obtained with the triplicate application of 120 kg N ha−1 (T
5) and
it is 131% higher than the lowest value of 25.64% which was obtained with the application of the highest dose in two equal splits at tillering and booting. In line with the present result, Haile [36] reported 13.7% rise in recovery efficiency of nitrogen as a result of N application three times (¼ at sowing, ½ at mid-tillering and ¼ at anthesis) at lower N rate. The application of N three times in split (T5) produced higher RE for all the N rates tested in the
current experiment. This implies if N is applied in sev-eral small doses during the period of rapid crop growth, rather than as a single large dose at the beginning of rapid crop growth, then losses are minimized and crop recovery is maximized. Furthermore, the highest RE in the second growing season might be due to lower rain-fall which improved the availability of nitrogen than the first growing season; thus, the crop has used the applied nitrogen more efficiently. The highest RE was recorded at a rate of 120 kg N ha−1 in both growing seasons. In
line with the current experiment, increase in apparent nitrogen recovery efficiency was reported at the rate of 150 kg N ha−1 for wheat and barley [38]. In contrast,
lower NUE (27.10%) with the highest nitrogen rate of 120 kg N ha−1 and the highest value (39.27%) at the
lowest N rate of 30 kg N ha−1 were reported on bread
of 65.8% Selamyihun [40] and 39.27% [25] on wheat in Ethiopia. However, the common apparent recovery N-efficiency values ranging between 30 and 50%, and 50 and 80% indicate well-managed system [27].
In the current experiment, application of nitrogen beyond 120 kg N ha−1 did not significantly affect NHI
in the second growing season while the application of 360 kg N ha−1 significantly produced lower NHI
as compared to the application of 120 kg N ha−1. The
first growing season produced the highest NHI than the second growing season under all the levels of N. This showed a strong influence of rainfall, in the vari-able response of NHI to time of application. The higher NHI during the first growing season might be due to the production of a lower aboveground biomass yield due to water logging, which resulted from higher rain-fall. The lower NHI in the second growing as compared to the first growing season might be attributed to the increase in aboveground biomass yield. In general, the highest NHI value was recorded when nitrogen was applied only at tillering during both growing seasons. This might be due to the lowest aboveground biomass and grain yield produced by this treatment. Similarly, a higher nitrogen harvest index for wheat was obtained with treatments which produced the least aboveground biomass and grain yield [41].
Conclusion
The results of this study have demonstrated that appli-cation of a large quantity of nitrogen (a minimum of 240 kg N ha−1) in three split doses (T
5) was required
to obtain optimum wheat yield, which is about 2.5-fold higher than the national average yield of the crop in Ethiopia. The soil requires application of as much as 240 kg N ha−1 to produce about 6 tons of wheat per
hectare which implies that the soil is productive unless the nitrogen uptake efficiency of the crop possibly is reduced as a result of its characteristic waterlogging condition. The importance of splitting nitrogen in three split doses (1/4th at sowing, ½ at tillering and the other 1/4th at booting) was also evidenced in the optimum yields and improving nitrogen recovery. Nitrogen ferti-lizer led to a general decrease of nitrogen use efficiency traits in both growing years. Higher N level increased N content in the grain and nitrogen uptake by wheat crop. In view of the current result, the significant interaction with year indicates that the efficiency of broad bed and furrows to drain excess soil moisture is lower in years which receive a higher amount of rainfall. Therefore, it should be supported by developing wheat varieties tol-erant or resistant to such shocks.
Abbreviations
AE: agronomic efficiency; APE: agro-physiological efficiency; CV: coefficient of variation; GNUP: grain nitrogen uptake; GY: grain yield; MoARD: Ministry of Agriculture and Rural Development; N: nitrogen; NHI: nitrogen harvest index; NUE: nitrogen use efficiency; RE: recovery efficiency; TNUP: total nitrogen uptake.
Authors’ contributions
FB conceived the study and design, collected the data, performed the analysis on all samples, interpreted the data, wrote the manuscript and acted as cor-responding author. ND, AM and TT assisted in analysis and interpretation of data and drafting of the manuscript. All authors read and approved the final manuscript.
Author details
1 School of Plant Sciences, College of Agriculture and Environmental Sciences,
Haramaya University, P.O. Box 138, Dire Dawa, Ethiopia. 2 Department of Plant
Sciences, College of Agriculture and Natural Resource Sciences, Debre Berhan University, P.O. Box 445, Debre Berhan, Ethiopia. 3 Chickpea and Malt
Barley-Faba Bean Projects ICARDA, Addis Ababa, Ethiopia.
Acknowledgements
The authors would like to thank Debre Berhan Agricultural Research Center for providing the land and allowing us to use their facilities and Debre Berhan University for allowing the corresponding author a leave of absence to con-duct PHD dissertation research from which this article was emanated.
Competing interests
The authors declare that they have no competing interests.
Availability of data and materials
The authors want to declare that they can submit the data at whatever time based on your request. The data used for the current study are available from the corresponding author on reasonable request.
Consent for publication
Not applicable.
Ethics approval and consent to participate
Not applicable.
Funding
All authors dedicated their additional working hours to develop this paper with no specific grant from any funding agency.
Publisher’s Note
Springer Nature remains neutral with regard to jurisdictional claims in pub-lished maps and institutional affiliations.
Received: 25 September 2018 Accepted: 7 December 2018
References
1. Shewry PR. Wheat. J Exp Bot. 2009;60(6):1537–53.
2. FAOSTAT. online [Internet]. 2014 [cited 2015 Mar 6]. Available from: http:// faost at.fao.org/site/291/defau lt.aspx.
3. CSA (Central Statistic Agency). AGricultural Sample Survey Report on Area and Production of Major Crops for the period 2015/2016 cropping season volume l. Statistical bulletin 584, Addis Ababa, Ethiopia. vol. 584, Statistical Bulletin. 2016.
4. Tilman D, Cassman K, Matson P, Naylor R, Polasky S. Agricultural sustain-ability and intensive production practices. Nature. 2002;418:671–7. 5. Good A, Shrawat K, Muench G. Can less yield more? Is reducing nutrient
input into the environment compatible with maintaining crop produc-tion? Trends Plant Sci. 2004;9(12):597–605.
7. Carranca C. Nitrogen use efficiency by annual and perennial crops. In: Lichtfouse E, editor. Farming for food and water security. Berlin: Springer; 2012. p. 57–82.
8. Raun WR, Johnson GV. Improving nitrogen use efficiency for cereal production. Agron J. 1999;91:357–63.
9. Moll RH, Kamprath EJ, Jackson WA. Analysis and interpretation of factors which contribute to efficiency of nitrogen utilization. Agron J. 1982;74(3):562.
10. Huggins D, Pan W. Key indicators for assessing nitrogen use efficiency in cereal-based agroecosystems. J Crop Prod. 2003;8(1–2):157–85. 11. Legg JO, Meisinger JJ. Soil nitrogen budgets. In: Stevenson FJ, editor.
Nitrogen in agricultural soils. Madison: American Society of Agronomy; 1982. p. 503–66.
12. Gehl RJ, Schmidt JP, Maddux LD, Gordon WB. Corn yield response to nitro-gen rate and timing in sandy irrigated soils. Agron J. 2005;97(4):1230–8. 13. Anthony G, Woodard B, Hoard J. Foliar N application timing influence
on grain yield and protein concentration of hard red winter and spring wheat. Argon J. 2003;95:335–8.
14. López-Bellido JRR, López-Bellido L. Efficiency of nitrogen in wheat under Mediterranean conditions: effect of tillage, crop rotation and N fertiliza-tion. F Crop Res. 2001;71(1):31–46.
15. Brian NO, Mohamed M, Joel KR. Seeding rate and nitrogen manage-ment effects on spring wheat yield and yield components. Am J Agron. 2007;99:1615–21.
16. Molla A. On-farm participatory evaluation of bread wheat productiv-ity under different NP levels, precursor crops, and Vertisols types in the highlands of central Ethiopia. In: Achievements of integrated crop, soil and water management research activities on wheat. EAAP/EIAR. Addis Abeba, Ethiopia; 2015.
17. Page AL, Miller RH, Keeney. DR. Methods of Soil Analysis. Part 2. Chemical and Microbiological Properties. 2nd edn. Soil Science Society of America; Madison, Wisconsin, U.S.A. 1982.
18. MoARD (Ministry of Agriculture and Rural Development. Crop variety register. Animal and plant health regulatory directorate Issue No.12. June, 2009. Addis Ababa, Ethiopia. 2009.
19. Zadoks JC, Chang TT, Konzak CF. A decimal code for the growth stages of cereals. Weed Res. 1974;14:415–21.
20. Molla A. Farmers’ knowledge helps develop site specific fertilizer rate recommendations, central highlands of Ethiopia. World Appl Sci J. 2013;22(4):555–63.
21. American Association Cereal Chemists (AACC). Approved Methods of the American Association Cereal Chemists. American Association of Cereal Chemists, Inc., St. Paul, Minnesota; 2000.
22. Fageria NK. Nitrogen management in crop production. Boca Raton: CRC Press; 2014.
23. SAS Institute Inc. SAS® 9.3 Companion for Windows. Cary, NC: SAS Insti-tute Inc. Cary, NC, USA; 2011.
24. Gomez KA, Gomez AA. Statistical procedures for agricultural research. New York: Wiley; 1984.
25. Craswell ET, Godwin DC. The efficiency of nitrogen fertilizers applied to cereals in different climates. Adv Plant Nutr. 1984;1:1–55.
26. Dobermann AR. Nitrogen Use Efficiency – State of the Art. Univ Nebraska. 2005;17.
27. Fageria NK, Baligar VC, Jones CA. Growth and mineral nutrition of field crops. 3rd ed. New York: Taylor, Francis Group; 2011. p. 530.
28. López-Bellido L, López-Bellido RJ, Redondo R. Nitrogen efficiency in wheat under rainfed Mediterranean conditions as affected by split nitro-gen application. F Crop Res. 2005;94:86–97.
29. MAFAP (Monitoring African Food and Agriculture Policies). Improving incentives to expand wheat production in Ethiopia. Policies Brief, #9. 2013.
30. Abedi T, Alemzadeh A, Kazemeini SA. Wheat yield and grain pro-tein response to nitrogen amount and timing. Aust J Crop Sci. 2011;5(3):330–6.
31. Brian NO, Mohamed M, Joel KR, Otteson BN, Mergoum M, Ransom JK, et al. Seeding rate and nitrogen management effects on spring wheat yield and yield components. Am J Agron. 2007;99(6):1615–21. 32. Chen C, Neill K. Response of spring wheat yield and protein to row
spacing, plant density, and nitrogen application in Central Montana. In: Fertilizer Fact: No.37. Montana State University, Agricultural Experiment Station and Extension Service, USA. 2006;.
33. Chibsa T, Gebrekidan H, Kibret K, Tolessa D. Effect of rate and time of nitrogen fertilizer application on durum wheat (Triticum turgidum Var L. Durum) grown on Vertisols of Bale highlands, southeastern Ethiopia. Am J Res Commun. 2016;5(1):39–56.
34. Jan MT, Khan JM, Khan A, Arif M, Shafi M, Nullah N. Wheat nitrogen indices response to nitrogen source and application time. Pak J Bot. 2010;42(6):4267–79.
35. Fageria NK, Baligar VC. Enhancing nitrogen use efficiency in crop plants. Adv Agron. 2005;88:97–185.
36. Haile D, Nigussie D, Ayana A. Nitrogen use efficiency of bread wheat: effects of nitrogen rate and time of application. J Soil Sci Plant Nutr. 2012;12(123):389–409.
37. Roberts TL. Improving nutrient use efficiency. Turk J Agric. 2008;32:177–82.
38. Delogu G, Cattivelli L, Pecchioni N, De Falcis D, Maggiore T, Stanca AM. Uptake and agronomic efficiency of nitrogen in winter barley and winter wheat. Eur J Agron. 1998;9(1):11–20.
39. Sinebo W, Gretzmacher R, Edelbauer A. Genotypic variation for nitrogen use efficiency in Ethiopian barley. F Crop Res. 2004;85:43–60.
40. Selamyihun K, Tanner DG, Tekalign M. Residual effects of nitrogen ferti-lizer on the yield and N composition of succeeding cereal crops and on soil chemical properties of an Ethiopian highland Vertisol. Can J Soil Sci. 2000;80:63–9.
41. López-Bellido L, López-Bellido RJRJ, Redondo R. Nitrogen efficiency in wheat under rainfed Mediterranean conditions as affected by split nitro-gen application. F Crop Res. 2005;94(1):86–97.
42. Tadesse T. Soil, plant, water, fertilizer, animal manure and compost analysis manual: Plant Science Division Working Document No. 13. Addis Ababa, Ethiopia: International Livestock Center for Africa. 1991. 43. Olsen SR, Cole CV, Watandbe FS, Dean LA. Estimation of available Phos-
phorus in soil by extraction with Sodium Bicarbonate. J Chem Inf Model. 1954;53(9):1689–99.