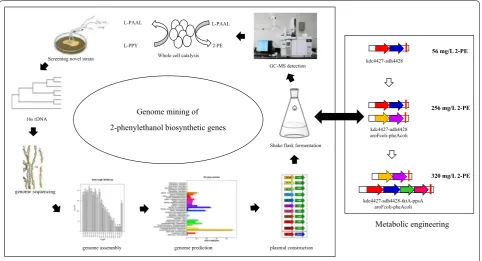
Genome mining of 2-phenylethanol biosynthetic genes from Enterobacter sp. CGMCC 5087 and heterologous overproduction in Escherichia coli
Full text
Figure
Related documents
See generally Waverly-Arkansas, Inc. [and] that the arbitration agreement was a contract of adhesion and that the circumstances surrounding its execution rendered it
The chairman was glad to say that at the first meeting of this new subcommittee (which had been called the subcommittee of fifteen on naval limitation), he had
Exploring the generation of more knowledge towards knowing the immune mechanisms, viral pathogenesis, molecular and genetic studies, and discovering appropriate and
giving two reasons why the two-member Board’s findings should be invalid: first, the Board may not delegate its power to a three member group if it knows that the group will soon
The purpose of this study was to examine the statistical relationship between levels of physical fitness as measured by the FitnessGram and school performance, utilizing
Results: CFR of SAP group was significantly lower than that of control group and the more the number of coronary lesions, the lower the CFR of SAP group; serum Lp(a), LDL-C,
Clinical assessment tools commonly used for FRDA, such as the Scale for Assessment and Rating of Ataxia (SARA) [3], the Friedreich Ataxia Rat- ing Scale (FARS) [4], and
Experiment 2 consisted of a motor imagery task during which 16 healthy volunteers imagined shoulder girdle elevations or finger pinching while an EEG was recorded; the
