Open Access
Research article
Solvent effect on the spectral properties of Neutral Red
Muhammad A Rauf*
1, Ahmed A Soliman
2and Muhammad Khattab
1Address: 1Chemistry Department, P.O.Box 17551, UAE University, Al-Ain, UAE and 2Chemistry Department, Cairo University, Cairo, Egypt
Email: Muhammad A Rauf* - [email protected]; Ahmed A Soliman - [email protected]; Muhammad Khattab - [email protected]
* Corresponding author
Abstract
Background: The study was aimed at investigating the effect of various solvents on the absorption spectra of Neutral Red, a dye belonging to the quinone-imine class of dyes. The solvents chosen for the study were water, ethanol, acetonitrile, acetone, propan-1-ol, chloroform, nitrobenzene, ethyleneglycol, acetic acid, DMSO and DMF.
Results: The results have shown that the absorption maxima of dyes are dependent on solvent polarity. In non-hydrogen-bond donating solvents, solvation of dye molecules probably occurs via dipole-dipole interactions, whereas in hydrogen-bond donating solvents the phenomenon is more hydrogen bonding in nature. To estimate the contribution of the different variables on the wave number of the Neutral Red dye, regression analyses using the ECW model were compared with the π* scale model. This showed that the unified scale for estimating the solvent effect on the absorption of the Neutral Red dye is more adopted and more applicable than the π* scale model.
Conclusion: Absorption maxima of dyes are dependent on solvent polarity. Solvation of dye molecules probably occurs via dipole-dipole interactions in non-hydrogen-bond donating solvents, whereas in hydrogen-bond donating solvents the phenomenon is more hydrogen bonding in nature. The unified scale for estimating the solvent effect on the absorption of Neutral Red dye is more adopted and more applicable than the π* scale model. This may be due to complications from both π-π* charge transfer interactions and incomplete complexation of the solute; these effects are averaged out in the derived β and π parameters and thus limit their applicability.
Background
It is very well known that chemical processes are influ-enced by the properties of solvents in which they are car-ried out. These include the dipole moment, dielectric constant, and refractive index values. The most important property in this regard is the solvent polarity which can change the position of the absorption or emission band of molecules by solvating a solute molecule or any other molecular species introduced into the solvent matrix. A number of literature citations are available for the studies
of simple organic molecules with regard to their interac-tions in different solvents [1-3]. Dye molecules on the other hand are complex organic molecules which might carry charge centers (as an integral part of their structure or because they are derived salts) and are thus prone to absorption changes in various media [4,5]. The structural complexity of dye molecules has drawn attention of many workers to understand their behavior in various media [6-8]. These changes are important to understand various physical-organic reactions of these macromolecules Published: 18 September 2008
Chemistry Central Journal 2008, 2:19 doi:10.1186/1752-153X-2-19
Received: 8 May 2008 Accepted: 18 September 2008
This article is available from: http://journal.chemistrycentral.com/content/2/1/19
© 2008 Rauf et al
which have become important in different fields of pure and applied chemistry such as synthetic chemistry, extrac-tion of dyes from soluextrac-tion, photodynamic therapy and chelation processes [9-11].
Experimental
The dye used in this work was purchased from Sigma Chemicals and used as such. The solvents used in this work namely propan-1-ol, chloroform, acetonitrile, DMSO, ethanol, acetone, and DMF were purchased from Merck or Fluka and had a purity of > 99%. They were kept over molecular sieves 5Å prior to their use in this work. Stock solution of the dye was made in all these solvents and then diluting them appropriately with a given sol-vent. Absorption spectrum of each dye solution (1 × 10⁻⁵
M) was recorded on a CARY 50 UV/VIS spectrophotome-ter, using a 1 cm quartz cell.
Results and discussion
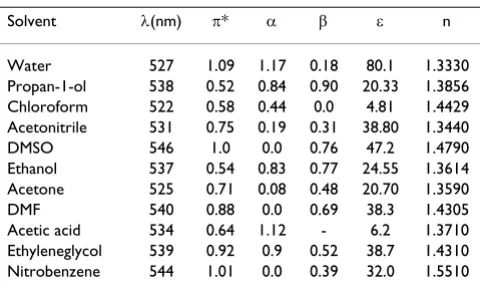
The present study deals with the solvent effect on the absorption spectra of Neutral Red (NR), which belongs to Quinone-Imine class of dyes. The molecular structure of this dye is shown in figure 1. Absorption spectrum of the dye solution was recorded in different solvents with the aim to probe the effects of various solvents and correlate various absorption parameters to dye spectra in various solvents. For this purpose solvents of different types were selected, firstly the non hydrogen-bond donating solvents (also called as non-HBD type of solvents) such as acetone, acetonitrile, nitrobenzene, DMF and DMSO; and sec-ondly the hydrogen-bond donating solvents (also called as HBD type solvents) such as water, ethanol, acetic acid, ethyleneglycol, chloroform and propan-1-ol. The values of λmax of Neutral Red in these solvents are given in Table 1. One can see from this table that the absorption maxi-mum of the dye is affected by solvent type and has a max-imum shift of Δλ = 22 nm for the solvents used in this work. Thus this change in spectral position can be used as
a probe for various types of interactions between the sol-ute and the solvent.
The analysis of solvent effect on spectral properties of dye solutions were carried out by using the spectral position in above mentioned solvents and correlating these with the Kamlet-Taft solvent properties namely, π*, α, β, n and ε, obtained from the literature [12,13]. Since the shift in
λmax values with solvent type reflects dye-molecule inter-actions, an attempt was made to study this phenomenon in detail. Table 1 shows the essential solvent parameters required in this study along with the absorption maxima for each dye in these solvents. The spectral position of dye in various solvents has revealed interesting results. Since all the solvents used in this work were polar in nature, one would expect that the dye would bind more strongly to a more polar solvent and thus cause the spectra to shift to lower wavelengths. However, this is not seen from our results as λmax is lowest in the case of chloroform. This is due to the reason that all other solvents used in this work are more polar than chloroform and can engage more strongly in a solvent-solvent type of interaction. Thus their ability to interact with the dye molecules becomes less. On the other hand, chloroform which is less polar, can interact with the dye molecule in terms of dipole-dipole interactions, thereby resulting in a net stabilization of the ground state of the dye molecule, and hence one sees a hypsochromic shift in the spectrum in this solvent. On the other hand, the λmax value is shifted to lower energies in highly polar solvents such as DMSO because of strong sol-vent-solvent interaction or the specific interaction between the solvent and hydrogen from NH2group in the dye molecule.
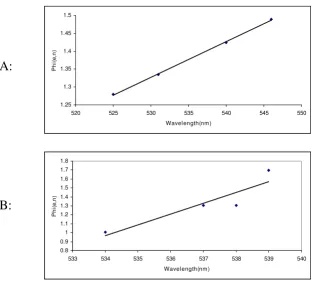
A plot of λmax versus the dielectric constant values in vari-ous non-HBD and HBD solvents is shown in figure 2A and 2B. It can be seen from this figure that with increasing dielectric constant values, the spectrum is shifted to higher wavelength. The spectral changes observed in water were quite distinct from those in other solvents. The λmax of dye solution in water was found at lower wavelengths as
com-Chemical Structure of Neutral Red
Figure 1
Chemical Structure of Neutral Red.
N H N
N
CH3
CH3
H3C
H2N
Cl
Table 1: Absorption maxima of Neutral Red(NR) in various solvents and selective Kamlet-Taft solvent properties
Solvent λ(nm) π* α β ε n
Water 527 1.09 1.17 0.18 80.1 1.3330
Propan-1-ol 538 0.52 0.84 0.90 20.33 1.3856
Chloroform 522 0.58 0.44 0.0 4.81 1.4429
Acetonitrile 531 0.75 0.19 0.31 38.80 1.3440
DMSO 546 1.0 0.0 0.76 47.2 1.4790
Ethanol 537 0.54 0.83 0.77 24.55 1.3614
Acetone 525 0.71 0.08 0.48 20.70 1.3590
DMF 540 0.88 0.0 0.69 38.3 1.4305
Acetic acid 534 0.64 1.12 - 6.2 1.3710
Ethyleneglycol 539 0.92 0.9 0.52 38.7 1.4310
pared to in other solvents although its dielectric constant is the highest among these solvents. This might be due to the formation of strong hydrogen bond between dye and water molecule. Thus different phenomena are present in various media. An increase in λmax values with π* (dipo-larity/polarizability) as shown in figure 3 also indicates that dye interaction becomes different with increasing capability of a given solvent to form H bonds in solution.
The absorption data of dyes in various solvent was also analyzed in terms of various polarity scales. The first method involves the transformation of λmax (nm) of dyes in various solvents into molar transition energies {ET(dye), kcal/mole} by using the following relationship [14]
ET(dye) = 28,591/λmax (1)
Absorption shift of dye solution as a function of solvent polarizability (π*)
Figure 3
Absorption shift of dye solution as a function of solvent polarizability (π*). 0
0.2 0.4 0.6 0.8 1 1.2
520 525 530 535 540 545 550
Wavelength(nm)
Pi
*
(A) Absorption shift of dye solution as a function of dielectric constant in non-hydrogen-bond donating solvents, (B) Absorp-tion shift of dye soluAbsorp-tion as a funcAbsorp-tion of dielectric constant in hydrogen bonding solvents
Figure 2
(A) Absorption shift of dye solution as a function of dielectric constant in non-hydrogen-bond donating sol-vents, (B) Absorption shift of dye solution as a function of dielectric constant in hydrogen bonding solvents.
0 10 20 30 40 50
520 525 530 535 540 545 550
Wavelength(nm)
D
iel
ec
tr
ic
c
o
n
s
ta
n
t
A:
0 5 10 15 20 25 30 35 40 45
533 534 535 536 537 538 539 540
Wavelength(nm)
D
iel
ec
tr
ic
c
o
n
s
ta
n
t
The ET(dye) values signify transition energy which also reflects the stabilization of the dye in its ground state in a given solvent. This may be due to either hydrogen bond formation or dye-solvent interaction. Therefore, ET(dye) provides a direct empirical measure of dye solvation behavior. Again, from Table 2 one can see that ET(dye) is maximum in the case of chloroform as compared to other solvents. The rationale behind this is the same as described previously.
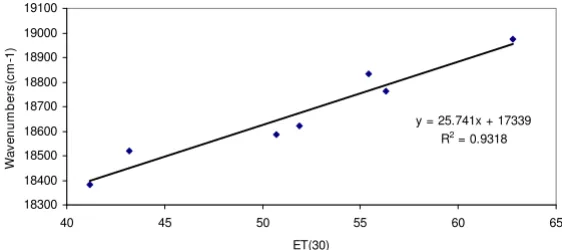
The absorption values were also related to the solvent polarity parameter, namely ET(30), which also considers other interactions besides those of specific nature. The val-ues of ET(30) were obtained from the literature for various solvents used in this work and are listed in Table 2[14]. Figure 4 shows the correlation between the absorption value (in wavenumber) and ET(30) for the dye studied in this work. A linear correlation of absorption energy cover-ing a range of ET(30) indicates the presence of specific nature of interactions between the solute and solvents.
The spectral band shifts were also related to solvent parameter φ(ε, n) which is given as follows [15]
φ(ε, n) = f(ε, n) + 2 g(n) (2)
The function takes into account two important properties of the solvents namely the dielectric constant and the refractive index and is a sum of two independent terms namely f(ε, n) and g(n) which are given as follows
f(ε, n) = [(2n2+1)/(n2+2)] [{(ε- 1/ε+2)} - {(n2-1)/
(n2+2)}] (3)
g(n) = 3/2 [(n4-1)/(n2+2)2] (4)
where, ε is the dielectric constant and n is the refractive index and both these quantities reflect the freedom of motion of electrons in the solvent and the dipole moment of the molecules. Specific solvent effects occur by interac-tions of the solvent and the chromophores. Figure 5A and 5B shows the trend when the spectral position (λmax) of the dyes in various solvents (non-protic and protic) were plotted against the solvent polarity parameter φ(ε, n).
Since dye spectra are also influenced by the presence of a co-solvent, some studies on selective mixtures of solvents were also carried out and their results are hereby
dis-Plot of absorption value (in wavenumber) of Neutral Red in various solvents versus the ET (30) values
Figure 4
Plot of absorption value (in wavenumber) of Neutral Red in various solvents versus the ET (30) values. y = 25.741x + 17339
R2 = 0.9318
18300 18400 18500 18600 18700 18800 18900 19000 19100
40 45 50 55 60 65
ET(30)
W
a
v
e
num
be
rs
(c
m
-1
)
Table 2: Empirical parameters of solvent polarity
Solvent ET (30) kcal/mol ET (NR) kcal/mol f(ε, n) g(n) φ(ε, n)
Water 62.8 54.25 0.91363 0.226851 1.367334
Propan-1-ol 50.7 53.14 0.77905 0.262207 1.303468
Chloroform 39.1 54.77 0.37245 0.300187 0.972823
Acetonitrile 55.4 53.84 0.86602 0.234279 1.334575
DMSO 45.1 52.36 0.84132 0.323779 1.488877
Ethanol 51.9 53.24 0.81293 0.245993 1.304918
Acetone 39.1 54.45 0.79028 0.244380 1.279042
DMF 43.2 52.95 0.83944 0.292021 1.423484
Acetic acid 51.7 53.54 0.49972 0.254245 1.004628
Ethyleneglycol 56.3 54.77 1.11158 0.292350 1.696281
cussed. For these studies, two sets of solvents were selected. The first solvent mixture selected was ethanol and water mixture, which belongs to the HBD type of sol-vents, whereas, the second solvent mixture consists of ace-tone and ethanol, which belong to the HBD-non HBD type of solvents. The mixtures were prepared in various mole fractions containing a fixed amount of dye.
In ethanol-water mixtures, the spectra were found to shift towards red with increasing mole fraction of ethanol. These results show that the dye cation is preferentially sol-vated by the alcoholic component in all mole fractions in aqueous mixtures with ethanol. It is well known that water makes strong hydrogen-bonded nets in the water-rich region, which are not easily disrupted by the cosol-vent [13]. This can explain the strong preferential salva-tion by the alcoholic component in this region since water preferentially interacts with itself rather than with the dye. In the alcohol-rich region, the alcohol molecules are freer to interact with the water and with the dye, since their nets formed by hydrogen bonds are weaker than in water. In this situation, the alcohol molecules can, to a greater or lesser extent, interact with water through hydrogen bond-ing. A change in the ET(NR) as a function of mole fraction
of water in water-ethanol mixture is shown in figure 6A. The ET(NR) in the mixture was calculated by the method given in the literature [5].
On the other hand, in the case of acetone and ethanol mixtures, the spectra also shifted towards red with increas-ing amount of ethanol. The solvation of dye in non-HBD type of solvent mainly occurs through charge-dipole type of interaction, whereas in HBD type of solvent, the inter-action also occurs by hydrogen bonding besides the usual ion-dipole interaction. In this situation, the methyl groups of acetone are responsible for the solvation of the dye. Thus in these solvent mixtures, increasing the amount of HBD solvent (ethanol in this case) shall break these interactions with the dye molecule, thereby shifting the spectra towards red. A similar behavior is reported in the literature for some other probe molecule [5]. Figure 6B shows the change in ET(NR) as a function of mole fraction of ethanol in acetone-ethanol mixture.
Great attention has been paid to the problem of solvent effect on spectral, chemical and reactivity data [16]. Kam-let considered the total solvent effect to be composed of three independent contributions; solvent polarity (π*),
(A) Absorption shift of dye solution in non-hydrogen-bond donating solvents as a function of solvent polarity parameter φ(ε, n), (B) Absorption shift of dye solution in hydrogen bonding solvents as a function of solvent polarity parameter φ(ε, n)
Figure 5
(A) Absorption shift of dye solution in non-hydrogen-bond donating solvents as a function of solvent polarity parameter φ(ε, n), (B) Absorption shift of dye solution in hydrogen bonding solvents as a function of solvent polarity parameter φ(ε, n).
1.25 1.3 1.35 1.4 1.45 1.5
520 525 530 535 540 545 550 Wavelength(nm)
Ph
i(
e
,n
)
A:
0.8 0.9 1 1.1 1.2 1.3 1.4 1.5 1.6 1.7 1.8
533 534 535 536 537 538 539 540 Wavelength(nm)
Ph
i(
e
,n
)
acidity(α) and basicity(β) for hydrogen bond accep-tor(HBA) solvents. These contributions are gathered in one equation as follows:
ν = νo + sπ* + aα + bβ (5)
Where ν is the wave number at maximum absorption, s, a
and b are regression factors, whose values depend on the extent of contribution of each solvent parameter (π*, α,β) to the predicted values ν'.
A unified scale of solvent polarities, taking into account both the non-specific and specific donor acceptor interac-tions of these solvents with solute probes, was introduced by Drago and co-workers and shown in its mathematical form below [17]:
Δχ = E*A EB + C*ACB + S'P + W (6)
where Δχ or χ is used as a value of physicochemical prop-erty measured in the specific solvent polarity; P is a
meas-(A) ET(NR) as a function of mole fraction of water in water-ethanol mixture, (B) ET(NR) as a function of mole fraction of etha-nol in acetone- ethaetha-nol mixture
Figure 6
(A) ET(NR) as a function of mole fraction of water in water-ethanol mixture, (B) ET(NR) as a function of mole fraction of ethanol in acetone- ethanol mixture.
A:
53 53.2 53.4 53.6 53.8 54 54.2 54.4
0 0.1 0.2 0.3 0.4 0.5 0.6 0.7 0.8 0.9 1 Mole fraction of w ater
E
T
(d
ye
),
kca
l/
m
o
l
B:
53 53.2 53.4 53.6 53.8 54 54.2 54.4 54.6
0 0.1 0.2 0.3 0.4 0.5 0.6 0.7 0.8 0.9 1 Mole fraction of ethanol
E
T
(d
y
e
),
k
c
a
l/
m
o
l
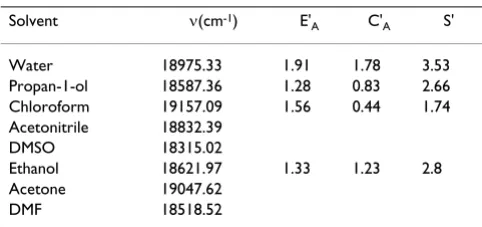
Table 3: Neutral Red absorption (cm-1) in various solvents and
some selective solvent properties
Solvent ν(cm-1) E'
A C'A S'
Water 18975.33 1.91 1.78 3.53
Propan-1-ol 18587.36 1.28 0.83 2.66
Chloroform 19157.09 1.56 0.44 1.74
Acetonitrile 18832.39
DMSO 18315.02
Ethanol 18621.97 1.33 1.23 2.8
Acetone 19047.62
ure of the susceptibility of the solute probe to solvation and W is the value of Δχ at S' = 0 value which provides a scale of non-specific solvating ability. Similarly, EB and CB
are solvent parameters which are reported for the donors reacting with a wide range of acceptors in solvents of poor solvation property [18].
The unified scale of solvent polarities was expanded to include the very important class of polar hydrogen bond-ing solvents. Since these solvents are capable of undergo-ing both non-specific and specific donor-acceptor interactions with donor solute probes, the above equation modifies to:
Δχ = E'A E*B + C'
AC*B + S'P + W (7)
The prime values represent parameters that are consistent with enthalpy based parameters of the ECW model [18-21].
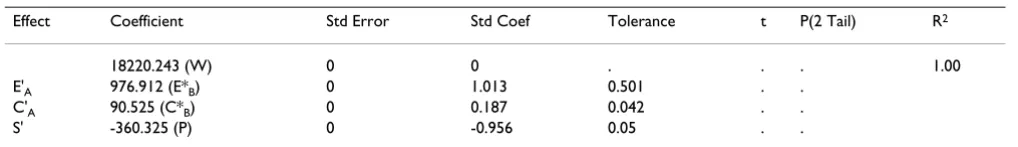
To estimate the contribution of the different variables on the wave number of the Neutral Red dye; the coefficients in equations (5) and (7) were estimated using a multiple linear regression analyses (where Δχ in equation 7 is used as the wave number (ν) of the dye in the different sol-vents), and the results are shown in Tables 3, 4 and 5. The high R2 value for the regression using ECW model
com-pared with that of the π* scale model reflect the fact that the unified scale for estimating the solvent effect on the absorption of Neutral Red dye is more adopted and more applicable than the π* scale model. This may be due to complications from both π-π* charge transfer interactions and incomplete complexation of the solute; these effects are averaged out in the derived β and π parameters and thus limit their applicability [22]. DMF and DMSO were incompatible and this could be attributed to complica-tions in the specific interaccomplica-tions which may arise due to a
variety of bonding sites of different extent in these sol-vents.
Conclusion
Absorption maxima of dyes are dependent on solvent polarity. Solvation of dye molecules probably occurs via dipole-dipole interactions in non-hydrogen-bond donat-ing solvents, whereas in hydrogen-bond donatdonat-ing sol-vents the phenomenon is more hydrogen bonding in nature. The unified scale for estimating the solvent effect on the absorption of Neutral Red dye is more adopted and more applicable than the ð π* scale model. This may be due to complications from both πð- π* charge transfer interactions and incomplete complexation of the solute; these effects are averaged out in the derived β and π parameters and thus limit their applicability.
Table 5: ECW parameters of the Neutral Red as a new probe
Effect Coefficient Std Error Std Coef Tolerance t P(2 Tail) R2
18220.243 (W) 0 0 . . . 1.00
E'A 976.912 (E*B) 0 1.013 0.501 . .
C'A 90.525 (C*B) 0 0.187 0.042 . .
S' -360.325 (P) 0 -0.956 0.05 . .
Table 4: π*-scale parameters of Neutral Red
Effect Coefficient Std Error Std Coef Tolerance t P(2 Tail) R2 R2
adjusted
19473.838 (νo) 278.232 0 . 69.991 0 0.830 0.702
π* -438.856 (s) 288.061 -0.322 0.952 -1.523 0.202
α 63.216 (a) 135.746 0.098 0.969 0.466 0.666
Open access provides opportunities to our colleagues in other parts of the globe, by allowing
anyone to view the content free of charge.
Publish with
Chemistry
Central and every
scientist can read your work free of charge
W. Jeffery Hurst, The Hershey Company.
available free of charge to the entire scientific community peer reviewed and published immediately upon acceptance cited in PubMed and archived on PubMed Central yours you keep the copyright
Submit your manuscript here:
http://www.chemistrycentral.com/manuscript/
Competing Interests
The authors declare that they have no competing interests.
References
1. Reichardt C: Solvents and solvent effects in organic chemistry.
2nd edition. VCH, New York, USA; 1991.
2. Ikram M, Rauf MA, Jabeen Z: Solvent effect on Si-H stretching bands of substituted silanes. Spectrochim Acta, Part A 1994,
50:337-342.
3. Mishra A, Behera RK, Behera PK, Mishra BK, Behera GB: Cyanines during the 1990s: A Review. Chem Rev 2000, 100:1973-2011. 4. Oliveira CS, Bronco KP, Baptista MS, Indig GL: Solvent and
con-centration effects on the visible spectra of tri-para -dialkylamino-substituted triarylmethane dyes in liquid solu-tions. Spectochim Acta, Part A 2002, 58:2971-2982.
5. Bevilaqua T, Goncalves TF, Venturini CG, Machado VG: Solute-vent and solSolute-vent-solSolute-vent interactions in the preferential sol-vation of 4-[4-(dimethylamino)styryl]-1-methylpyridinium iodide in 24 binary solvent mixtures. Spectochim Acta, Part A
2006, 65:535-542.
6. El-Kemary MA, Khedr RA, Etaiw SH: Fluorescence decay of sin-glet excited-state of safranine T and its interaction with ground-state of pyridinthiones in micelles and homogeneous media. Spectochim Acta, Part A 2002, 58:3011-3014.
7. Ishikawa M, Ye JY, Maruyama Y, Nakatsuka H: Triphenylmethane Dyes Revealing Heterogeneity of Their Nanoenvironment: Femtosecond, Picosecond, and Single-Molecule Studies. J Phys Chem A 1999, 103:4319-4331.
8. Jedrzejewska B, Kabatc J, Paczkowski J: Dichromophoric hemicy-anine dyes. Synthesis and spectroscopic investigation. Dyes Pigm 2007, 74:262-268.
9. Rauf MA, Akhter Z, Kanwal S: Photometric studies of the com-plexation of Sudan Red B with Mn+2 and Fe+3 ions. Dyes Pigm
2004, 63:213-215.
10. Gomez ML, Previtali CM, Montejano HA: Photophysical proper-ties of safranine O in protic solvents. Spectrochim Acta, Part A
2004, 60:2433-2439.
11. Souza HM, Bordin JO: Strategies for prevention of transfusion-associated Chagas' disease. Trans Med Rev 1996, 10:161-170. 12. Kamlet JM, Abboud JLM, Abraham MH, Taft RW: Linear solvation
energy relationships. 23. A comprehensive collection of the solvatochromic parameters, .pi.*, .alpha., and .beta., and some methods for simplifying the generalized solvatochro-mic equation. J Org Chem 1983, 48:2877-2887.
13. Marcus Y: The properties of organic liquids that are relevant to their use as solvating solvents. Chem Soc Rev 1993,
22:409-416.
14. Reichardt C: Solvatochromic Dyes as Solvent Polarity Indica-tors. Chem Rev 1994, 94:2319-2358.
15. Kawski A: On the Estimation of Excited-State Dipole Moments from Solvatochromic Shifts of Absorption and Flu-orescence Spectra. Z Naturforsch, A: Phys Sci 2002, 57A:255-262. 16. Kamlet JM, Abboud JL, Taft RW: The solvatochromic
compari-son method. 6. The .pi.* scale of solvent polarities. J Am Chem Soc 1977, 99:6027-6038.
17. Drago RS, Hirsch MS, Ferris DC, Chronister CW: A unified scale of solvent polarities for specific and non-specific interactions.
J Chem Soc Perkin Trans 2 1994, 2:219-230.
18. Drago RS: The interpretation of reactivity in chemical and biological systems with the E and C model. Coord Chem Rev
1980, 33:251-277.
19. Drago RS, Ferris DC, Wong N: A method for the analysis and prediction of gas-phase ion-molecule enthalpies. J Am Chem Soc 1990, 112:8953-8961.
20. Drago RS, Vogel GC: Interpretation of spectroscopic changes upon adduct formation and their use to determine electro-static and covalent (E and C) parameters. J Am Chem Soc 1992,
114:9527-9532.
21. Drago RS, Vogel GC, Dadmum A: Addition of new donors to the E and C model. Inorg Chem 1993, 32:2473-2479.