ISSN 0975-928X
Research Note
Improving genetic base of
Gossypium barbadense
for developing potential
inter specific hybrids
Ashoka Kusugal, Patil S. S, *Pranesh K. J, Rajeev S and Reddy H. K
Department of Genetics and Plant breeding, ARS, Hebballi, UAS, Dharwad 580005 *Email:[email protected]
(Received: 13 May 2014; Accepted: 01 Jul 2014)
Abstract
The present study was carried out at the Main Agricultural Research Station, Dharwad during kharif 2012. The experimental material comprised 45 Gossypium barbadense genotypes, which were evaluated for variability for yield and yield components to know the improvement made over commercial check (Suvin) and to identify lines suitable for development of inter specific hybrids. Out of 10 characters studied in 46 potential Barbadense lines, seed cotton yield, number of bolls per plant and number of monopodia per plant recorded high PCV and GCV indicating that substantial variability exists for these characters and also higher heritability was recorded for these characters. The mean performance of Barbadense genotypes indicated that YBD- 10 recorded the highest mean value for seed cotton yield followed by YB-IPS 14 andYBD-18. The genotypes YB-YB-IPS 14, DBSI-75-10,1 and RHCB – 010 exhibited high fiber length and strength. The potential lines YB-IPS 14 and YB-IPS 25 are examples for blending of both yield and fiber quality.
Key words:
Gossypium barbadense, PCV, GCV, heritability, genetic advance Pima cotton or Egyptian cotton, Gossypium barbadense is known for its better fiber properties being cultivated in less than 2% in the world (Chen
et al., 2007). India can play an important role in meeting the global requirement of extra long staple cotton by developing highly potential Barbadense varietal lines. The genetic improvement of cotton is being far from the requirement as evidenced by the fact that there are few varieties developed and less popularized after Suvin variety to improve and replace for productivity and fiber quality of Barbadense cotton. This situation has arisen mainly because Barbadense still continues to be a weak link in Indian cotton research as compared to other cultivated species. Therefore looking to its superior fiber quality it is necessary to give much attention to improve the yielding ability of the high priced G. barbadense cotton.
Though cotton production in the country has registered marked improvement in recent decades, improvements in yield levels of interspecific hybrids appear to have reached stagnation. The important reason attributed for stagnation is lack of systematic efforts of genetic improvement of Barbadense cotton in deriving high potential and high combiner lines to develop good interspecific hybrids. To overcome decline in productivity and fiber quality of ELS cotton, there is necessity of development of potential Barbadense lines. Once such potential lines are identified, they can be utilized for developing potential interspecific hybrids. Realizing these problems, efforts are made at Dharwad to develop new potential Barbadense and hirsutum lines which in turn helps for the improvement of interspecific hybrids.
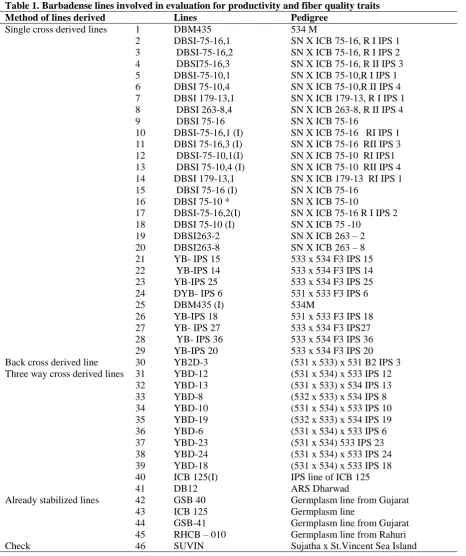
The field experiment was conducted with the forty six G. barbadense genotypes including check Suvin during kharif 2012 at Main Agricultural Research Station Dharwad in a randomized block design with two replications. The forty five Barbadense lines included in this study are having Suvin genetic background, which were derived from single cross, three-way cross and back cross and were evaluated for productivity and fiber quality traits. Name of the accessions, method of deriving line and their pedigree are given in Table 1. Each genotype was sown in two rows of 6m length with spacing of 90 x 30 cm. Package of practices and plant protection measures were adapted as per recommendation to raise a good crop.
Observations were recorded in three randomly selected plants in each plot of every replication for seed cotton yield (kg/ha), plant height (cm), number of monopodia per plant, sympodia per plant, bolls per plant, reproductive points on sympodia, seed index (g), ginning out turn (%), and fiber quality characters such as 2.5% span length (mm), bundle strength (g/tex), fiber fineness (µg/inch), uniformity index and strength to length (S/L) ratio as per the standard procedure. From the mean values of each character, components of variability, heritability and genetic advance in per cent over mean were estimated as per the procedure outlined by Singh and Chaudhary (1977). The fiber quality data for these Barbadense lines was not included in the analysis since it was unreplicated data, instead directly interpreted.
ISSN 0975-928X
investigated were significantly different. This indicates the presence of considerable level of genetic variability among the genotypes for the characters under study. The data on per se
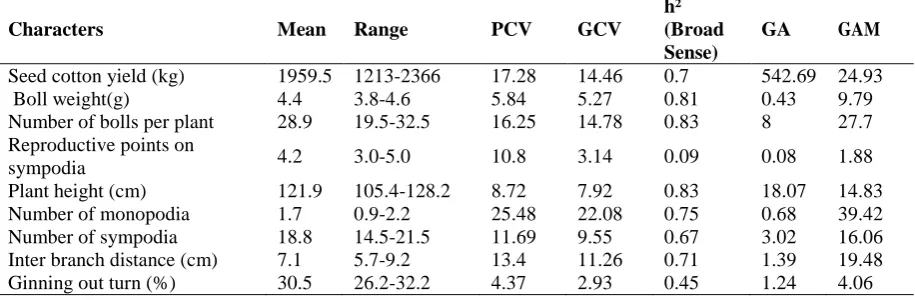
performance of forty six genotypes for mean yield and yield related traits except fiber quality traits were analyzed for determining the variance parameters such as phenotypic coefficient of variance (PCV), genotypic coefficient of variance (GCV), broad sense heritability (h2), genetic advance (GA) and genetic advance as percentage over mean (GAM). The results pertaining to these aspects are presented in Table 3.
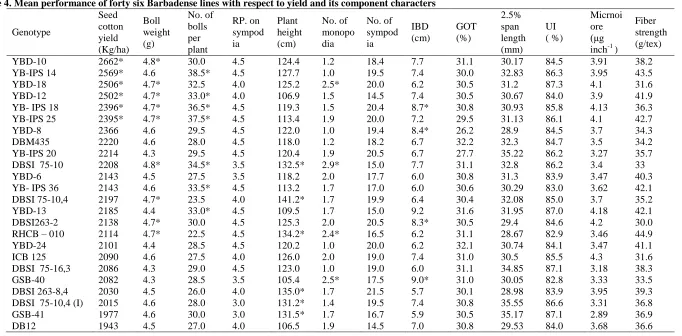
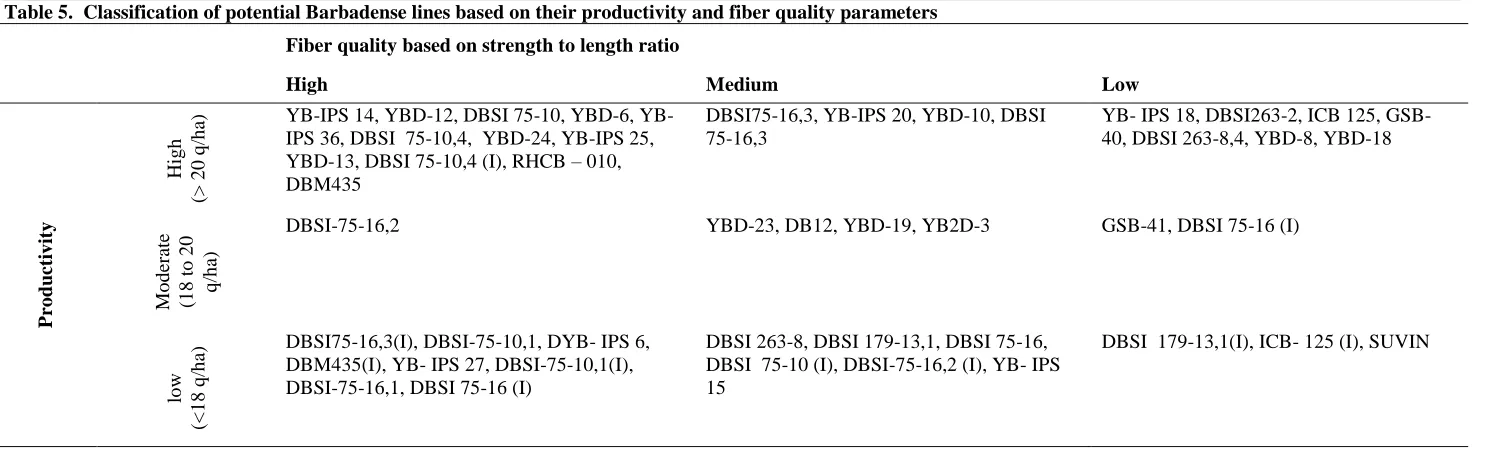
The per se performance of lines for all characters is presented in Table 4. Among the 46 Barbadense lines, YBD-10 (2662 Kg ha-1), YB-IPS 14(2662 Kg ha-1), YBD-18(2506 Kg ha-1), YBD-12 (2502 Kg ha-1) and YB-IPS 25 (2396 Kg ha-1) are the top five lines which recorded significantly higher for seed cotton yield. Among these, some of the lines like YB-IPS 14, YBD-12 and YB-IPS 25 can be used in development of interspecific hybrids, since these lines are grouped under high yield and high fiber quality (Table 5). These lines also exhibited higher mean value for yield attributing characters
viz., number of bolls per plant, boll weight and ginning out turn. Interestingly, these characters have directly influence on increase in seed cotton yield (Pavasia et al., 1999).
In present study, phenotypic coefficient of variation (PCV) was higher than genotypic coefficient of variation (GCV) indicating the influence of environment for all the traits under study. A narrow difference between PCV and GCV suggested that negligible influence of extraneous factor. For seed cotton yield, number of bolls per plant, reproductive points on sympodia, number of monopodia, number of sympodia per plant PCV and GCV were moderate to high (Table 3) concurrent results to this effect was also reported by Krishnarao and Mary (1990), Laxman and Ganesh (2003), Gururajan and Sundar (2004), Kaushik et al. (2006), Tuteja et al.
(2006), Kale et al. (2007), Sakthi et al. (2007), Neelima et al. (2008) and Dhamayanathi et al.
(2010).
It is essential to know the heritability estimates for different characters because the heritability estimate separates the environmental influence from the total variability and indicates the accuracy with which a genotype can be identified by its phenotypic performance, thus making the selection more effective. As such, the heritability in broad sense is the proportion of genotypic variability to the total variability; its importance has been emphasized by Johnson et al. (1955). In this study heritability (broad sense) of more than 60% was observed for seed cotton yield (70%), boll weight (81%), number of bolls (83%),
plant height (83%), number of monopodia per plant (75%), number of sympodia per plant (67%) and inter branch distance (71%). Higher heritability indicates that selection can be practiced for these characters based on their per se
performance. These results are in conformity with the studies of Choudhary et al. (1992), Tommer et al. (1992), Patel et al. (1994), Dedaniya et al.
(1994), Sandhu (1997), Sambamurthy et al. (1995), Valramathi et al. (1998). Moderate broad sense heritability was observed for ginning out turn (45%) and similar result was reported by Lakwander Singh et al. (1979). Low broad sense heritability of 9 per cent was recorded for reproductive points on sympodia (Desai et al., 1990).
Though the heritability estimates are the true indicators of genetic potentiality of the genotypes which can be used as a tool for selection, changes in the values of the heritability due to fluctuations of the environmental factors detract for total dependence on such estimates. However, heritability estimates when considered in conjunction with the predicted genetic gain (genetic advance) form a reliable tool for selection. They indicate the expected genetic advance of a character in response to the certain selection pressure imposed on them.
The higher heritability coupled with high genetic advance over mean was observed for the characters viz., seed cotton yield, number of bolls per plant and number of monopodia suggesting that selection of lines can be done based on their
per se performance for these characters.
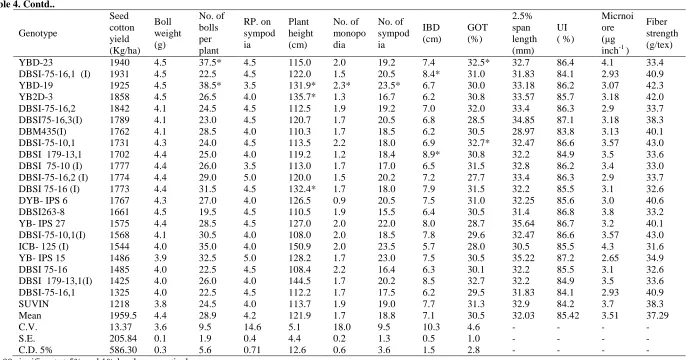
Fiber quality traits exhibited variability between the lines studied. Some lines were observed to be superior for both productivity and fiber quality but some lines were observed to be superior either for productivity or for fiber quality parameters. From Table 4 it is clear that the lines YB- IPS 27 (35.64 mm), YB-IPS 20 (35.22 mm), DBSI 75-10, 4 (I) (35.55 mm) and YB-IPS 14 (32.83 mm) are superior for 2.5% span length. Similarly the lines RHCB – 010 (44.9 g/tex), DBSI-75-10,1 (43.0 g/tex) and YB-IPS 25 (42.7 g/tex) are superior for fiber strength. Some of the lines viz., DBSI-75-10, 1, YB- IPS 27, YB2D-3 and YB-IPS 20 were observed to exhibit superiority for all fiber quality parameters when considered simultaneously. So, such lines can use in the development of interspecific hybrids.
ISSN 0975-928X
yield was recorded in YB-IPS 10 (2662 Kg/ha), with a boll weight of 4.8 g and 30.0 bolls per plant. This line recorded good values of fiber strength (38.2 g/tex), 2.5% span length (30.17 mm) and micronaire value (3.91 μg inch-1). The line YB-IPS 14 recorded high productivity (2569 Kg/ha) and also superiority for fiber quality traits like fiber strength (43.5 g/tex), 2.5% span length (32.83 mm) and micronaire value (3.95 μg inch-1). Similarly, line YB-IPS 25 recorded the higher values for seed cotton yield (2395 Kg/ha), boll weight of 4.7g and 37.5 bolls per plant, fiber strength (4.1 g/tex), 2.5% span length (31.13 mm) and micronaire value (4.1 μg inch-1). Therefore, YB-IPS 14 and YB-IPS 25 lines are examples for blending of both yield and quality.
The results of genetic variability studies indicated that the newly developed Barbadense lines are more potential and superior than the existing germplasm lines and national check Suvin for both productivity and fiber qualities. The improvement over check was observed in both productivity and fiber quality traits.
In case of seed cotton yield, a wide range was observed among genotypes. The highest seed cotton yield was recorded in YBD-10 (2662 Kg ha -1) and the lowest in Suvin (1218Kg ha-1) with overall mean of 1959.5 Kg ha-1 but only six genotypes recorded significantly higher yield. Similarly, PCV value of 17.28 and GCV value of 14.46 were observed. 70 per cent of heritability and 24.93 per cent as per cent of mean (GAM) was observed for seed cotton yield.
References
Chen, Z. J., Brain E. S. and Elizabeth D., 2007, Towards sequencing cotton (Gossypium) genomes. Plant Physiol., 145:1303-1310. Choudhary, P. N., Borale, D. N. and Narkhed, B. N.,
1992, Genetic variability, metroglyph and index score analysis in desi cotton. J. Maharashtra Agric. Univ., 17(3): 486-487.
Dedaniya, A. D. and Pethani, K. V., 1994, Genetic variability correlations and path analysis in desi cotton (G. arboreum L.). Indian J. Genet., 54: 229-234.
Desai, N. C., Badaya, S. N. and Kukadid, N. U., 1990, Genetics of yield components in diploid cotton.
Indian J. Genet., 50 (2): 193-197.
Dhamayanathi, K. P. M, Manickam, S. and Rathinavel, K., 2010, Genetic variability studies in
Gossypium barbadense L. genotypes for seed cotton yield and its yield components. Electron. J. Plant Breed., 1(4): 961-965.
Gururajan, K.N. and Sundar S., 2004, Yield component analysis in American cotton. Paper presented in Int. Symp. on “Strategies for Sustainable Cotton Production – A Global Vision” held at University of Agricultural Sciences, Dharwad., 23rd – 25th November, 2004
Johnson, H. W., Robinson, H. F. and Comstock, R. E., 1955 Estimate of genetic and environmental
variability in soybean. Agron. J., 47: 314-318. Kale, U. R., Kalpande, S., Annapurve, S. N. and Gite,
V. K., 2007, Yield components analysis in American cotton (Gossypium hirsutum L.).
Madras Agric. J., 94 : 156-161
Kaushik, S. K. and Kapoor, C. J., 2006, Genetic variability and association study for yield and its component traits in upland cotton (Gossypium hirsutum L.). J. Cotton Res. Dev., 20(2): 185-190
Krishna Rao, K. V. and Mary, T. N., 1990, Variability, correlation and path analysis of yield and fibre traits in upland cotton. Madras Agric. J., 72 : 146-151.
Lakwander Singh and Kalsy, H. S., 1979, Genetic variability in desi cotton (Gossypium arboreum).
Cotton Develop., 8 : 7-10.
Laxman, S. and Ganesh, M., 2003, Combining ability for yield components and fibre characters in cotton (Gossypium hirsutum L.). J. Res., Acharya N. G. Ranga Agric. Univ., 31(4): 19-23. Neelima, S., Chenga, R.V. and Narisireddy, A., 2008, Genetic parameters of yield and fibre quality traits in American cotton (Gossypium hirsutum
L.). Indian J. Agric. Res., 42(1): 67-70
Patel, U. G., Patel, J. C., Patel, N. N. and Patel, A. D., 1994, Variability parameters in diploid cotton.
Gujarath Agric. Univ. Res. J., 22 (1) : 9-13. Pavasia, M. J., Shukla, P. T. and Patel, U. G., 1999,
Heterobeltiosis in multiple environments for seed cotton yield and related characters in cotton (Gossypium hirsutum L.). J. Indian Soc. Cotton Improv., 24(1): 14-17.
Sakthi, A.R., Kumar, M. and Ravikesavan R., 2007, Variability and association analysis using morphological and quality traits in cotton (Gossypium hirsutum). J. Cotton Res. Dev.,
21(2): 148-152
Sambamurthy, J. S. V., Reddy, D.M. and Reddy, K.H.G., 1995, Genetic variability, correlation and path analysis in cotton (Gossypium hirsutum
L.). J. Indian Soc. Cotton Improv., 20: 133-137. Sandhu, B. S. and Badesha, M. S., 1997, Genetic
parameters for yield and other traits in (Gossypium arboreum L.). J. Indian Soc. Cotton Improv., 22 (4) : 7-9.
Singh R. K. and Chaudhary B. D., 1977. Biometrical methods in quantitative genetic analysis (Revised Edition.). Kalyani Publishers. New Delhi, India.
Tommer, S. K., Singh, S. P. and Tommer, S. R. S., 1992, Genetic variability of yield and its components over environments in desi cotton (Gossypium arboreum L.). Crop Res., 5 (2): 290-293.
Tuteja, O. P., Mahender, S., Verma, S. K. and Khadi, B. M., 2006, Introgressed lines as source for improvement of upland cotton (Gossypium hirsutum L.) genotypes for yield and fibre quality traits. Indian J. Genet., 66(3): 251-252 Valaramath, M. and Jehangier, K. S., 1998, Studies on
ISSN 0975-928X
Table 1. Barbadense lines involved in evaluation for productivity and fiber quality traits
Method of lines derived Lines Pedigree
Single cross derived lines 1 DBM435 534 M
2 DBSI-75-16,1 SN X ICB 75-16, R I IPS 1 3 DBSI-75-16,2 SN X ICB 75-16, R I IPS 2 4 DBSI75-16,3 SN X ICB 75-16, R II IPS 3 5 DBSI-75-10,1 SN X ICB 75-10,R I IPS 1 6 DBSI 75-10,4 SN X ICB 75-10,R II IPS 4 7 DBSI 179-13,1 SN X ICB 179-13, R I IPS 1 8 DBSI 263-8,4 SN X ICB 263-8, R II IPS 4
9 DBSI 75-16 SN X ICB 75-16
10 DBSI-75-16,1 (I) SN X ICB 75-16 RI IPS 1 11 DBSI 75-16,3 (I) SN X ICB 75-16 RII IPS 3 12 DBSI-75-10,1(I) SN X ICB 75-10 RI IPS1 13 DBSI 75-10,4 (I) SN X ICB 75-10 RII IPS 4 14 DBSI 179-13,1 SN X ICB 179-13 RI IPS 1 15 DBSI 75-16 (I) SN X ICB 75-16
16 DBSI 75-10 * SN X ICB 75-10
17 DBSI-75-16,2(I) SN X ICB 75-16 R I IPS 2 18 DBSI 75-10 (I) SN X ICB 75 -10
19 DBSI263-2 SN X ICB 263 – 2
20 DBSI263-8 SN X ICB 263 – 8
21 YB- IPS 15 533 x 534 F3 IPS 15
22 YB-IPS 14 533 x 534 F3 IPS 14
23 YB-IPS 25 533 x 534 F3 IPS 25
24 DYB- IPS 6 531 x 533 F3 IPS 6
25 DBM435 (I) 534M
26 YB-IPS 18 531 x 533 F3 IPS 18
27 YB- IPS 27 533 x 534 F3 IPS27
28 YB- IPS 36 533 x 534 F3 IPS 36
29 YB-IPS 20 533 x 534 F3 IPS 20
Back cross derived line 30 YB2D-3 (531 x 533) x 531 B2 IPS 3 Three way cross derived lines 31 YBD-12 (531 x 534) x 533 IPS 12
32 YBD-13 (531 x 533) x 534 IPS 13
33 YBD-8 (532 x 533) x 534 IPS 8
34 YBD-10 (531 x 534) x 533 IPS 10
35 YBD-19 (532 x 533) x 534 IPS 19
36 YBD-6 (531 x 534) x 533 IPS 6
37 YBD-23 (531 x 534) 533 IPS 23
38 YBD-24 (531 x 534) x 533 IPS 24
39 YBD-18 (531 x 534) x 533 IPS 18
40 ICB 125(I) IPS line of ICB 125
41 DB12 ARS Dharwad
Already stabilized lines 42 GSB 40 Germplasm line from Gujarat
43 ICB 125 Germplasm line
44 GSB-41 Germplasm line from Gujarat
45 RHCB – 010 Germplasm line from Rahuri
ISSN 0975-928X
Table 2. Analysis of variance for variability study in forty six Barbadense lines with respect to yield and its components
Source of variation
d. f
Mean sum of squares Seed
cotton yield (Kg/ha)
Boll weigh t (g)
No. of bolls per plant
RP on sympodi a
Plant height (cm)
No. of monopodi a
No. of sympodi a
IBD (cm)
GO T (%) Replicatio
n 1 47252.5 0.02 14.09 1.09 37.84 0.01 0.16 0.02 0.25
Genotypes 45 282897* *
0.13* *
44.06*
* 0.41*
225.78*
* 0.38** 9.67**
1.82* *
3.54 *
Error 45 84738.8 0.02 7.60 0.28 39.38 0.10 3.22 0.53 1.94
*, ** significant at 5% and 1% levels, respectively
RP: Reproductive points, IBD: Inter branch distance, GOT: Ginning out turn, SL: Sympodial length
Table 3. The Mean, range, estimates of variance components, heritability (broad sense), genetic advance and genetic advance over mean for all characters
Characters Mean Range PCV GCV
h² (Broad Sense)
GA GAM
Seed cotton yield (kg) 1959.5 1213-2366 17.28 14.46 0.7 542.69 24.93
Boll weight(g) 4.4 3.8-4.6 5.84 5.27 0.81 0.43 9.79
Number of bolls per plant 28.9 19.5-32.5 16.25 14.78 0.83 8 27.7 Reproductive points on
sympodia 4.2 3.0-5.0 10.8 3.14 0.09 0.08 1.88
ISSN 0975-928X
Table 4. Mean performance of forty six Barbadense lines with respect to yield and its component characters
Genotype
Seed cotton yield (Kg/ha)
Boll weight (g)
No. of bolls per plant
RP. on sympod ia
Plant height (cm)
No. of monopo dia
No. of sympod ia
IBD (cm)
GOT (%)
2.5% span length (mm)
UI ( %)
Micrnoi ore (μg inch-1 )
Fiber strength (g/tex)
YBD-10 2662* 4.8* 30.0 4.5 124.4 1.2 18.4 7.7 31.1 30.17 84.5 3.91 38.2
YB-IPS 14 2569* 4.6 38.5* 4.5 127.7 1.0 19.5 7.4 30.0 32.83 86.3 3.95 43.5
YBD-18 2506* 4.7* 32.5 4.0 125.2 2.5* 20.0 6.2 30.5 31.2 87.3 4.1 31.6
YBD-12 2502* 4.7* 33.0* 4.0 106.9 1.5 14.5 7.4 30.5 30.67 84.0 3.9 41.9
YB- IPS 18 2396* 4.7* 36.5* 4.5 119.3 1.5 20.4 8.7* 30.8 30.93 85.8 4.13 36.3
YB-IPS 25 2395* 4.7* 37.5* 4.5 113.4 1.9 20.0 7.2 29.5 31.13 86.1 4.1 42.7
YBD-8 2366 4.6 29.5 4.5 122.0 1.0 19.4 8.4* 26.2 28.9 84.5 3.7 34.3
DBM435 2220 4.6 28.0 4.5 118.0 1.2 18.2 6.7 32.2 32.3 84.7 3.5 34.2
YB-IPS 20 2214 4.3 29.5 4.5 120.4 1.9 20.5 6.7 27.7 35.22 86.2 3.27 35.7
DBSI 75-10 2208 4.8* 34.5* 3.5 132.5* 2.9* 15.0 7.7 31.1 32.8 86.2 3.4 33
YBD-6 2143 4.5 27.5 3.5 118.2 2.0 17.7 6.0 30.8 31.3 83.9 3.47 40.3
YB- IPS 36 2143 4.6 33.5* 4.5 113.2 1.7 17.0 6.0 30.6 30.29 83.0 3.62 42.1
DBSI 75-10,4 2197 4.7* 23.5 4.0 141.2* 1.7 19.9 6.4 30.4 32.08 85.0 3.7 35.2
YBD-13 2185 4.4 33.0* 4.5 109.5 1.7 15.0 9.2 31.6 31.95 87.0 4.18 42.1
DBSI263-2 2138 4.7* 30.0 4.5 125.3 2.0 20.5 8.3* 30.5 29.4 84.6 4.2 30.0
RHCB – 010 2114 4.7* 22.5 4.5 134.2* 2.4* 16.5 6.2 31.1 28.67 82.9 3.46 44.9
YBD-24 2101 4.4 28.5 4.5 120.2 1.0 20.0 6.2 32.1 30.74 84.1 3.47 41.1
ICB 125 2090 4.6 27.5 4.0 126.0 2.0 19.0 7.4 31.0 30.5 85.5 4.3 31.6
DBSI 75-16,3 2086 4.3 29.0 4.5 123.0 1.0 19.0 6.0 31.1 34.85 87.1 3.18 38.3
GSB-40 2082 4.3 28.5 3.5 105.4 2.5* 17.5 9.0* 31.0 30.05 82.8 3.33 33.5
DBSI 263-8,4 2030 4.5 26.0 4.0 135.0* 1.7 21.5 5.7 30.1 28.98 83.9 3.95 39.3
DBSI 75-10,4 (I) 2015 4.6 28.0 3.0 131.2* 1.4 19.5 7.4 30.8 35.55 86.6 3.31 36.8
GSB-41 1977 4.6 30.0 3.0 131.5* 1.7 16.7 5.9 30.5 35.17 87.1 2.89 36.9
ISSN 0975-928X Table 4. Contd..
Genotype
Seed cotton yield (Kg/ha)
Boll weight (g)
No. of bolls per plant
RP. on sympod ia
Plant height (cm)
No. of monopo dia
No. of sympod ia
IBD (cm)
GOT (%)
2.5% span length (mm)
UI ( %)
Micrnoi ore (μg inch-1 )
Fiber strength (g/tex)
YBD-23 1940 4.5 37.5* 4.5 115.0 2.0 19.2 7.4 32.5* 32.7 86.4 4.1 33.4
DBSI-75-16,1 (I) 1931 4.5 22.5 4.5 122.0 1.5 20.5 8.4* 31.0 31.83 84.1 2.93 40.9
YBD-19 1925 4.5 38.5* 3.5 131.9* 2.3* 23.5* 6.7 30.0 33.18 86.2 3.07 42.3
YB2D-3 1858 4.5 26.5 4.0 135.7* 1.3 16.7 6.2 30.8 33.57 85.7 3.18 42.0
DBSI-75-16,2 1842 4.1 24.5 4.5 112.5 1.9 19.2 7.0 32.0 33.4 86.3 2.9 33.7
DBSI75-16,3(I) 1789 4.1 23.0 4.5 120.7 1.7 20.5 6.8 28.5 34.85 87.1 3.18 38.3
DBM435(I) 1762 4.1 28.5 4.0 110.3 1.7 18.5 6.2 30.5 28.97 83.8 3.13 40.1
DBSI-75-10,1 1731 4.3 24.0 4.5 113.5 2.2 18.0 6.9 32.7* 32.47 86.6 3.57 43.0
DBSI 179-13,1 1702 4.4 25.0 4.0 119.2 1.2 18.4 8.9* 30.8 32.2 84.9 3.5 33.6
DBSI 75-10 (I) 1777 4.4 26.0 3.5 113.0 1.7 17.0 6.5 31.5 32.8 86.2 3.4 33.0
DBSI-75-16,2 (I) 1774 4.4 29.0 5.0 120.0 1.5 20.2 7.2 27.7 33.4 86.3 2.9 33.7
DBSI 75-16 (I) 1773 4.4 31.5 4.5 132.4* 1.7 18.0 7.9 31.5 32.2 85.5 3.1 32.6
DYB- IPS 6 1767 4.3 27.0 4.0 126.5 0.9 20.5 7.5 31.0 32.25 85.6 3.0 40.6
DBSI263-8 1661 4.5 19.5 4.5 110.5 1.9 15.5 6.4 30.5 31.4 86.8 3.8 33.2
YB- IPS 27 1575 4.4 28.5 4.5 127.0 2.0 22.0 8.0 28.7 35.64 86.7 3.2 40.1
DBSI-75-10,1(I) 1568 4.1 30.5 4.0 108.0 2.0 18.5 7.8 29.6 32.47 86.6 3.57 43.0
ICB- 125 (I) 1544 4.0 35.0 4.0 150.9 2.0 23.5 5.7 28.0 30.5 85.5 4.3 31.6
YB- IPS 15 1486 3.9 32.5 5.0 128.2 1.7 23.0 7.5 30.5 35.22 87.2 2.65 34.9
DBSI 75-16 1485 4.0 22.5 4.5 108.4 2.2 16.4 6.3 30.1 32.2 85.5 3.1 32.6
DBSI 179-13,1(I) 1425 4.0 26.0 4.0 144.5 1.7 20.2 8.5 32.7 32.2 84.9 3.5 33.6
DBSI-75-16,1 1325 4.0 22.5 4.5 112.2 1.7 17.5 6.2 29.5 31.83 84.1 2.93 40.9
SUVIN 1218 3.8 24.5 4.0 113.7 1.9 19.0 7.7 31.3 32.9 84.2 3.7 38.3
Mean 1959.5 4.4 28.9 4.2 121.9 1.7 18.8 7.1 30.5 32.03 85.42 3.51 37.29
C.V. 13.37 3.6 9.5 14.6 5.1 18.0 9.5 10.3 4.6 - - - -
S.E. 205.84 0.1 1.9 0.4 4.4 0.2 1.3 0.5 1.0 - - - -
C.D. 5% 586.30 0.3 5.6 0.71 12.6 0.6 3.6 1.5 2.8 - - - -
*, ** significant at 5% and 1% levels, respectively
ISSN 0975-928X
Table 5. Classification of potential Barbadense lines based on their productivity and fiber quality parameters
Fiber quality based on strength to length ratio
High Medium Low
P
ro
du
ct
iv
it
y
Hig
h
(>
2
0
q
/h
a) YB-IPS 14, YBD-12, DBSI 75-10, YBD-6, YB-
IPS 36, DBSI 75-10,4, YBD-24, YB-IPS 25, YBD-13, DBSI 75-10,4 (I), RHCB – 010, DBM435
DBSI75-16,3, YB-IPS 20, YBD-10, DBSI 75-16,3
YB- IPS 18, DBSI263-2, ICB 125, GSB-40, DBSI 263-8,4, YBD-8, YBD-18
Mo
d
er
ate
(1
8
to
2
0
q
/h
a)
DBSI-75-16,2 YBD-23, DB12, YBD-19, YB2D-3 GSB-41, DBSI 75-16 (I)
lo
w
(<1
8
q
/h
a) DBSI75-16,3(I), DBSI-75-10,1, DYB- IPS 6, DBM435(I), YB- IPS 27, DBSI-75-10,1(I),
DBSI-75-16,1, DBSI 75-16 (I)
DBSI 263-8, DBSI 179-13,1, DBSI 75-16, DBSI 75-10 (I), DBSI-75-16,2 (I), YB- IPS 15