Viscoelastic properties of tablets from Osborne fractions, pentosans, flour
and bread evaluated by creep tests
Anayansi Escalante-Aburto1*, Juan de Dios Figueroa-Cárdenas2, José Juan Véles-Medina2,
Néstor Ponce-García3,4, Zorba Josué Hernández-Estrada5, Patricia Rayas-Duarte5, and Senay Simsek6
1Department of Nutrition, University of Monterrey, Ignacio Morones Prieto Avenue 4500 west, San Pedro Garza García, Nuevo León, 66238, México
2Center of Research and Advanced Studies – Querétaro (CINVESTAV-IPN), Libramiento Norponiente 2000, Fracc. Real de Juriquilla, Querétaro, Querétaro, 76230, México
3Center of Biotechnology FEMSA, School of Engineering and Sciences, Tecnológico de Monterrey, Eugenio Garza Sada Avenue 2501 South, 64849, Monterrey, Nuevo León, México
4UAEMex Campus Universitario ‘El Cerrillo’, Faculty of Agricultural Sciences, Piedras Blancas s/n, Toluca, Estado de México, 50200, México
5Robert M. Kerr Food and Agricultural Products Center, Oklahoma State University, 123 FAPC, Stillwater, OK 74078-6055, USA 6Department of Biochemistry and Molecular Biology, North Dakota State University, Harris Hall 224, Dept 7670, PO Box 6050,
Fargo, ND 58108-6050, USA
Received October 8, 2016; accepted June 19, 2017 doi: 10.1515/intag-2016-0062
*Corresponding author e-mail: anayansi.escalante@udem.edu A b s t r a c t. Little attention has been given to the influence of non-gluten components on the viscoelastic properties of wheat flour dough, bread making process and their products. The aim of this study was to evaluate by creep tests the viscoelastic pro- perties of tablets manufactured from Osborne solubility fractions (globulins, gliadins, glutenins, albumins and residue), pentosans,
flour and bread. Hard and soft wheat cultivars were used to pre
-pare the reconstituted tablets. Sintered tablets (except flour and bread) showed similar values to those obtained from the sum of the regression coefficients of the fractions. Gliadins and albumins accounted for about 54% of the total elasticity. Gliadins contri- buted with almost half of the total viscosity (45.7%), and showed
the highest value for the viscosity coefficient of the viscous ele
-ment. When the effect of dilution was evaluated, the residue showed the highest instantaneous elastic modulus (788.2 MPa).
Retardation times of the first element (λ1 ̴ 3.5 s) were about 10
times lower than the second element (λ2 ̴ 39.3 s). The analysis of
compliance of data corrected by protein content in flour showed that the residue fraction presented the highest values. An impor-tant contribution of non-gluten components (starch, albumins and globulins) on the viscoelastic performance of sintered tablets from Osborne fractions, flour and bread was found.
K e y w o r d s: viscoelasticity, creep test, Osborne fractions, fluor, bread
INTRODUCTION
Different investigations have reported that the unique viscoelastic properties of wheat grains reside primarily in the gluten forming storage proteins of its endosperm (Gianibelli et al., 2001; Greenwood and Ewart, 1975; Lindsay and Skerritt, 1999). Many parameters such as the quality of flour protein, the amount of gluten, proportion of gluten proteins, and the type of subunits present in the flour are evaluated to predict the quality of dough and bakery products (Saxena et al., 1997). However, little attention has been given to the evaluation and influence of non-gluten components, such as pentosans and starch, on the viscoe-lastic properties of dough, the bread making process and their products.
D’Appolonia and Gilles (1971) mentioned that pen-tosans are closely associated with proteins, especially with the gluten fraction of wheat flour, hence these components could be related with the viscoelastic properties during the bread making process. For indirect measurement of wheat properties associated with gluten and non-gluten compo-nents, Hernández-Estrada et al. (2012) proposed the creep
test and the use of the generalised Kelvin-Voight model methodology that allowed the separation of rheological pa- rameters like elastic, viscoelastic and viscous flow charac- teristics. The plastic work of wheat kernels may be related to water, lipids, pentosans and other carbohydrates that are important for dough extensibility (Figueroa et al., 2009). Non-gluten components of dough, like albumins, globu- lins, starch and pentosans, showed lower elastic moduli than dough (Hernández-Estrada et al., 2014, 2017). In general, viscoelastic behaviour of wheat kernels and their doughs are most likely explained by the interactions of all of their glu-ten and non-gluglu-ten components that form unique systems (Ponce-García et al., 2016). Thus, the study of viscoelastic properties of other wheat components besides gluten alone justifies their evaluation using different methods that would complement the body of knowledge in this field.
Figueroa et al. (2016) indicated that starch granules, water soluble pentosans and non-gluten components may not be considered as inert filler, since it has been clearly shown that those components are also responsible for the viscoelastic behaviour of sintered tablets made from wheat products such as flour, dough and bread.
The aim of this study was to evaluate the viscoelastic properties of sintered tablets of proteins obtained from Osborne solubility fractions (globulins, gliadins, glutenins, albumins and residue), pentosans, flour and bread from two wheat classes, evaluated by creep tests.
MATERIALS AND METHODS
Samples of four cultivars of hard red spring wheat (HRS): Len, Butte, Era and Coteau, and of two cultivars of soft red wheat (SRW): Adder and Fairfield, were tested in this study.
The grain samples were tempered at room temperatu-re on the lab bench in plastic bottles. After measuring the moisture of the wheat with NIR using a FOSS Infratec 1 241 grain analyser (FOSS, Eden Prairie, MN), additional water was added to bring the moisture to 12%. The samples were shaken every hour for 3 h and then rested at room tempe-rature for approximately 16 h prior to milling. Tempered wheat samples were milled using a Brabender Quadrumat Jr. (C.W. Brabender, South Hackensack, NJ) laboratory mill. Straight grade flour was blended and screened through an 84 SS sieve to remove foreign material. The bread was prepared using a 2 h fermentation schedule to avoid over-fermentation (AACCI, 2011). Bread loaves were sliced to 10 mm thick and placed in a single layer on wire drying racks. The bread was dried in two stages – 1) overnight on the laboratory bench at approximately 25 °C and 35-40% relative humidity, followed by grinding in a food chop-per, and 2) freeze dried (Labconco Freezone 4.5, serial 061162977S, Kansas, Missouri) during 72 h at -53°C and 0.050 mBar, to reduce the moisture content to about 1 %.
Solvent solubility extraction was conducted accord-ing to the modified Osborne fractionation procedure of Chen and Bushuk (1970) in the wheat flour. Samples of flour with NaCl (0.5 M) were stirred and centrifuged, the supernatant (albumins and globulins) was dialysed with water to precipitate the globulin fraction. The pellet left in the tube (sediment) was mixed with 70% aqueous ethanol, stirred and centrifuged; the gliadin fraction was obtained in the supernatant by dialysis to remove ethanol. The pel-let left on the tube was stirred with acetic acid (0.05 M) and centrifuged, the supernatant contained the acid soluble glutenin fraction. The pellet contained the residue, mostly starch containing acid insoluble glutenin. All the Osborne protein fractionation was carried out at 4°C, and all the centrifugations were at 5 000 x g for 30 min.
Fractions were freeze dried (Labconco Freezone 4.5, serial 061162977S, Kansas, Missouri) during 72 h, at -53°C and 0.050 mBar, and stored in tightly closed containers at 5°C until needed for analysis (approximately two weeks). Water soluble pentosans (WSP) were calculated by dif- ference using the recovery of the fractions (Figueroa et al., 2016).
Tablets of 4.2 mm height and 8.07 mm diameter (con-tact area of 51.52 mm2) were sintered from Osborne protein fractions, flour and bread. For each tablet, 300 mg of sam-ple was weighed into a 10 ml beaker sealed with parafilm and placed in a controlled temperature chamber at 20°C for 2 h. The tablet-forming die of hardened steel had an inside diameter of 7.95 mm, and a length of 31.69 mm. Two hardened steel dowels were used to apply the pres-sure necessary to form the tablets. The lower dowel (5.54 mm long) was inserted into a loose-fitting cylinder, 31.69 mm high, and the die was placed on top of this cylinder with the dowel of 43.23 mm long positioned into the die. The sample was transferred into the die, the upper dowel placed into the lower die and the set positioned onto a table with a hydraulic press (Trupper 501, 50 t capacity). The load on the die was gradually increased to reach 25 t and maintained for 5 min before removing the tablet from the die. Reconstituted tablets were also prepared, containing the same percentage (w/w) of the fractions obtained. Six tablets were obtained for each fraction.
In creep experiments, the material is subjected to dead loads under constant strain and the deformation as a func-tion of time is observed (Mohsenin, 1986). Once the tablets were obtained and before the test began, the height and diameter were measured using a caliper (Model CD-6 CS, Mitutoyo Corp., Japan) in order to calculate the applied strain and the contact area of each tablet.
Corp. TA-XT2) with a 10 mm diameter stainless steel probe (TA-510) was used to measure the tablets deformation. The tablets were loaded in compression until reaching 70 N with a constant loading rate of 0.1 mm s-1. Load (N) and displacement (mm) data were acquired at 10 points/s, the stress was held constant for 300 s, and the displacement data was used to calculate strain dividing the deformation by the initial height of the tablets. The test was performed once on each tablet to obtain four curves and data were extracted for calculations.
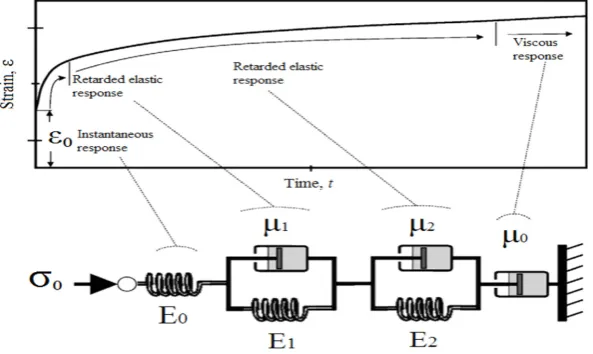
Mechanical models consisting of springs and dashpots are used to explain and interpret the rheological behaviour of linear viscoelastic materials. The spring obeys the Hooke law and the dashpot the Newton law. In the Kelvin-Voigt model, the elements are forced to move together at constant rate (Mohsenin, 1986), a three elements model that follows the Eq. (1):
(1)
where: ε(t) is the strain (%) as a function of time t (s), σ0
is the applied stress, E0 (MPa) is the elastic modulus of the Hookean body; the retardation time (λ1=µ1/E1) that in the case of creep is (1-1/e) or about 63% of the time for total strain; E1 is the elastic modulus and µ1 (MPa s-1) is the vis-cous coefficient of the dashpot in the Kelvin-Voigt element. A four-element Burger model resulted of a combination of the Maxwell and Kelvin-Voigt models and is expressed in Eq. (2):
(2)
The first term of Eq. (2) represents the instantaneous elastic deformation of the sample, the second term is relat-ed to the combinrelat-ed effect of viscoelasticity, and the third term expresses the viscous effect and the viscosity coef-ficient (µ0, MPa s-1).
(
1 -),
=
)
( -/1
1 0 0
0 σ λ
σ
ε et
E E
t +
(
e)
t.E E
t t
0 0 /
-1 0
0
0 1 - 1
= ) (
µ σ σ
σ
ε + λ +
According to Mohsenin (1986), to obtain a 6-element model, another Kelvin-Voigt unit must be added to the Burger model (Fig. 1).
To obtain the results in terms of uniaxial creep compli-ance, the equation suggested by Hernández-Estrada et al. (2012) was applied (Eq. (3):
(3)
where: ε – strain (%), t – time (s), σ – stress (MPa), λ – retardation time (s), and D – compliance (1/Pa), D0 –
instantaneous compliance or compliance at zero time (1/ Pa), D1, D2 – compliance of 1st and 2nd retarded elastic
element (1/Pa).
Analysis of variance (ANOVA) was performed using the General Linear Model procedure of SAS Statistical Software, version 9.3. Multiple comparison of the means was performed using the Duncan Multiple Range test at α = 0.05 level. Nonlinear regression analyses were performed with OriginPro 9 (OriginLab Corporation, Northampton, MA, USA).
RESULTS AND DISCUSSION
The evaluated protein fractions reached a quasi-steady state at 100 s after the application of constant stress. Usually, creep test performed on intact wheat kernels required more time (up to 200-1200 s) to reach the quasi equilibrium. The coefficients obtained by the creep curves fitted with the gen-eralised Kelvin-Voigt model with six elements showed that gliadins and albumins represent about 54% of the total elas-ticity, however, gliadins showed the highest elastic modulus (E0) among all the evaluated fractions (Table 1). Glutenins contributed with 17% of the total elasticity (E %) show-ing an E0 of 1391.2 MPa, significantly higher than those reported by Hernández-Estrada et al. (2012). Those authors found an average value of 242 MPa for the elastic moduli of HMW-GS and LMW-GS from thirty-four wheat lines,
( ) ( )
t t D D(
e) (
D e)
t ,D t/ t/
0 2
1 0 0
2
1 1
1 µ
σ
ε = + − λ + − λ +
= − −
T a b l e 1. V iscoelastic properties of Osborne solubility fractions, water soluble pentosans, flour and bread sintered tablets produced from hard red spring and soft red winter wheat cultivars Sample
Modulus of elasticity and retardation time
Coefficient of viscosity
Compliance E (%) E0 E1 λ1 (s) E2 (MPa) λ2 (s) µ (%) µ0 µ1 µ2 D0 D1 D2 (MPa) (MPa s -1 ) (1/MPa) Albumins 23.60 1 41 1.2b 1.39x10 5 ab 3.47a 9.87x10 4 b 42.00a 21.12 1.04x10 9 b 4.92x10 5 ab 4.22x10 6 ba 7.19x10 -4 cb 7.43x10 -6 dc 1.05x10 -5 c Globulins 8.85 1 235.6c 5.1 1x10 4 d 4.14a 3.74x10 4 d 39.04a 6.1 1 3.01x10 8 c 2.03x10 5 c 1.44x10 6 c 8.09x10 -4 b 1.97x10 -5 a 2.67x10 -5 a Gliadins 31.05 1 572.6a 1.78x10 5 a 3.34a 1.35x10 5 a 39.43a 45.73 2.25x10 9 a 5.19x10 5 a 4.77x10 6 a 6.39x10 -4 c 6.21x10 -6 d 7.71x10 -6 c Glutenins 17.03 1 391.2cb 1.02x10 5 bc 3.74a 6.92x10 4 c 40.74a 15.52 7.62x10 8 cb 3.08x10 5 bc 2.73x10⁶bc 7.39x10 -4 cb 1.20x10 -5 bc 1.63x10 -5 b Residue b 9.85 937.4d 5.49x10 4 d 3.69a 4.40x10 4 d 39.95a 5.96 2.92x10 8 c 2.24x10⁵c 1.81x10 6 c 1.08x10 -3 a 2.01x10 -5 a 2.48x10 -5 a Pentosansc 9.59 1 256.3cb 6.14x10 4 dc 3.09a 3.45x10 4 d 34.53a 5.56 2.75x10 8 c 2.31x10 5 c 1.44x10 6 c 8.04x10 -4 b 1.65x10 -5 ba 2.91x10 -5 a Average 1 300.7 5.86x10 5 3.57 6.98x10 4 39.28 8.20x10 8 3.29x10 5 2.73x10 6 7.98x10 -4 1.36x10 -5 1.91x10 -5
All fractions
d 1 294.7 7.24x10 4 5.34 5.50x10 4 69.70 3.82x10 9 4.01x10 5 3.84x10 6 7.85x10 -4 1.45x10 -5 1.92x10 -5 Starch 18.64 1 160.95 1.19x10 5 4.29 6.87x10 4 43.72 12.97 6.37x10 8 5.15x10 5 3.00x10 6 8.65x10 -4 8.57x10 -6 1.46x10 -5 Non-gluten 51.89 38.75 a – Means (n= 6) followed by the same letter in the same column are not significant dif ferent at p < 0.05; b – residue is mainly composed by starch 68%, protein 4.4% and water insoluble pentosans about 3% (Jelaca
and Hlynka, 1971); c – water
soluble
pentosans; d – sintered
tablets include the percentage in weight of all fractions including water soluble pentosans; d – E
is expressed as a percent of each fraction, where
E = E0 + E1 + E2
; e –
µ
is expressed as a
percent of each fraction, where
this value being lower than that found in this study. Perhaps there was an additive effect of the modulus from the diffe- rent glutenin subunits that was expressed in the complete fraction. However, when starch was evaluated separately, higher values were showed for the instantaneous elastic moduli, similar to those obtained by albumins and gliadins. Staniforth and Patel (1989) evaluated the creep compliance behaviour of direct compression excipients from different materials, suggesting that starch undergoes a high degree of elastic deformation at different stress levels.
The retarded modulus of elasticity of the second element (E2) showed lower values in almost all fractions when com-pared with E1 (Table 1). Gliadins showed the highest values for both moduli (E1 and E2). Retardation times λ1 (~3.5 s) were lower thanλ2 (~ 39.3 s), but no significant differen- ces were detected among the fractions. Shorter retarda-tion times were detected in all Osborne fracretarda-tions and water soluble pentosans, when compared with those reported by Figueroa et al. (2011) and Hernandez-Estrada et al. (2012) on intact wheat kernels and glutenin subunits, respectively. The latter means that differences between materials can be measured using this methodology, applying rheologi-cal models that detect differences among samples. Thus, wheat proteins behave in a different way depending of their molecular structure, which could be related with the quality parameters of their products.
Dobraszczyk and Morgenstern (2003), using the results obtained by Bloksma and Bushuk (1988), described the experimental measurements for stress relaxation tests in different doughs. The curves did not show the exponen-tial decay typical for a single relaxation time, indicating a wide range of relaxation times. Their results indicated that molecular mechanisms are involved for the relaxation pro-cess and deformation propro-cesses within dough, which can be related to the wide molecular weight distribution of gluten. In this study, gliadins contributed with almost half of the total viscosity (45.7%), and showed the highest value for the viscosity coefficient of the viscous element (µ0, dashpot). With respect to the first and second retarded elas-tic deformation elements (µ1 and µ2), albumins and gliadins showed the highest values (Table 1). The viscosity coef-ficients displayed wide variation, there were reductions by factors of 1000 for µ1, and 100 for µ2. Gliadins showed the highest values for µ0, µ1, and µ2, which describes the plasti-ciser effect of gliadins and its function as a viscous material promoting the extensibility of gluten (Belton, 1999). Plastic components seem to be more related to non-gluten factors (Maucher et al., 2009). Ponce-García et al. (2016) noted that some low molecular weight glutenin subunits (LMW-GS), gliadins, lipids, pentosans and other carbohydrates act as plasticisers for dough extensibility. It was remark-able that the albumin fraction also showed higher viscosity coefficients (µ1, µ2), significantly contributing to the
vis-cosity of the system. Glutenins showed 1/3 of the visvis-cosity when compared with gliadins, in fact, the glutenin fraction showed similar values for E % and µ %.
The residue showed the highest instantaneous compli-ance (D0). When D1 and D2 (compliance of the first and second retarded elastic elements) were evaluated, globu-lins, residue and water soluble pentosans presented the highest values (Table 1). According to Hernández et al. (2012), compliances obtained from creep test in kernels are correlated to some quality parameters such as SDS, SDS index, mixing time, alveograph deformation energy of dough, tenacity-extensibility ratio and tenacity.
The estimated parameters of the Kelvin-Voigt model for creep test coefficients from the Osborne solubility frac-tions and water soluble pentosans were corrected by weight (Table 2). The correction was made in order to compare the parameters and to observe the dilution factor effect that could exist among the fractions. When the extraction was performed, the residue showed the highest weight, as expected (86.1%), of all the fractions, followed by albu-mins and gliadins. It can be seen that the sum of gliadins and glutenins accounted for only 6.9% from the total flour weight.
In sintered tablets, gliadins, albumins and glutenins showed the highest instantaneous elastic moduli (Table 1). Nevertheless, when the effect of dilution was evaluated (Table 2), the residue showed the highest instantaneous elastic modulus E0 (788.2 MPa), with similar values in Tables 1 and 2, perhaps by the largest proportion obtained on the Osborne fractionation. In addition, the residue frac-tion presented the highest values of elastic moduli (E1 and
T a b l e 2. V iscoelastic properties of sintered tablets from Osborne solubility fracti ons and water soluble pentosans corrected by weight, flour and bread sintered tablets produced from
hard red spring and soft red w
inter wheat cultivars
Sample
Modulus of elasticity and retardation time
Coefficient of viscosity
Compliance W eight (%) E (%) E0 E1 E2 µ (%) µ0 µ1 µ2 D0 D1 D2 (MPa) (MPa s -1 ) (1/MPa) Albumins 3.82b 7.97c 53.56b 5.37x10 3 b 3.82x10 3 b 9.32c 1.73x10 4 b 1.36x10 5 b 3.90x10 7 b 2.70x10 -5 b 2.80x10 -7 b 3.90x10 -7 b Globulins 0.79d 0.56e 9.74b 3.63x10 2b 2.84x10 2b 0.67e 2.46x10 3b 1.67x10 4b 2.82x10 6b 6.56x10 -6b 1.80x10 -7b 2.20x10 -7b Gliadins 5.22b 14.12b 79.50b 9.32x10 3 b 6.99x10 3 b 26.49b 2.50x10 4 b 2.28x10 5 b 1.1 1x10 8 b 3.18x10 -5 b 2.90x10 -7 b 3.80x10 -7 b Glutenins 1.67dc 2.69d 23.01b 1.87x10 3 b 1.23x10 3 b 3.15d 5.18x10 3 b 4.71x10 4 b 1.32x10 7 b 1.20x10 -5 b 1.90x10 -7 b 2.50x10 -7 b Residue b 86.1 1a 72.47a 788.17a 4.71x10 4 a 3.62x10 4 a 58.50a 1.75x10 5 a 1.44x10 6 a 2.44x10 8 a 8.38x10 -4 a 1.50x10 -5 a 1.90x10 -5 a W ater
soluble pentosansc
2.39c 2.19d 33.04b 1.60x10 3 b 9.1 1x10 2 b 1.83e 6.25x10 3 b 3.93x10 4 b 7.67x10 6 b 2.16x10 -5 b 4.50x10 -7 b 7.90x10 -7 b Σ 100 987.02 6.56x10 4 4.94x10 4 100 2.31x10 5 1.90x10 6 4.1710 8 9.36x10 -4 1.63x10 -5 2.10x10 -5 Starch 67.5 1160.95a 1.19x10 5 a 6.87x10 4 a 6.37x10 8 a 5.15x10 5 a 3.00x10 6 a 8.65x10 -4 c 8.57x10 -6 b 1.46x10 -5 c Flour tablet -628.02b 2.35x10 4 b 2.09x10 4 b 1.32x10 8 b 1.04x10 5 b 8.69x10 5 b 1.57x10 -3 b 4.35x10 -5 a 4.81x10 -5 b Bread tablet -454.22b 2.25x10 4b 1.42x10 4c 6.35x10 7c 1.31x10 5b 5.43x10 5b 2.21x10 -3a 4.53x10 -5a 7.23x10 -5a Non-gluten 83.19 70.32 a – Means (n= 6) followed by the same letter in the same column are not significant dif ferent at p < 0.05; b – residue is mainly composed by starch 68%, protein 4.4% and water insolu
-ble pentosans about 3%, c – water solu-ble pentosans calculated
by dif
ference from recovery
, d –
E
is expressed as a percent
of weight on each
fraction, where E = E0 + E1 + E2
; e –
µ
is
expressed as of weight on each fraction, where
When compliances were analysed, the same trend was present, where the residue fraction showed the highest values among the other protein fractions, with magnitude of 1.0 x 10⁻² MPa (Table 2). Haddad et al. (2001) demon-strated that endosperm of different wheat classes showed mechanical properties that could be explained by rheologi-cal models. They tested wheat endosperm in parallelepiped shaped form and described a viscoelastic behaviour with a threshold similar to that observed in other materials such as metals and polymers.
The latter proved that the all the wheat components interact among one another to give its unique viscoelastic characteristics. Since the residue was composed mainly of starch, in our study we isolated the rheological beha- viour from the almost pure fraction, showing the impor-tant contribution of this and other non-gluten components to dough performance and to the quality characteristics of the products.
The estimated parameters of the Kelvin-Voigt model for creep test coefficients, from the Osborne solubility fractions and water soluble pentosans, were corrected by protein content in flour (Table 3). To our knowledge, there were no previous data to compare the viscoelastic param-eters obtained in this study with. Nevertheless, it can be seen that the highest protein content is found in the glia-dins fraction, followed by glutenins and albumins fraction, respectively. When the data were examined after the cor-rection by protein in flour, it was observed that the highest elasticity value was provided by the gliadins fraction.
The instantaneous response (E0) and the retarded elastic response elements (E1 and E2) of gliadins were the highest (57.4%), and were statistically different when compared with the other fractions (Table 3). The same trend was observed for the viscosity coefficients, since that fraction contributed with 72.2% of the total viscosity, almost 10 times the viscosity of the glutenins fraction. Li et al. (2006) studied the polymer conformation of structure of wheat proteins and noted that the presence of β-sheet structure and content in gliadins and glutenins are quite different, the glutenins being those of lower content. Those authors proposed that gliadin and soluble glutenin molecules mainly form β-turn structures, and insoluble glutenins in gel proteins form a β-sheet structure, which seem to be an important contributor to the formation of a network struc-ture and, subsequently, affected the elastic and long-time relaxation properties of gluten proteins.
It was evident, when Table 1 and Table 3 were com-pared, that protein content in each fraction influences significantly the viscoelastic parameters, since the ratio of glutenins and gliadins is 1:4. These results were accord-ing to our previous study (Figueroa et al., 2016), where gliadins fraction showed the highest elastic and viscosity coefficients obtained by relaxation tests. Glutenins fraction represented only 8.7 and 6.5% of elasticity (E %) and vis-cosity (µ %), respectively.
The residue and albumin fractions provided similar values of elasticity (E %), however, the residue fraction presented higher instantaneous elastic response of the E0 element. Statistical differences were shown among the fractions, which evidenced the specific rheological charac-teristics of each group of molecules (Table 3).
The sum of the elastic moduli for flour (E0+E1+E2) was 4.50x10⁴ MPa, however, the sums of the elastic moduli of the total proteins fraction (fractions) and starch in flour amounted to 5.49x10⁴ and 1.88x10⁵ MPa, respectively. Thus, starch showed a higher elastic modulus (E0) than flour and bread, respectively. Our previous study noted that total proteins contributed with only 2.03 MPa and that the higher contribution to the elastic performance was pro-vided by starch, which agrees with the results presented in this study. The contribution of water soluble pentosans was relatively low, as expected, since their protein content is minimum; those compounds showed values of E % = 0.93 and µ % = 0.49 from the total elasticity and visco- sity, respectively (Table 3). However, even when those components show lower viscosity performance, their func-tionality and interaction with gluten proteins increase, as demonstrated by Santos et al. (2005). They noted that dur-ing gluten formation, the water soluble pentosans (WSP) caused a reinforcement of the network, forming structural rearrangements with other components of flour, which have effects on gluten functionality (probably by the differences on the polysaccharide size), increasing the elastic moduli and viscosity coefficients.
When compliances of Osborne extraction were ana-lysed, the residue fraction showed the highest values for D0, D1 and D2, followed by gliadins and glutenins fractions.
However, flour and bread presented the highest complianc-es when compared with the fractions and WSP.
CONCLUSIONS
1. An important contribution of non-gluten components, such as starch, albumins and globulins to the viscoelastic performance of sintered tablets from Osborne fractions, flour and bread was found.
2. Reconstituted tablets (albumins, globulins, gliadins, glutenins, residue and water soluble pentosans) showed similar values to those obtained from the sum of the regres-sion coefficients of the fractions.
3. Starch fraction showed remarkable viscoelastic behaviour, and as a major component of flour contributed greatly to its functionality.
4. Gliadins, albumins and glutenins showed the highest contribution to the elasticity, viscosity and compliance of sintered tablets.
T a b l e 3. V iscoelastic properties of sintered tablets made from Osborne solubility fractions corrected by protein content in flour of the respective fractio ns of
hard red spring and soft
red winter wheat cultivars, flour and bread
a
Sample
Modulus of elasticity and retardation time
Coefficient of viscosity
Compliance Protein (%) E (%) E0 E1 E2 µ (%) µ0 µ1 µ2 D0 D1 D2 fraction flour (MPa) (MPa s -1 ) (1/MPa) Albumins 42.7d 1.61c 16.71b 213.17c 2.15x10 4 b 1.52x10 4 b 12.1 1b 7.23x10 4 b 5.61x10 5 b 1.53x10 8 b 1.08x10 -4 c 1.09x10 -6 cb 1.54 x1 0 -6 cb Globulins 57.8c 0.46d 1.36d 44.96d 1.67x10 3 c 1.31x10 3 c 1.03d 1.13x10⁴b 7.75x10 4 b 1.30x10 7 b 3.02x10 -5 d 8.1 1x10 -7 c 1.03x10 -6 c Gliadins 88.4a 4.62a 57.38a 620.53a 7.19x10 4 a 5.42x10 4 a 72.24a 1.97x10 5 a 1.79x10 6 a 9.14x10 8 a 2.48x10 -4 b 2.28x10 -6 b 2.94x10 -6 b Glutenins 75.7b 1.27c 8.73c 144.50c 1.15x10 4cb 7.64x10 3cb 6.52c 3.22x10 4b 2.94x10 5b 8.24x10 7b 7.58x10 -5c 1.20x10 -6cb 1.59 x1 0 -6cb Residue b 4.6f 4.00b 14.85b 308.47b 1.84x10⁴b 1.41x10 4 b 7.58c 6.81x10 4 b 5.64x10 5 b 9.56x10 7 b 3.27x10 -4 a 5.91x10 -6 a 7.46x10 -6 a W ater
soluble pentosansc
ACKNOWLEDGEMENTS
Escalante-Aburto wishes to acknowledge the financial support received from CONACyT for her Posdoc studies at CINVESTAV with the group of Bio-organic Materials, and to Mr. Agustin Galindo from CINVESTAV for his technical assistance. Ponce-García thanks CONACyT for his post-doctoral scholarship.
Conflict of interest: The Authors declare they have no conflict of interest.
REFERENCES
AACC International, 2011. Method 10-09.01. Basic straight-dough bread-baking method-long fermentation. AACC International, St. Paul, Minnesota, USA.
Belton P.S., 1999. On the elasticity of wheat gluten. J. Cereal
Science, 29, 103-107.
Bloksma A.H. and Bushuk, W., 1988. Rheology and chemistry of dough. In: Wheat Chemistry and Technology II (Ed Y. Pomeranz). AACCI, St. Paul, Minnesota, USA.
Chen C.H. and Bushuk W., 1970. Nature of proteins in triticale and its parental species I. Solubility characteristics and amino acid composition of endosperm proteins. Canadian J. Plant Sci., 50, 9-14.
D’Appolonia B.L. and Gilles K.A., 1971. Pentosans associated with gluten. Cereal Chemistry, 48, 428-436.
Delwiche S.R., 1998. Protein content of single kernels of wheat by Near-Infrared Reflectance Spectroscopy. J. Cereal Sci., 27, 241-251.
Dobraszczyk B.J. and Morgenstern M.P., 2003. Rheology and the breadmaking process. J. Cereal Sci., 38, 229-245.
Figueroa J.D.C, Escalante-Aburto A., Véles-Medina J.J., Hernández-Estrada Z.J., Rayas-Duarte P., Simsek S., and Ponce-García N., 2016. Viscoelastic properties of tab-lets from Osborne solubility fraction, pentosans and flour and bread using relaxation tests. J. Cereal Science, 69, 207-212.
Figueroa J.D.C., Hernández Z.J.E., Véles M.J.J., Rayas-Duarte P., Martínez-Flores H.E., and Ponce-García N., 2011.
Evaluation of degree of elasticity and other mechanical properties of wheat kernels. Cereal Chemistry, 88, 12-18.
Figueroa J.D.C., Maucher T., Reule W., and Peña, R.J., 2009.
Influence of high molecular weight glutenins on viscoelas
-tic properties of intact wheat kernel and relation to functional properties of wheat dough. Cereal Chemistry, 86, 139-144.
Gianibelli M.C., Larroque O.R., McRitchie F., and Wrigley C.W.,
2001. Biochemical, genetic, and molecular characterization
of wheat glutenin and its components subunits. Cereal Chemistry, 78, 635-646.
Greenwood G.T. and Ewart J.A.D., 1975. Hypothesis for the structure of glutenin in relation to rheological properties of gluten and dough. Cereal Chemistry, Supplement 3, 146r-153r.
Haddad Y., Benet J.C., Delenne J.Y., Mermet A., and Abeccassis J., 2001. Rheological behavior of wheat
endosperm – Proposal for classification based on the rheo
-logical characteristics of endosperm test samples. J. Cereal Sci., 34, 105-131.
Hernández-Estrada Z.J., Figueroa J.D.C., Rayas-Duarte P., and Morales-Sánchez E., 2014. Creep recovery tests to measure the effects of wheat glutenins on doughs and the relationships to rheological and breadmaking properties. J. Food Eng., 143, 62-68.
Hernández-Estrada Z.J., Figueroa J.D.C., Rayas-Duarte P., and Peña R.J., 2012. Viscoelastic characterization of glu-tenins in wheat kernels measured by creep test. J. Food Engineering, 113, 19-26.
Hernández-Estrada, Z.J. Rayas-Duarte, P. Figueroa, J.D.C., 2017. Creep recovery of wet gluten and high-molecular-weight glutenin subunits composition: Relationship with viscoelasticity of dough and breadmaking quality of hard red winter wheat. Cereal Chemistry, 94, 223-229.
Jelaca J.L. and Hlynka, I., 1971. Water binding capacity of wheat flour crude pentosans and their relation to mixing characteristics of dough. Cereal Chemistry, 48, 211-222.
Khatkar B.S. and Schofield J.D., 1997. Molecular and physico-chemical basis of breadmaking-properties of wheat glutenin proteins: A critical appraisal. J. Food Sci. Technol., 34, 85-102.
Li W., Dobraszczyk B.J., Dias A., and Gil A.M., 2006. Polymer conformation structure of wheat proteins and gluten sub-fractions revealed by ATR-FTIR. Cereal Chemistry, 83, 407-410.
Lindsay M.P. and Skerritt J.H., 1999. The glutenin macropoly-mer of wheat flour doughs: Structure-function perspectives. Trends Food Sci. Technol., 10, 247-253.
Maucher T., Figueroa J.D.C., Reule W., and Peña J., 2009.
Influence of low molecular weight on viscoelastic proper
-ties of intact wheat kernels and their relation to functional properties of wheat dough. Cereal Chemistry, 86, 372-375.
Mohsenin N.N., 1986. Physical properties of plant and animal materials. Structure, physical characteristics and mechani-cal properties. Gordon and Breach Science, New York, USA.
Ponce-García N., Ramírez-Wong B., Torres-Chávez P., Figueroa-Cárdenas J.D., Serna-Saldivar S.O., Cortez-Rocha M.O., and Escalante-Aburto A., 2016. Evaluation of visco-elastic properties of conditioned wheat kernels and their doughs using a compression test under small strain. J. Sci. Food Agric., 97, 1235-1243.
Santos D.M.J., Monteiro S.R., and da Silva J.A.L., 2005. Small strain viscoelastic behaviour of wheat gluten-pentosans mixtures. European Food Res. Technol., 221, 398-405.
Saxena C.D., Rao U.J.S.P., and Rao P.H., 1997. Indian wheat cultivars: correlation between quality of gluten proteins, rheological characteristics of dough and tandoori roti qua- lity. J. Sci. Food Agric., 74, 265-272.
Staniforth J.N. and Patel C.I., 1989. Creep compliance behavior of direct compression excipients. Powder Technol., 57, 83-87.
Žilić S., Barać M., Pešić M., Dodig D., and Ignjatović-Micić
D., 2011. Characterization of proteins from grain of diffe-