Vol.8 (2018) No. 5
ISSN: 2088-5334
Intrusion Detection System using Multivariate Control Chart
Hotelling's T
2
based on PCA
Muhammad Ahsan
#1, Muhammad Mashuri#
2, Heri Kuswanto
#3, and Dedy Dwi Prastyo
#4#
Department of Statistics, Institut Teknologi Sepuluh Nopember, Kampus ITS-Sukolilo, Surabaya 60111, Indonesia E-mail: [email protected], [email protected], [email protected], [email protected]
Abstract— Statistical Process Control (SPC) has been widely used in industry and services. The SPC can be applied not only to
monitor manufacture processes but also can be applied to the Intrusion Detection System (IDS). In network monitoring and intrusion detection, SPC can be a powerful tool to ensure system security and stability in a network. Theoretically, Hotelling’s T2 chart can be used in intrusion detection. However, there are two reasons why the chart is not suitable to be used. First, the intrusion detection data involves large volumes of high-dimensional process data. Second, intrusion detection requires a fast computational process so an intrusion can be detected as soon as possible. To overcome the problems caused by large number of quality characteristics, Principal Component Analysis (PCA) can be used. The PCA can reduce not only the dimension leading a faster computational, but also can eliminate the multicollinearity (among characteristic variables) problem. This paper is focused on the usage of multivariate control chart T2 based on PCA for IDS. KDD99 dataset is used to evaluate the performance of the proposed method. Furthermore, the
performance of T2 based PCA will be compared with conventional T2 control chart. The empirical results of this research show that the multivariate control chart using Hotelling’s T2 based on PCA has excellent performance to detect anomaly in network. Compared
to conventional T2 control chart, the T2 based on PCA has similar performance with 97 percent hit rate. It also requires shorter computation time.
Keywords— intrusion detection; multivariate control chart; hotelling’s T2; PCA.
I. INTRODUCTION
Statistical Process Control (SPC) has been widely used in many fields, particularly in industry and services. SPC not only can be applied to monitor the manufacturing or industrial processes but also can be utilized for Intrusion Detection System (IDS). In network monitoring and intrusion detection, SPC can be used as a powerful tool to guarantee safety and stability in a network system [1]. There are many studies on SPC that has been implemented in IDS [2]. SPC has an advantage because it does not require knowledge of an unprecedented attack. In addition, using SPC in IDS can also guarantee the real-time attack detection [3]. Moreover, the SPC can be used to monitor intrusion both in univariate and multivariate case.
The univariate control chart is a control chart only
monitoring one characteristic such as X chart [4], Exponentially Weighted Moving Average (EWMA) control chart [5] and Cumulative Sum (CUSUM) control chart [6]. To monitor the stability on the univariate attribute process, some control charts such as the p chart [7,8], and np control chart [9] have been developed. Furthermore, the multivariate control chart is a control chart used to control production
process with more than one correlated or uncorrelated characteristics. The latest investigation of the multivariate control chart includes of [10–18].
Hotelling’s T2 control charts with Support Vector Machine (SVM) and Triangle Area-based Nearest Neighbors (TANN) methods and found high accuracy Hotelling’s T2 for all types of attack classes. In addition, Ahsan et al. proposed the Hotelling’s T2 control charts based on Successive Difference Covariance Matrix (SDCM) with bootstrap control limit to monitor the anomalies in the network [24].
In the theory, the network intrusion detection can be monitored by using Hotelling’s T2 chart technique. Nevertheless, there are two arguments why this method is not suitable to be employed for this case ([19],[25]). Firstly, the intrusion detection system involves large volumes of high-dimensional connection. Secondly, the network monitoring system requires a fast computational process so that an anomaly can be quickly detected. In fact, the effectiveness of conventional multivariate control charts such as Hotelling’s T2 is increased for a small number of quality characteristics. If large number of quality characteristics used then the performance of control chart to detect any shift in a process may be decreased [26]. Large numbers of highly correlated quality characteristics often take place in modern manufacturing processes. As a result, the computation of the T2 statistic is difficult due to the singularity of the covariance matrix ([27],[28]).
To overcome the problems arise in monitoring large number of quality characteristic, the Principal Component Analysis (PCA) can be used as an alternative solution. The PCA procedure can reduce the feature so that the faster computational process can be achieved. This method also can eliminate the multicollinearity problem on the process. PCA is a multivariate method that extracts a new set of variables by projecting the input variables onto principal component space. The extracted variables which are called as principal components (PCs) are linear combinations of the original variables in which the coefficients of the linear combination can be obtained from the eigenvectors of the covariance or correlation of the input data [29].
PCA is widely used to monitor anomalies in the network. Wang et al. [30] developed PCA for intrusion detection with fast calculation and high efficiency. PCA can also be used for feature reduction [31] and feature selection [32]. In addition, PCA can be combined with machine learning methods such as SVM [33], genetic algorithm [34] and naïve bayes [35]. Chen et al. [36] using the Multi-Scale Principal Component Analysis (MSPCA) to identify the Denial of Service (DoS) attacks.
Based on the aforementioned above, the integration between PCA and T2 chart is a good alternative to solve the problems caused by a large number of quality characteristic and ineffective computational time. PCA technique for Hotelling’s T2 charts construction presented using the first k principal components (PCs) [37]. This paper will focus to create IDS using multivariate T2 control chart based on PCA. KDD99 DARPA dataset would be used to evaluate the performance of proposed IDS. Moreover, the performance of the proposed method is compared with existing T2 chart. The rest of this paper is arranged as follows. In Section 2, a brief review about T2 based PCA, KDD99 Cup DARPA and IDS method are presented. Section 3 contains result and discussion about the performance of PCA control chart in
intrusion detection. Finally, Section 4 is devoted to the conclusion.
II. MATERIAL AND METHOD
A. Hotelling’s T2 control chart
Hotelling’s T2 control chart [38] is one of the multivariate control charts that could be used to monitor the mean of production process [26] and to detect multivariate outliers [39]. Let x , where i i=1, 2,…,n denotes the number of observation, are random vectors follow multivariate normal with common mean vector and covariance matrix, i.e.
~ ( , ).
i Np
x μ Σ On the other hand, those n×p dataset could be denoted as: X=x x'1, '2,…,xn' '. The T
2 statistics [40]
can be calculated according to the following equation:
(
) (
' 1)
2
,
i i i
T = x −x S− x −x (1)
where:
1 1 n
i i n =
=
x x and
(
)(
)
'1 1
1 n
i i
i n =
=
−
− −S x x x x
.
With the assumption that the data are multivariate normally distributed, the T2 chart control limit is formulated as follows:
2 ( , , )
( 1)( 1)
,
p n p p n n
CL F
n np α −
+ −
=
− (2)
where n denotes the number of observation, p denotes the number of variables and αdenotes the false alarm rate. The process is said to be out of control when the statistics are located on the outside of the control limits [26].
B. T2 control chart based on PCA
The PCA is the most widely and commonly used procedure for high-dimensional, noisy, and highly correlated process data. This happens due to its ability to handle such input data by projecting it onto a lower-dimensional subspace that contains most of the variance of the input data [41]. The new observations are a linear combination of the original observations [42]. Data standardization is often suitable when the variables are in different measurement units or when the variance of the different columns of the data is substantial. The standardized data can be calculated as follows:
1/ 2
( x) −
= −
Z X 1 D , (3)
where 1= 1,
(
…,1)
T is a n x 1 vector, 1/ 2 (diag S( ))=
D is the
diagonal matrix with standard deviation of each variable as diagonal. It is worth pointing out that the covariance matrix
R of the standardized data Z is exactly the correlation matrix
of the original data, and it can be computed as
1/ 2 1/ 2
=
R D SD . (4)
The PCA is then performed by employing the eigendecomposition of the matrix R as follows:
T
=
where A=(a1, ....,ap) is a p×p matrix of eigenvectors and Λ=diag( , ...,λ1 λ2) is diagonal matrix of eigenvalues.
These eigenvalues are equal to the variance explained by each of principal component score matrix is a n×p data matrix Y given by:
1
( , ..., )T p
y y
= =
Y ZA . (6)
The T2 based PCA control chart uses first k PCs to create control chart. The statistics of T2 based on PCA control chart can be computed by using the following formula:
T2
2
1
( )
k
l l l= λl
−
=
y μ , (7)where the first k PCs are y ll, =1, ...,k , and λl is the eigenvalue corresponding to the l-th PC. Under the assumption the data follow the multivariate distribution, the control limit of can be obtained as follows:
(, k, n k) 2
( 1)( 1)
k n n
CL F
n nk α −
+ −
=
− , (8)
where n is the number of observation, k is the number of PCs retained and αis false alarm rate.
C. Intrusion Detection System using Control Chart
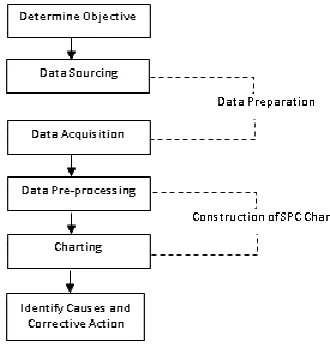
In general, intrusion detection process using the control chart [2] is presented in Figure 1. Determining the objective of the system is the first step for this procedure. The main purpose of an IDS is to correctly and quickly detect the intrusion on the network with a low rate of false alarms. The second step is data preparation which is one of the difficult parts in the IDS process and consuming much time. There are two steps in data preparation such as data sourcing and data acquisition. Data sourcing refers to identify the sources and select the target of the data. Data Acquisition refers to transform the target data into the input data that can be used in the control chart method.
The next step is the construction of a control chart. Construction of control chart is divided into two steps such as data pre-processing and create a control chart. In this step, the control limits previously estimated are then applied to monitor network traffic. Finally, the identification and corrective actions are executed.
Fig. 1 Intrusion Detection System using Control Chart Method
D. KDD99 Dataset
The Knowledge Discovery and Data Mining 99 (KDD99) dataset [43] is the most widely used and accepted benchmark dataset for network IDS. The KDD99 is a feature extraction of Defense Advanced Research Project Agency (DARPA) dataset. This dataset has included some types of attacks that occur in the network so that many researchers use it to test the merits of the new method proposed.
The KDD99 dataset has the following characteristics [44]: 1. KDD99 consists of two weeks of free attack data as well as five weeks of data with attacks. It is suitable to test a model in detecting anomaly attacks.
2. The label category consists of five types: DoS (Denial of Service), Probe, R2L (Root 2 Local), U2R (User 2 Root), and Normal.
3. The KDD99 dataset has an unbalanced pattern. About 80% of the data is an attack (3.925.650 attacks from 4.898.430 data). Under normal circumstances, the existing data type is 99.99% of normal data. Therefore, some studies do resample to get normal data on KDD99.
4. Each connection has 41 variables consisting of 34 metric variables and 7 non-metric variables.
TABLEI
CHARACTERISTICS OF KDD99TRAINING DATASET
Class Training
Size
Percentage (%)
Normal 972,781 19.85
DOS 3,883,390 79.27
Probe 41,102 0.83
U2R 52 0.001
R2L 1,106 0.020
Total 4,898,431 100.00
TABLEII
CHARACTERISTICS OF KDD99TESTING DATASET
Class Training
Size
Percentage (%)
Normal 60,593 19.48
DOS 231,455 74.41
Probe 4,166 1.33
U2R 245 0.07
R2L 14,570 4.68
Total 311,029 100.00
E. Method
(0.23%) R2L and 52 (0.01%) U2R connections. This study only use 32 out of 34 quantitative variables because two other quantitative variables have the same values (entirely zero). Moreover, testing dataset as shown in Table 2 would be used to evaluate the performance of IDS.
The steps employed to detect intrusions with the T2 based on PCA chart is described as follows. The first step in this IDS is formed a normal profile or in control process from the normal connection. Then, each new connection would be compared with a normal profile. The new connection that significantly different from normal connection would be suspected as an intrusion. The algorithm for IDS with T2 based PCA chart divided into two phase as follows:
Phase I: Building Normal Profile
1. Form matrix principal component Ynormalfrom normal
connection data Xnormalusing equation (6).
2. Calculate vectorµl,l=1, 2, ...,p which is the average of each column of Ynormal.
3. Create diagonal matrix of eigenvalues
S
which is thevariance of Ynormal.
Phase II: Detection
1. Form matrix Xtestwhich is the new connection data.
2. Calculate Ytest
=
Xtest.
S3. Determine α and
k
that will be used in the analysis.4. Calculate statistics T2
2
1
( test )
k l l l
l s
µ
=
−
=
y5. Calculate control limit ( ,k,n k)
2
( 1)( 1)
k n n
CL F
n nk α −
+ −
= −
6. If Ti2
>
CL
then the connection is intrusion and if2
i
T
<
CL
the connection is normal. TABLEIIIINTRUSION DETECTION CONFUSION MATRIX
Prediction
Intrusion Normal
Intrusion True Positives (TP) False Negatives (FN)
Normal False Positives (FP) True Negatives (TN)
Moreover, the performance of IDS would be evaluated by the confusion matrix as shown in Table 3. The accuracy of a classification method could be measured by the degree of accuracy and degree of error. The accuracy in detecting intrusion can be divided into two types:
a. True Positives (TP) is number of successful attack that is concluded as an attack.
b. True Negatives (TN) is number of normal activities that are successfully detected as normal activity.
The misdetection in intrusion detection can be divided into two types:
a. False Positives (FP) is number of normal activities that are detected as an attack.
b. False Negatives (FN) is number of successful attacks that are detected as normal activity.
FP causes a false alarm while FN allows an attack on the system. The level of accuracy used is the hit rate that can be calculated as follows:
Hit Rate TP TN
TP TN FP FN
+ =
+ + +
.
Based on the type of inaccuracy, the level of misdetection in intrusion detection can be divided into two types, namely FP rate and FN rate which can be written as follows:
Rate FP
FP
TN FP
=
+
.
Rate FN
FN
TP FN
=
+
.
III.RESULT AND DISCUSSION
In this section, the results and discussion from the evaluation performance of proposed IDS using T2 based on PCA are presented. The performance of the proposed T2 based on PCA would be compared with conventional T2 control chart.
A. Result
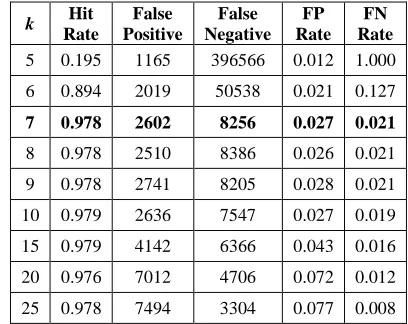
The intrusion detection process using T2 based PCA is analyzed by determining α and number of PCs (denoted as k) that used in the analysis. Using α =0.00273which refers to three sigma, optimal k would be determined by its hit rate, false positive rate and false negative.
TABLEIV
INTRUSION DETECTION RESULTS FOR A DIFFERENT NUMBER OF PRINCIPAL COMPONENTS
k Hit
Rate
False Positive
False Negative
FP Rate
FN Rate
5 0.195 1165 396566 0.012 1.000
6 0.894 2019 50538 0.021 0.127
7 0.978 2602 8256 0.027 0.021
8 0.978 2510 8386 0.026 0.021
9 0.978 2741 8205 0.028 0.021
10 0.979 2636 7547 0.027 0.019
15 0.979 4142 6366 0.043 0.016
20 0.976 7012 4706 0.072 0.012
25 0.978 7494 3304 0.077 0.008
research used seven principal components to speed up the detection process. In addition, the FP rate and FN rate also look more balanced when using seven principal components.
Fig. 2 False Positive and False Negative Rate with different α for k=7
Figure 2 shows the α selection for the IDS. The horizontal axis represents the value of α while the FP and FN rate value are represented by the vertical axis. It can be seen from the figure that the greater value of α would produce high value the FP rate. On the contrary, the FN rate will be smaller along with the increasing value .α Therefore, in this study small value of α =0.001 was used in order to produce an optimal value of FP rate and the optimal FN rate in IDS.
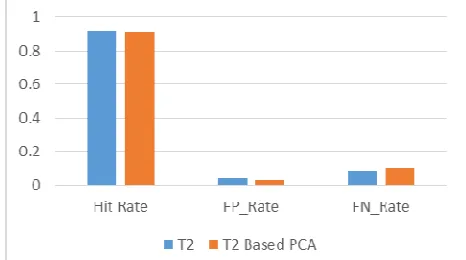
Fig. 3 Performance Comparison of T2 and T2 Based PCA Using 7 principal
components for the training dataset
Performance comparison of T2 chart and T2 based on PCA chart for training dataset was shown in Figure 3. Using k=7 and α =0.001, both charts produce a similar value of hit rate. Even though the hit rate of T2 still higher with 0.9799 than T2 based on PCA chart with 0.9779, there is not much difference between the accuracy of attack prediction. The value of FP rate for T2 chart is higher value than T2 based on PCA chart. For FN rate, T2 and T2 based on PCA chart produce almost the same value, although T2 based on PCA chart has a higher value.
Figure 4 shows the computational time comparison of T2 chart and the T2 based PCA chart. The T2 based on PCA diagram requires only 2.9152 seconds to complete the analysis process of 489.843 connections. In contrast, the T2 chart requires 3.2462 seconds to complete the analytical process for the same number of connections. Thus, it can be concluded that T2 based on PCA chart have more effective computation time than T2 chart.
Fig. 4 Time Comparison of T2 and T2 Based PCA Using 7 principal component for training data
Based on performance evaluation result from T2 based on PCA on training dataset, it can be seen that by using k = 7 and α =0.001, IDS produce high hit rate with faster computation time than the conventional method. Furthermore, the performance of the proposed IDS system will be evaluated for new connection using the testing dataset of KDD99.
Fig. 5 Performance Comparison of T2 and T2 Based PCA Using 7 principal
components for testing dataset
Comparison of T2 chart performance with T2 based on PCA chart for the testing dataset can be seen in Figure 5. Analog with training dataset, T2 chart and T2 based on PCA chart have similar hit rate and FP rate. While the value of FN rate for T2 based on PCA chart is higher than T2 chart. In addition, it can be seen that the value of hit rate of testing data has been decreased compared with training dataset. The hit rate decrease from 0.9799 to 0.9216 for the T2 chart diagram and from 0.9779 to 0.9125 for the T2 based on PCA chart. In addition, the FN rate for the testing dataset is higher than the FN rate for training dataset.
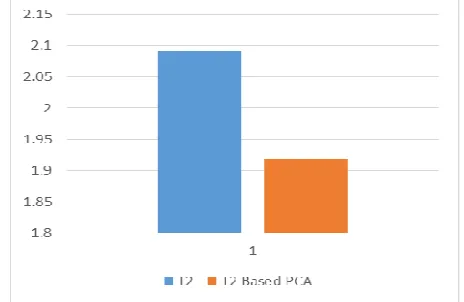
Comparison of computational time of T2 based PCA chart with T2 chart for the testing dataset is shown in Figure 6. It can be seen for testing dataset T2 based PCA chart produce faster computation time than T2 chart. The T2 based PCA chart requires 1.9175 seconds of analysis time while the T2 chart requires 2.0928 seconds to complete the analysis with the same number of connections.
B. Discussion
performance in training dataset. Nevertheless, the performance of the proposed IDS decreases when using to evaluate testing dataset. Based on the fact from the results, there are three possibilities that can cause performance degradation. First, the normal profile used to evaluate testing dataset is a normal connection from the training dataset.
Fig. 6 Time Comparison of T2 and T2 Based PCA Using 7 principal
component for testing dataset
Decreasing performance in the testing dataset can be the result of the inability of the normal profile from training dataset to capture any pattern changes in testing dataset. The normal profile of the training dataset needs to be updated with new connection with normal status from the testing dataset. On of method can be employed to overcome this problem is an incremental learning algorithm which has the ability to update existing patterns based on new data [46].
TABLEV
SUMMARY OF INTRUSION DETECTION RESULT ON KDD99 TRAINING AND TESTING DATASET
Dataset IDS Hit Rate FP Rate FN Rate Time (Second)
Training T
2 0.9799 0.0673 0.0085 3.2462
T2 PCA 0.9779 0.0254 0.0213 2.9152
Testing T 2
0.9216 0.0429 0.0870 2.0928
T2 PCA 0.9125 0.0277 0.1020 1.9175
Second, the control limits in this study were built with normal multivariate assumptions. However, in reality, the distribution of computer network data does not always follow multivariate normal distribution. This is caused by the attacks that occur on a network which produce extreme values [47]. The control limit of Hotelling’s T2 is calculated from F distribution by assuming monitored process data follow the multivariate normal distribution [28]. However, when the assumption does not hold, a control limit based on the F distribution that used in this study may be inaccurate because a control limit determined this way can increase the rate of false alarms[48]. This fact can be seen from the high value of FN rate in testing dataset. The inability of the control limits to capture the intrusion leads to decreasing performance of the proposed IDS. This will be very dangerous because high value of FN rate on IDS can be a fatal problem because it allows attacks without warning. To overcome this condition, the Kernel Density Estimation
method can be adopted in order to increase the level of precision of the IDS as demonstrated in [49].
Finally, PCA is built with the assumption of a linear relationship between variables. However, in reality, the relationship that occurs in a network data is not always linear. PCA performs poorly due to its assumption that the process data are linear. This is can be seen in some complicated cases in manufacturing and chemical processes which have a nonlinear relationship [50].
Therefore, it needs to improve the proposed IDS by paying attention to normal profile data for training dataset, control limit for non-normal distribution and nonlinear process data. Thus, IDS which has a high hit rate with small false alarm and computing time can be constructed.
IV.CONCLUSIONS
This paper proposes integration between PCA and Hotelling’s T2 chart to create IDS for network anomaly detection. In summary, based on performance evaluation of IDS, multivariate control chart Hotelling’s T2 based on PCA has excellent performance to detect an anomaly in the network. Compared to conventional Hotelling’s T2 chart, T2 based on PCA has similar performance with 97 percent hit rate with small computational time. However, in testing dataset, the performance of both T2 chart and T2 based on PCA decrease. Nevertheless, the decline is not significant because the IDS can still detect about 91 percent of the intrusions that occur in the network.
The future research will be conducted to improve the drawbacks of proposed IDS by utilizing combined incremental learning algorithm and KDE. The incremental learning can overcome the inability of the normal profile from training dataset to capture any pattern changes in testing dataset. Meanwhile, the KDE method is adopted to adaptively re-calculate the control limit of the proposed IDS. The present work can also be extended by monitoring the multiclass attack on the dataset.
ACKNOWLEDGEMENT
The author would like to acknowledge the financial support from DRPM-RISTEKDIKTI sponsorship through the PMDSU-Scheme for the year 2018.
REFERENCES
[1] S. Bersimis, A. Sgora, S. Psarakis, The application of multivariate statistical process monitoring in non-industrial processes, Quality Technology and Quantitative Management. 3703 (2016) 1–24. doi:10.1080/16843703.2016.1226711.
[2] Y. Park, A Statistical Process Control Approach for Network Intrusion Detection, Georgia Insitute of Technology, 2005.
[3] C.A. Catania, C.G. Garino, Automatic network intrusion detection: Current techniques and open issues, Computers & Electrical
Engineering. 38 (2012) 1062–1072.
doi:10.1016/j.compeleceng.2012.05.013.
[4] W.A. Shewhart, Some Applications of Statistical Methods to the Analysis of Physical and Engineering Data, Bell Labs Technical Journal. 3 (1924) 43–87.
[5] S.W. Roberts, Control Chart Tests Based on Geometric Moving Averages, Technometrics. 1 (1959) 239–250. doi:10.1080/00401706.1959.10489860.
[7] D.B. Laney, Improved control charts for attributes, Quality Engineering. 14 (2002) 531–537.
[8] M. Ahsan, M. Mashuri, H. Khusna, Evaluation of Laney p’ Chart Performance, International Journal of Applied Engineering Research. 12 (2017) 14208–14217.
[9] W.H. Woodall, Control charts based on attribute data: Bibliography and review, Journal of Quality Technology. 29 (1997) 172. http://proquest.umi.com/pqdweb?did=11613494&Fmt=7&clientId=4 3036&RQT=309&VName=PQD.
[10] J.K. Wororomi, M. Mashuri, Irhamah, A.Z. Arifin, On monitoring shift in the mean processes with vector autoregressive residual control charts of individual observation, Applied Mathematical Sciences. 8 (2014) 3491–3499. doi:10.12988/ams.2014.44298. [11] M. Pirhooshyaran, S.T.A. Niaki, A double-max MEWMA scheme
for simultaneous monitoring and fault isolation of multivariate multistage auto-correlated processes based on novel reduced-dimension statistics, Journal of Process Control. 29 (2015) 11–22. doi:10.1016/j.jprocont.2015.03.008.
[12] Alkindi, M. Mashuri, D.D. Prastyo, T2 hotelling fuzzy and W2 control chart with application to wheat flour production process, in: AIP Conference Proceedings, 2016. doi:10.1063/1.4953977. [13] H. Khusna, M. Mashuri, Suhartono, D.D. Prastyo, M. Ahsan,
Multioutput Least Square SVR Based Multivariate EWMA Control Chart, Journal of Physics: Conference Series. 1028 (2018) 12221. http://stacks.iop.org/1742-6596/1028/i=1/a=012221.
[14] H. Sabahno, A. Amiri, P. Castagliola, Optimal performance of the variable sample sizes Hotelling’s T 2 control chart in the presence of measurement errors, Quality Technology & Quantitative Management. (2018) 1–25.
[15] N.A. Adegoke, A.N.H. Smith, M.J. Anderson, S.A. Abbasi, M.D.M. Pawley, Shrinkage estimates of covariance matrices to improve the performance of multivariate cumulative sum control charts, Computers & Industrial Engineering. 117 (2018) 207–216.
[16] M. Ahsan, M. Mashuri, H. Kuswanto, D.D. Prastyo, H. Khusna, Multivariate Control Chart based on PCA Mix for Variable and Attribute Quality Characteristics, Production & Manufacturing Research. 6 (2018) 364–384. doi:10.1080/21693277.2018.1517055. [17] H. Khusna, M. Mashuri, M. Ahsan, S. Suhartono, D.D. Prastyo,
Bootstrap Based Maximum Multivariate CUSUM Control Chart, Quality Technology & Quantitative Management. (2018). doi:10.1080/16843703.2018.1535765.
[18] H. Khusna, M. Mashuri, S. Suhartono, D.D. Prastyo, M. Ahsan, Multioutput least square SVR based multivariate EWMA control chart: The performance evaluation and application, Cogent Engineering. (2018). doi:10.1080/23311916.2018.1531456. [19] N. Ye, X. Li, Q. Chen, S.M. Emran, M. Xu, Probabilistic techniques
for intrusion detection based on computer audit data, IEEE Transactions on Systems, Man, and Cybernetics Part A:Systems and Humans. 31 (2001) 266–274. doi:10.1109/3468.935043.
[20] N. Ye, C. Borror, Y. Zhang, EWMA techniques for computer intrusion detection through anomalous changes in event intensity, Quality and Reliability Engineering International. 18 (2002) 443–451. doi:10.1002/qre.493.
[21] G. Qu, S. Hariri, M. Yousif, Multivariate Statistical Analysis for Network Attacks Detection, The 3rd ACS/IEEE Interenational Conference on Computer Systems and Applications. (2005) 9–14. doi:10.1109/AICCSA.2005.1387011.
[22] N. Ye, D. Parmar, C.M. Borror, A Hybrid SPC Method with the Chi-Square Distance Monitoring Procedure for Large-scale, Complex Process Data, Quality and Reliability Engineering International. 22 (2006) 393–402. doi:10.1002/qre.717.
[23] A. Avalappampatty Sivasamy, B. Sundan, A Dynamic Intrusion Detection System Based on Multivariate Hotelling’s T 2 Statistics Approach for Network Environments, The Scientific World Journal. 2015 (2015) 1–9. doi:10.1155/2015/850153.
[24] M. Ahsan, M. Mashuri, H. Khusna, Intrusion Detection System Using Bootstrap Resampling Approach Of T2 Control Chart Based On Successive Difference Covariance Matrix, Journal of Theoretical and Applied Information Technology. 96 (2018) 2128–2138. [25] R. Rastogi, Z. Khan, M.H. Khan, Network Anomalies Detection
Using Statistical Technique : A Chi- Square approach, International Journal of Computer Science Issues. 9 (2012) 515–522.
[26] D. Montgomery, Introduction to statistical quality control, New York, 2009. doi:10.1002/1521-3773(20010316)40:6<9823::AID-ANIE9823>3.3.CO;2-C.
[27] T. Kourti, Application of latent variable methods to process control and multivariate statistical process control in industry, International
Journal of Adaptive Control and Signal Processing. 19 (2005) 213– 246. doi:10.1002/acs.859.
[28] R.L. Mason, J.C. Young, Multivariate Statistical Process Control with Industrial Applications, Society for Industrial and Applied
Mathematics, 2002.
http://epubs.siam.org/doi/book/10.1137/1.9780898718461.
[29] J.E. Jackson, G.S. Mudholkar, Control Procedures for Residuals Associated with Principal Component Analysis, Technometrics. 21 (1979) 341–349. doi:10.1080/00401706.1979.10489779.
[30] W. Wang, X. Guan, X. Zhang, A Novel Intrusion Detection Method Based on Principle Component Analysis in Computer Security, in: F.-L. Yin, J. Wang, C. Guo (Eds.), Advances in Neural Networks - ISNN 2004, Springer Berlin Heidelberg, Berlin, Heidelberg, 2004: pp. 657–662. http://link.springer.com/10.1007/978-3-540-28648-6_105.
[31] S. Lakhina, S. Joseph, B. Verma, Feature Reduction using Principal Component Analysis for Effective Anomaly–Based Intrusion Detection on NSL-KDD, International Journal of Engineering Science and Technology. 2 (2010) 1790–1799.
[32] Z. Chen, C.K. Yeo, B.S.L. Francis, C.T. Lau, Combining MIC feature selection and feature-based MSPCA for network traffic anomaly detection, in: IEEE, 2016: pp. 176–181. doi:10.1109/DIPDMWC.2016.7529385.
[33] F. Kuang, W. Xu, S. Zhang, A novel hybrid KPCA and SVM with GA model for intrusion detection, Applied Soft Computing Journal. 18 (2014) 178–184. doi:10.1016/j.asoc.2014.01.028.
[34] K.J. Chabathula, C.D. Jaidhar, M.A.A. Kumara, Comparative study of Principal Component Analysis based Intrusion Detection approach using machine learning algorithms, in: Signal Processing, Communication and Networking (ICSCN), 2015 3rd International Conference On, 2015: pp. 1–6. doi:10.1109/ICSCN.2015.7219853. [35] X. Han, L. Xu, M. Ren, W. Gu, A Naive Bayesian Network Intrusion
Detection Algorithm Based on Principal Component Analysis, in: IEEE, 2015: pp. 325–328. doi:10.1109/ITME.2015.29.
[36] Z. Chen, C.K. Yeo, B.S.L. Francis, C.T. Lau, A MSPCA based intrusion detection algorithm tor detection of DDoS attack, in: IEEE, 2015: pp. 1–5. doi:10.1109/ICCChina.2015.7448617.
[37] J.E. Jackson, Quality Control Methods for Several Related Variables, Technometrics. 1 (1959) 359–377.
[38] H. Hotteling, Multivariate Quality Control, in: Techiques of Statistical Analysis, Eisenhart, McGraw-Hill, New York, 1947. [39] J.D. Williams, W.H. Woodall, J.B. Birch, J.O.E.H. Sullivan, On the
Distribution of Hotelling ’ s T 2 Statistic Based on the Successive Differences Covariance Matrix Estimator, Journal of Quality Technology. 38 (2006) 217–229.
[40] H. Hotelling, Multivariate quality control, in: Techniques of Statistical Analysis, McGraw-Hill., New York, 1974.
[41] B.M. Wise, N.B. Gallagher, The process chemometrics approach to process monitoring and fault detection, Journal of Process Control. 6 (1996) 329–348. doi:10.1016/0959-1524(96)00009-1.
[42] R.A. Johnson, D.W. Wichern, Applied Multivariate Statistical Analysis, Pearson Education International. (1998) 226–235. doi:10.1198/tech.2005.s319.
[43] S.J. Stolfo, KDD cup 1999 dataset, UCI KDD Repository. Http://Kdd.Ics.Uci.Edu. (1999) 0.
[44] A. Özgür, H. Erdem, A review of KDD99 dataset usage in intrusion detection and machine learning between 2010 and 2015, PeerJ Preprints. (2016). doi:https://doi.org/10.7287/peerj.preprints.1954v1. [45] 10 percent KDD99 dataset, (n.d.).
http://kdd.ics.uci.edu/databases/kddcup99/kddcup.data_10_percent.g zis.
[46] N. Ye, X. Li, A scalable, incremental learning algorithm for classification problems, Computers and Industrial Engineering. 43 (2002) 677–692. doi:10.1016/S0360-8352(02)00132-8.
[47] X. Zhu, Anomaly Detection Through Statistics-Based Machine Learning For Computer Networks, The University of Arizona, 2006. [48] Y.-M. Chou, R. Mason, J. Young, the Control Chart for Individual
Observations From a Multivariate Non-Normal Distribution, Communications in Statistics: Theory & Methods. 30 (2001) 1937. doi:10.1081/STA-100105706.
[49] M. Ahsan, M. Mashuri, H. Kuswanto, D.D. Prastyo, H. Khusna, T2 Control Chart based on Successive Difference Covariance Matrix for Intrusion Detection System, in: Journal of Physics: Conference Series, IOP Publishing, 2018: p. 12220.