ELECTRICAL RESISTIVITY MEASUREMENTS OF CARBONIZED CATTLE
BONE/EPOXY COMPOSITE FOR ELECTRICAL INSULATION
A. D. Omah
1,*, E. O. Oji
2, S. C. Madu
3, E. G. Okonkwo
4and I. C. Ezema
51, 2, 3, 4, 5,
D
EPT.
OFM
ETALLURGICAL&
M
ATERIALSE
NGR.,
U
NIVERSITY OFN
IGERIA,
N
SUKKA,
E
NUGUS
TATE,
NIGERIA
E-mail addresses:1[email protected], 2[email protected], 3 [email protected]4[email protected] , 5 [email protected]
ABSTRACT
This research was focused on determining the electrical resistivity of composite materials developed from carbonized and uncarbonized animal cattle bone (CB). The cattle bone was carbonized at 750°C in the absence of oxygen using a heat treatment furnace; after which they were milled into powder and sieved into 150µm, 300µm and 600µm. The epoxy resin used varied from 10wt% to 60wt%. The effect of carbonization on the resistivity properties was studied and used as criteria for the evaluation of the composites. Better enhancement of property was obtained for the composites with lower wt% and smaller particle sizes. Higher resistivity was evident in the uncarbonized samples. The Cube and 3D graphs show the estimated response surface for the composite properties as a function of sample condition, wt%, and particle size. It is also evident from the results that the actual experimental values are in close proximity with the predicted values.
Keywords: carbonization, composite, cow bone, electrical resistivity, electrical insulation
1. INTRODUCTION
Increase in industrial and electrical activities have led to an ever increasing demand for improvised materials, satisfying strict requirements like high strength, high modulus, improved dielectric strength, high dielectric constant, high resistivity, lower density, lower costs, light weight etc. Traditional materials often fail to achieve all these properties together and hence focus is shifting more towards composite material. Design flexibility in composite materials allows use of constituents which work together to meet harsh and challenging demands of modern engineering applications thus allowing their use in electrical and electronics industry, automobiles, marine, aeronautical, sports, and related applications [1]
Growing raw material cost throughout the world particularly in the electronics industry has compelled researchers to blend and produce new material that will have high resistivity, good strength and stiffness, low cost and environmentally friendly materials [2]; thus, the essence of this work: production and measurement of the resistivity of cattle bone (CB) epoxy composite.
An introduction of composite materials changed the world especially in engineering fields. Composite is a multiphase material consisting of two or more
physically or chemically different components in which one of the components have superior properties. Composite materials can also be defined as a material formed by the combination of two or more materials to achieve properties that are superior to those of their constituents [3]. Polymer composites consist of a resin as the matrix, with fillers as the reinforcing medium. In material science and engineering, composite means a material that consists of a matrix as the binder (continuous phase) and reinforcement (discontinuous phase).
Considerable interest has been generated in the manufacture of thermoset composites due to their unique properties, which includes their good mechanical properties, insulation properties, thermal stability and a reduced product cost. Due to the combination of more than one material in composite production, the properties of composites are influenced by factors such as nature of the filler, interfacial bonding etc. This study was based on the measurement of the resistivity of cattle bone particulate composite. Electrical resistivity is a key property of all materials. It is often necessary to accurately measure the resistivity of a given material. When a voltage is applied to a material or device, current will flow through it. How much current will flow is based on the resistance that
Vol. 37, No. 4, October 2018, pp.
1032 – 1038
Copyright© Faculty of Engineering, University of Nigeria, Nsukka,Print ISSN: 0331-8443, Electronic ISSN: 2467-8821
www.nijotech.com
the material applies to a circuit. The resistance of a material is based on a number of factors, the most important being its resistivity. In general terms, resistance is the capacity of a circuit or material to oppose the flow of an electrical current and is referred to as Ohms (Ω). Resistivity is the measurement of a device's resistance.
Elements that are highly resistant to the flow of electrons are called insulators. Insulators are typically tested for their resistance as well as their dielectric strength. Solid elements are classified as insulators, semi-conductor, or conductors based on their resistivity. The measured resistivity of a material sample depends on its size and thickness. Temperature, humidity, and electrification time, among other factors, also affect resistivity. [4]
Cattle bones are readily available in Nigeria due to large number of cattle that are being slaughtered daily to give meat; and the bones from these cattle in most cases, constitute waste and pollute the environment. Cattle bone being natural animal fibre is expected to have good surface compatibility (i.e. good interfacial contact with the epoxy resin) in addition to the structural compatibility requirements as biomaterials [5, 6]. This research used cattle bone to reinforce epoxy resin as an extension of previous research on recovery of agro-waste materials into useful products. The success of this investigation will give value addition to this agro waste. Thus, this work investigated the applicability of cattle bone particles, being animal filler as reinforcement in epoxy matrix to develop materials with suitable insulation properties (resistivity). The presence of blood, bone marrow and some volatile matter in cattle bone may hinder a good interfacial bonding between the matrix and the particulate filler; thus, the need for carbonization. Carbonization is the term used to denote the general process of removing the free moisture and volatile matter from coal and other solid carbonaceous materials by the application of heat in the absence of air. It is the term used when complex carbonaceous substances such as wood or agricultural residues are broken down by heating into elemental carbon and chemical compounds which may also contain some carbon in their chemical structure [7]. Carbonization of CB therefore involves converting CB as an agricultural residue into elemental carbon and other chemical compounds by heating in the absence or limited amount of air to a temperature high enough to dry off volatile substances in the CB. The volatile matter contains the OH group which prompts water absorption in composite thereby having a negative effect on materials electrical insulation properties.
This research was aimed at determining the electrical insulation property of cattle bone – epoxy composite through utilizing cattle bone particulate to produce polymer composites and determine their resistivity for electrical and electronic industries, automobile, marine, and chemical applications.
2. MATERIALS AND METHOD 2.1 Materials
Materials used in this work include: Epoxy LY556 (matrix), uncarbonized and carbonized cattle bone (i.e. UCB and CCB), set of sieves (mesh sizes: 150, 300, and 600µm), hacksaw, water soluble stain remover, vernier caliper, bone crusher, heat treatment furnace, a pair of thongs, digital weighing balance and Digital Mega Insulation Tester. MS 360.
2.2 Method
The agro-wastes material (cattle bone) was locally sourced from a n a b a t t o i r in Nsukka market. They were washed and sun dried for one week, after which they were carbonized at a temperature of 750°C for one hour s o a k i n g t i m e in the absence of oxygen using a muffle heat treatment furnace. The CB particles were milled after carbonization and sieved to particle sizes of 150, 300, and 600µm. The bone was then degreased using a water soluble stain remover so as to get rid of any trace of bone marrow, blood and other impurities that will inhibit the interfacial bonding between the epoxy (matrix) and the cattle bone (reinforcement) [6]. The prepared CB particulates, epoxy resin, and hardener were properly mixed and poured into the mould. The mixture was allowed to cure in the mould and was removed for test analysis. The composites were produced by varying the CB from 40 to 60wt%.
2.3 Mould Preparation/Casting.
a b
Fig. 1 a: Cattle bone under sun drying. b: Sieved carbonized cattle bone
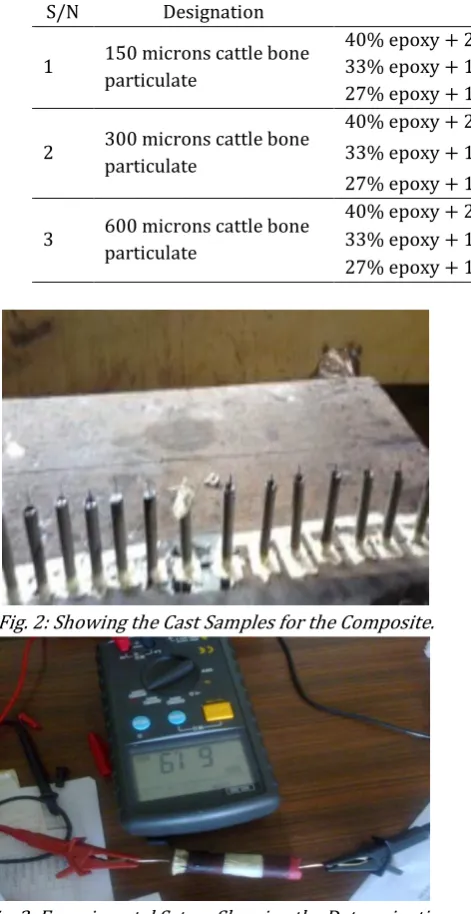
Table 1: The sample compositions.
S/N Designation Composition
1 150 microns cattle bone particulate
40% epoxy + 20% Hardener +40% particulate 33% epoxy + 17% Hardener + 50% particulate 27% epoxy + 13% Hardener + 60% particulate
2 300 microns cattle bone particulate
40% epoxy + 20% Hardener + 40% particulate 33% epoxy + 17% Hardener + 50% particulate 27% epoxy + 13% Hardener + 60% particulate
3 600 microns cattle bone particulate
40% epoxy + 20% Hardener + 40% particulate 33% epoxy + 17% Hardener + 50% particulate 27% epoxy + 13% Hardener + 60% particulate
Fig. 2: Showing the Cast Samples for the Composite.
Fig. 3: Experimental Set up Showing the Determination of Resistivity using Digital Mega Insulation Tester. MS
360.
2.3 Testing of Fabricated Samples
2.3.1 Determination of Volume Resistivity
The resistivity test gave the resistance of the specimen to the flow of electric current; it is measured as an insulation resistance. For the resistivity test, the samples were moulded into cylindrical shapes of diameter 17mm and length 100mm with a copper wire of diameter 2.5mm and length 5mm placed at the ends of each sample. The resistance was expressed in ohms and resistivity was calculated from the equation given below. The resistance was measured using Digital Mega Insulation Tester. MS 360.
( )
Where R is the Resistance in ohm, A is the Cross-sectional area of the sample in m2 and L is the Length of the sample in m
3. RESULTS AND DISCUSSION
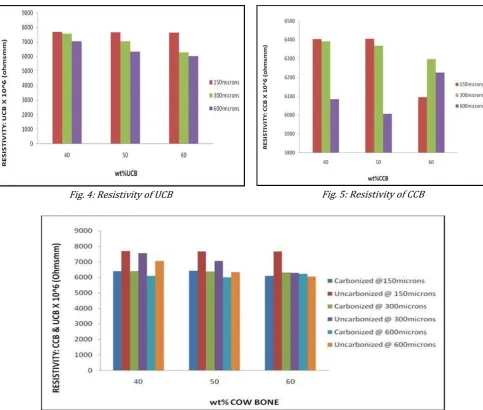
Fig. 4: Resistivity of UCB Fig. 5: Resistivity of CCB
Fig. 6-: Resistivity of CCB and UCB
The electrical resistivity of specimens significantly decreased with carbonization. This is because high carbonization temperatures increased the quantity of the conductive phase in the carbonized samples by enhancing more carbon atoms in the crystal structure to form large graphene sheets. [9, 10]
4. STATISTICAL DESIGN ANALYSIS FOR THE ELECTRICAL PROPERTIES OF CATTLE BONE COMPOSITES.
A full factorial design of experiments of the type Pn was used in this study, where n corresponds to the number of
factors and P represents the number of levels, i.e., n, corresponds to the number of factors (sample condition, wt% of reinforcement and particle size) and P the number of levels (P = 2) upper and lower levels of each variable (see Table 2). Thus, the number of trial
experiments to be conducted for each material is 8 (i.e. 23 = 8). The standard order of sequence is shown in Table 3. The sum of squares for main and interaction effects was calculated using Yates algorithm. The significant factors (main and interaction) were identified by analysis of variance technique.
Table 2: Upper and Lower level of each factor along with their coded values
S/No Variables Upper level Lower level
1 Sample condition(A) Carbonized(+1) Ucarbonized(-1)
2 weight (%)(B) 60 (+1) 40 (-1)
Table 3: Standard Order of Test Sequence and Result
Experiment number Sample condition(A) weight %(B) Particle size(C) µm
1 Ucarbonized(-1) 40(-1) 150(-1)
2 Carbonized(+1) 40(-1) 150(-1)
3 Ucarbonized (-1) 60(+1) 150(-1)
4 Carbonized (+1) 60(+1) 150(-1)
5 Ucarbonized (-1) 40(-1) 600(+1)
6 Carbonized (+1) 40(-1) 600(+1)
7 Ucarbonized (-1) 60(+1) 600(+1)
8 Carbonized (+1) 60(+1) 600(+1)
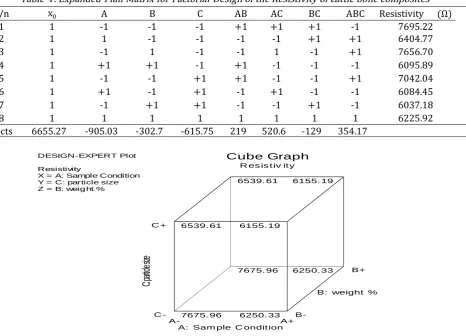
Table 4: Expanded Plan Matrix for Factorial Design of the Resistivity of cattle bone composites
S/n x0 A B C AB AC BC ABC Resistivity (Ω)
1 1 -1 -1 -1 +1 +1 +1 -1 7695.22
2 1 1 -1 -1 -1 -1 +1 +1 6404.77
3 1 -1 1 -1 -1 1 -1 +1 7656.70
4 1 +1 +1 -1 +1 -1 -1 -1 6095.89
5 1 -1 -1 +1 +1 -1 -1 +1 7042.04
6 1 +1 -1 +1 -1 +1 -1 -1 6084.45
7 1 -1 +1 +1 -1 -1 +1 -1 6037.18
8 1 1 1 1 1 1 1 1 6225.92
Effects 6655.27 -905.03 -302.7 -615.75 219 520.6 -129 354.17
Fig. 7: Cube plot of the effect of the Resistivity: Cattle Bone
From the result of factorial design in Table 4, the sample condition and particle size of cattle bone appears to be the most important variable with main effect of (-905.03) and (-615.75). This implies that carbonizing the cattle bone decreases the resistivity by -905.03 and also increasing the particle size of cattle bone decreases the resistivity by -615.75. The effect on the wt% is -302.7, thus, increase in wt% from 40wt% to 60wt% decreased the resistivity by -302.7. It can also be seen that the interaction of AC(520.6), AB(219) and ABC(354.17) have a positive effect of on the resistivity of the composites. While the interaction of BC(-129) has a negative effect on the resistivity of the composites (see the Cube graph and 3D surface plot). The Cube graph shows the estimated response surface
for resistivity as a function of sample condition, wt% and particle size. It can be seen that the resistivity were highly influenced by the sample condition(A) and particle size(C) of cattle bone. For the sample condition and particle size of the cattle bone particles, the resistivity were found to decrease when changing sample condition from uncarbonized to carbonized and particle size from 150microns to 600microns. Figure 7 is the cube plot showing the three factors: Sample Condition (A), wt%(B) and Particle Size(C). The resistivity of the cattle bone is enhanced as you move from the +ve end (i.e. carbonized) to the –ve end (i.e. uncarbonized) of the A axis and as you move from the +ve end (i.e. 600microns) to the –ve end (i.e. 150microns) of the C axis.
DESIGN-EXPERT Plot
Resistivity
X = A: Sample Condition Y = C: particle size Z = B: weig ht %
Cube Graph
R es is t iv it y
A: Sam ple C ondit ion
C:
pa
rtic
le
siz
e
B: weight %
A- A+
C -C +
B-B+
7675. 96
7675. 96 6539. 61
6539. 61
6250. 33
6250. 33 6155. 19
Fig. 8: 3D surface plot of the effect of resistivity of cattle bone.
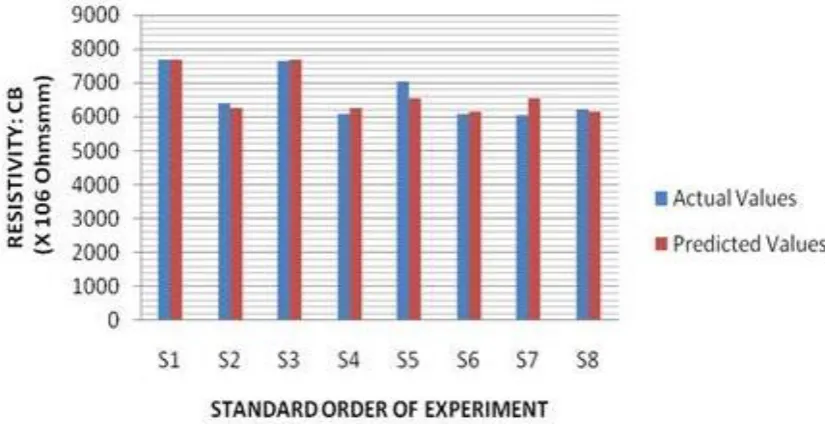
Fig. 9: Actual & Predicted Values of the Resistivity of Cattle Bone
This shows that the uncarbonized particles and the 150microns particle size significantly improved the resistivity of the composite. On the +ve end of B axis, (i.e. 60wt%) and –ve end (i.e. 40wt%) of the B axis, there is no change in the figures; showing that wt% is not a significant factor in enhancing the resistivity of the cattle bone; and that was why the 3D surface plot showed the two factors: sample condition (A) and particle size(C) that significantly influenced the resistivity of the cattle bone.
The 3D surface plot shows the two factors: sample condition (A) and particle size(C) that significantly influenced the resistivity of the cattle bone.
Uncarbonized samples and decreased particle size enhanced the resistivity of the composite samples and played a more significant role than the wt% composition. See ‘Effects’ in Table 4.
Figure 9 shows the predicted values along with the actual experimental values in different experimental conditions. It is evident from the figure that the actual experimental values are in close proximity with the predicted values.
5. CONCLUSION
The following conclusions have been made from the experimental analysis, results and discussions of our
DESIGN-EXPERT Plot
Resistivity
X = A: Sample Condition Y = C: particle size
Actual Factor B: weig ht % = 0.00
6155.19 6535.38 6915.57 7295.77 7675.96
R
esi
stiv
ity
-1.00 -0.50
0.00 0.50
1.00
-1.00 -0.50 0.00 0.50 1.00
investigations/research:
1. Cattle bones are useful in reinforcing epoxy resin for the production of polymeric materials.
2. The developed composites have better resistivity as the particle size additions decreased from 600µmto 150µm.
4. Resistivity had its optimal values on the uncarbonized samples.
5. Expanded plan matrix for factorial design of the resistivity of the composites were used to describe the effects of the variables/factors (temperature, wt% of reinforcement and particle size) and the effects of the interaction of these variables/factors on the resistivity of the composites.
6. The actual experimental values were in close proximity with the predicted values.
6. REFERENCES
[1] Mishra D, Satapathy A “An investigation on the dielectric properties of epoxy filled with glass micro–spheres and boron nitride”, Int Conf. Adv Polym Mater 10–12, 2012.
[2] Agrawal, A., and Satapathy A. Thermal and dielectric behaviour of polypropylene composites reinforced with ceramic fillers. Journal of Materials Science: Materials in Electronics
26:103–12. doi:10.1007/s10854-014-2370-8, 2014a.
[3] Bryan, H. “Engineering Composite Materials”, The Institute of Materials, London, pp. 5, 1999
[4] Martin Rowe -May
21http://www.edu.com/electronics-news/4389712/Resistivity-is-the-key-to.. , 2012.
[5] Mano, J. F., Sousa, R. A., Boesel, L. F., Neves, N. M., and Reis, R. L., “Bioinert, biodegradable and injectable polymeric matrix composites for hard tissue replacement: state of the art and recent developments,” Composites Science and Technology, vol. 64, no. 6, pp. 789–817, 2004.].
[6] Asuke, F., Aigbodion, V. S., Abdulwahab, M, Fayomi, O.S.I., Popoola, A.P.I., Nwoyi, C.I., Garba, B., “Effects of bone particle on the properties and microstructure of polypropylene/bone ash particulate composites”, Results in Physics,
Volume 2, Pages 135–141, 2012.
[7] Tetsuro, M. Michio, O. Shuji, Y. Daisuke, N. Sumio, G. Katsumi, U. and Hirofumi, Y. “Effect of Carbonization Temperature on the Physicochemical Structure of Wood Charcoal”,
Yoshizawal vol. 15, number 2, pp 23 – 32.
[8] Bilyeu B, Brostow W, Menard K. P. Epoxy thermosets and their applications I: chemical structures and applications. J Mater Educ
21:281–283,, 2006.
[9] Hillocks, R. J. “Cassava in Africa”, CABI Publishing Oxon, UK and New York, USA, pp. 40-54, 2002.