ISSN 0975-928X
Research Note
Character association and path analysis of grain yield and yield
components in Maize(
Zea Mays
L.)
S.V.V Prasanna Kumar, D. Ratna Babu
Department of Genetics & Plant Breeding, Acharya N.G. Ranga Agricultural University, Agricultural College, Bapatla, A.P.-522101.
E-Mail: [email protected]
(Received: 12 Aug 2014; Accepted: 21 Apr 2015)
Abstract
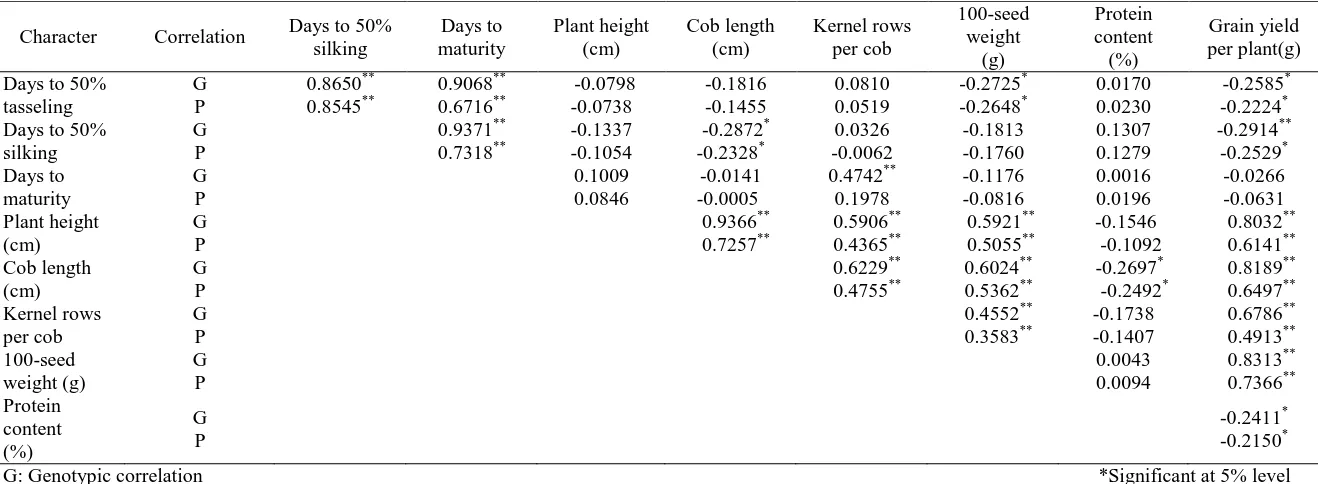
An investigation was carried out to assess the character association and path analysis for nine characters viz., days to 50% tasseling, days to 50% silking, days to maturity, plant height, cob length, kernel rows per cob, 100-seed weight, protein content and grain yield per plant in 29 genotypes (twenty one hybrids, their seven parents along with a check 30-V-92). Association studies revealed that, six out of nine characters exhibited highly significant positive correlation with grain yield per plant. However, the traits 100-seed weight, cob length, plant height, kernel rows per cob, days to 50% silking and days to 50% tasseling were found to possess significant association in desirable direction with grain yield per plant at both genotypic and phenotypic levels. Path analysis studies revealed that 100-seed weight, plant height and kernel rows per cob showed true relationship by establishing significant positive association and direct effect on grain yield per plant.
Keywords
Maize, character association, path analysis, yield
Maize (Zea mays L.) is a diploid (2n 20) cross pollinated crop. It is the second most important cereal crop in the world’s economy. It ranks first in both productivity and production among the cereals and is having worldwide significance due to its demand as food, feed and industrial utilization. It is a good source of carbohydrate, starch, fat, protein, oil in addition to some of the important minerals and vitamins. Maize is known as “Queen of cereals” because of its high production potential and wider adaptability. It is an allogamous crop endowed with the mechanism of protandry and monoecy which lent itself feasible for the exploitation of hybrid vigour. Yield in maize crop has increased substantially over the years as the breeders are successful in harnessing the heterosis or hybrid vigour than in other crop species. This indicates the importance of maize in the ever-increasing demand for food and warrants the continuous development of new high yielding hybrids.
Grain yield being a complex character is very difficult to improve by selecting the genotypes for yield per se. Therefore identifying the characters which are closely related and have contributed to yield becomes highly essential. The estimates of correlation coefficients mostly indicate the inter relationships of the characters whereas path analysis permits the understanding of the cause and effect of related characters (Wright, 1921). The path analysis reveals whether the association of characters with yield is due to their direct effect on yield or is a consequence of their indirect effects via other component characters. Therefore, the present study was
conducted in maize to study the correlation and path coefficients.
Seven inbred lines were mated in Diallel fashion without reciprocals at Agricultural College Farm, Bapatla during kharif 2013 to produce 21 F1s. All these
21 F1s, seven parents along with a check, 30-V-92 were
evaluated during rabi 2013 at Agricultural College Farm, Bapatla in a Randomized Block Design with three replications. The experimental material were raised in three rows of three m length with the spacing of 60 x 30 cm. Observations were recorded on 10 randomly chosen plants for nine quantitative characters viz., days to 50% tasseling, days to 50% silking, days to maturity, plant height (cm), cob length (cm), kernel rows per cob, 100-seed weight (g), protein content (%) and grain yield per plant (g). The data were subjected to statistical analysis and estimates of correlation coefficients were worked out as per Falconer (1964). Direct and indirect effects of yield components on yield were calculated as suggested by Dewey and Lu (1959).
ISSN 0975-928X
plant at both genotypic and phenotypic levels (Table 1). Hence, selection for these characters will help in selecting genotypes with high grain yield per plant. These results were in accordance with findings of Reddy et al. (2013) and Kumar et al. (2014) for the traits 100-seed weight, days to 50% silking and days to 50% tasseling and with the results of Raghu et al. (2011), Rajitha (2013) and Kumar et al. (2014) for cob length and plant height and in accordance with the findings of Jawaharlal et al. (2011) and Rajitha (2013) for the character kernel rows per cob.
The trait protein content showed negative significant association with grain yield per plant while the trait days to maturity showed negative non-significant association with grain yield per plant (Table 1). Similar results were earlier reported by Parimala et al. (2011) for protein content and Kumar et al. (2011b) and Rajitha (2013) for days to maturity.
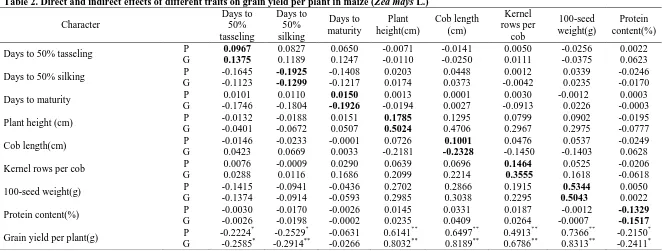
Path coefficient analysis is done in order to study the direct and indirect effects of individual component characters on the dependant variable, grain yield per plant. Study of path coefficients enables breeder to concentrate on the variable which shows high direct effect on grain yield per plant. Ultimately we can reduce time in looking for more number of component traits by restricting selection to one or few important traits (Dewey and Lu, 1959). Path analysis revealed that 100-seed weight, plant height and kernel rows per cob showed true relationship by establishing significant positive association and positive direct effect on grain yield per plant (Table 2). 100-seed weight exhibited high positive direct effect coupled with significant positive correlation at both phenotypic and genotypic levels on grain yield per plant. Similar results of positive direct effect on grain yield per plant at both phenotypic and genotypic levels were reported by Raghu et al. (2011), Rajitha (2013), Reddy et al. (2013) and Kumar et al. (2014). As the direct effect of 100-seed weight on grain yield per plant at both genotypic and phenotypic level accounted for the major portion in the total correlation between them, direct selection on 100-seed weight will be rewarding in improving grain yield per plant.
The trait, plant height showed significant positive correlation on grain yield per plant at both phenotypic and genotypic levels coupled with positive direct effect at both phenotypic and genotypic levels. Similar results of positive direct effect of plant height on grain yield per plant were reported by Parimala et al. (2011), Kumar et al. (2011a), Raghu et al. (2011), Reddy et al. (2013) and Kumar et al. (2014) at both phenotypic and genotypic levels. This trait also recorded positive indirect effects on grain yield per plant via 100-seed weight, kernel
rows per cob, protein content and days to 50% silking. Hence, these traits along with plant height should be considered simultaneously for improving the grain yield per plant.
Kernel rows per cob also had positive direct effect and significant positive association with grain yield per plant at both phenotypic and genotypic levels. Similar results of positive direct effect of kernel rows per cob were reported by Reddy et al. (2013) at genotypic level and Raghu et al. (2011) and Rajitha (2013) at both phenotypic and genotypic levels. The positive indirect effects of this trait via plant height, 100-seed weight and protein content also contributed to the total correlation on grain yield per plant. This indicate that, direct selection on kernel rows per cob along with the other three indirect causal factors via plant height, 100-seed weight and protein content will be effective in selection.
The trait, days to 50% tasseling recorded positive direct effects and significant negative association with grain yield per plant at both phenotypic and genotypic levels. Similar result of positive direct effects on grain yield per plant was reported by Kumar et al. (2011a) and Reddy et al. (2013). Since, the direct effects are positive and the correlation coefficients are significantly negative, the indirect causal factors which are having positive effects viz., cob length and kernel rows per cob along with days to 50% tasseling are to be considered simultaneously during selection.
The trait, cob length exhibited positive direct effect coupled with significant positive correlation at phenotypic level and negative direct effect coupled with significant positive correlation at genotypic level. Here the contribution of high positive indirect effects nullified the negative direct effect at genotypic level. In such situations, the above mentioned high positive indirect causal factors are to be considered during selection process. These results were in conformity with the findings of Parimala et al. (2011), Rajitha (2013), Reddy et al. (2013) and Kumar et al. (2014) at phenotypic level and Raghu et al. (2011) at genotypic level.
ISSN 0975-928X
grain yield per plant may be considered during the process of selection.
Days to 50% silking showed negative direct effect coupled with negative association with grain yield per plant at both phenotypic and genotypic levels. Similar results were reported by Kumar and Kumar (2000) and Rajitha (2013) at both genotypic andphenotypic levels. Since both direct effects as well as correlation coefficients are negative both at phenotypic and genotypic levels, the casual factors which had positive indirect effects on grain yield per plant may be considered during the process of selection.
At both levels protein content showed negative significant association and negative direct effects on grain yield per plant. These results were in accordance with Parimala et al. (2011) and Kumar et al. (2011a) at both phenotypic and genotypic levels. Since both direct effects as well as correlation coefficients are negative both at phenotypic and genotypic levels, the casual factors which had positive indirect effects on grain yield per plant may be considered during the process of selection.
In plant breeding, it is very difficult to have complete knowledge of all component traits of yield. The residual effect permits precise explanation about the pattern of interaction of other possible components of yield. In other words, residual effect measures the role of the possible independent variables which were not included in the study on the dependent variable. In the present study, the residual effect at phenotypic level is 0.3703 indicating that the characters included in present investigation are contributing more than 62 per cent of variability pertaining the dependent variable i.e., yield. Considering the nature and magnitude of character association and their direct and indirect effects, it can be inferred that improvement of grain yield per plant is possible through simultaneous manifestation of 100-seed weight, plant height and kernel rows per cob.
References
Dewey, D. and Lu, K.H. 1959. A correlation and path coefficient analysis of components of crested wheat grass seed production. Agron. J., 51: 515-518.
Falconer, D.S. 1964. An Introduction to Quantitative Genetics. Oliver and Boyd Publishing Co. Pvt. Ltd., Edinburgh. p. 312-324.
Jawaharlal, J., Reddy, G.L. and Kumar, R.S. 2011. Genetic variability and character association studies in maize. Agrl.Sci. Digest,. 31(3): 173-177.
Kumar, J.A., Krishna, K.M., Radhika, K. and Kumar, R.S. 2011a. Character association and path coefficient analysis in baby corn (Zea mays L.). The Andhra Agric. J. 58 (3): 291-295.
Kumar, M.V.N and Kumar, S.S. 2000. Studies on character association and path coefficients for grain yield and oil content in maize (Zea mays L.). Annals of Agric. Res., 21 (1): 73-78.
Kumar, P.G., Prashanth, Y., Reddy, N.V., Kumar, S.S. and Rao, V.P. 2014. Character association and path coefficient analysis in maize (Zea mays L.). Internat. J. Appl. Biol. and Pharmaceutical Technol., 5 (1): 257-260.
Kumar, T.S., Reddy, D.M., Reddy, K.H. and Sudhakar, P. 2011b. Targeting of traits through assessment of interrelationship and path analysis between yield and yield components for grain yield improvement in single cross hybrids of maize (Zea mays L.).
Internat. J. Appl. Biol. and Pharmaceutical Technol., 2 (3): 123-129.
Parimala, K., Raghu B. and Reddy, A. V. 2011. Correlation and path analysis for yield and quality traits in maize (Zea mays L.). Plant Arch., 11 (2): 1045-1047. Raghu, B., Suresh, J., Kumar, S.S. and Saidaiah, P. 2011.
Character association and path analysis in maize (Zea mays L.). Madras Agric. J., 98 (1-3): 7-9. Rajitha, A. 2013. Combining ability and gene action in maize
(Zea mays L.). M.Sc. (Ag) Thesis. Acharya N G Ranga Agricultural University, Hyderabad, India. Reddy, V.R., Jabeen, F., Sudarshan, M.R. and Rao, A.S. 2013.
Studies on genetic variability, heritability, correlation and path analysis in maize (Zea mays L.) over locations. Internat. J. Appl. Biol. and Pharmaceutical Technol., 4 (1): 195-199.
Wright, S. 1921. Correlation and causation. J. Agric. Res.,
ISSN 0975-928X
Table 1. Phenotypic and genotypic correlations among yield and yield contributing characters in maize (Zea mays L.)
Character Correlation Days to 50% silking
Days to maturity
Plant height (cm)
Cob length (cm)
Kernel rows per cob
100-seed weight
(g)
Protein content
(%)
Grain yield per plant(g)
Days to 50% tasseling
G P
0.8650** 0.8545**
0.9068** 0.6716**
-0.0798 -0.0738
-0.1816 -0.1455
0.0810 0.0519
-0.2725* -0.2648*
0.0170 0.0230
-0.2585* -0.2224* Days to 50%
silking
G P
0.9371** 0.7318**
-0.1337 -0.1054
-0.2872* -0.2328*
0.0326 -0.0062
-0.1813 -0.1760
0.1307 0.1279
-0.2914** -0.2529* Days to
maturity
G P
0.1009 0.0846
-0.0141 -0.0005
0.4742** 0.1978
-0.1176 -0.0816
0.0016 0.0196
-0.0266 -0.0631 Plant height
(cm)
G P
0.9366** 0.7257**
0.5906** 0.4365**
0.5921** 0.5055**
-0.1546 -0.1092
0.8032** 0.6141** Cob length
(cm)
G P
0.6229** 0.4755**
0.6024** 0.5362**
-0.2697* -0.2492*
0.8189** 0.6497** Kernel rows
per cob
G P
0.4552** 0.3583**
-0.1738 -0.1407
0.6786** 0.4913** 100-seed
weight (g)
G P
0.0043 0.0094
0.8313** 0.7366** Protein
content (%)
G P
-0.2411* -0.2150*
ISSN 0975-928X
Table 2. Direct and indirect effects of different traits on grain yield per plant in maize (Zea mays L.)
Character Days to 50% tasseling Days to 50% silking Days to maturity Plant height(cm) Cob length (cm) Kernel rows per cob 100-seed weight(g) Protein content(%)
Days to 50% tasseling P
G 0.0967 0.1375 0.0827 0.1189 0.0650 0.1247 -0.0071 -0.0110 -0.0141 -0.0250 0.0050 0.0111 -0.0256 -0.0375 0.0022 0.0623
Days to 50% silking P
G -0.1645 -0.1123 -0.1925 -0.1299 -0.1408 -0.1217 0.0203 0.0174 0.0448 0.0373 0.0012 -0.0042 0.0339 0.0235 -0.0246 -0.0170
Days to maturity P
G 0.0101 -0.1746 0.0110 -0.1804 0.0150 -0.1926 0.0013 -0.0194 0.0001 0.0027 0.0030 -0.0913 -0.0012 0.0226 0.0003 -0.0003
Plant height (cm) P
G -0.0132 -0.0401 -0.0188 -0.0672 0.0151 0.0507 0.1785 0.5024 0.1295 0.4706 0.0799 0.2967 0.0902 0.2975 -0.0195 -0.0777
Cob length(cm) P
G -0.0146 0.0423 -0.0233 0.0669 -0.0001 0.0033 0.0726 -0.2181 0.1001 -0.2328 0.0476 -0.1450 0.0537 -0.1403 -0.0249 0.0628
Kernel rows per cob P
G 0.0076 0.0288 -0.0009 0.0116 0.0290 0.1686 0.0639 0.2099 0.0696 0.2214 0.1464 0.3555 0.0525 0.1618 -0.0206 -0.0618
100-seed weight(g) P
G -0.1415 -0.1374 -0.0941 -0.0914 -0.0436 -0.0593 0.2702 0.2985 0.2866 0.3038 0.1915 0.2295 0.5344 0.5043 0.0050 0.0022
Protein content(%) P
G -0.0030 -0.0026 -0.0170 -0.0198 -0.0026 -0.0002 0.0145 0.0235 0.0331 0.0409 0.0187 0.0264 -0.0012 -0.0007 -0.1329 -0.1517
Grain yield per plant(g) P
G -0.2224* -0.2585* -0.2529* -0.2914** -0.0631 -0.0266 0.6141** 0.8032** 0.6497** 0.8189** 0.4913** 0.6786** 0.7366** 0.8313** -0.2150* -0.2411*
* Significant at 5% level P: at phenotypic level ** Significant at 1% level G: at genotypic level Diagonal values indicate direct effects