Please cite this article as: M. Hajiaghaei-Keshteli, K. S. Abdallah, A. M. Fathollahi-Fard, A. M., A Collaborative Stochastic Closed-loop Supply Chain Network Design for Tire Industry, International Journal of Engineering (IJE), IJE TRANSACTIONS A: Basics Vol. 31, No. 10, (October 2018) 1715-1722
International Journal of Engineering
J o u r n a l H o m e p a g e : w w w . i j e . i rA Collaborative Stochastic Closed-loop Supply Chain Network Design for Tire
Industry
M. Hajiaghaei-Keshteli*a, K. S. Abdallahb, A. M. Fathollahi-Farda
a Department of Industrial Engineering, University of Science and Technology of Mazandaran, Behshahr, Iran
b Department of Supply Chain Management, College of International Transport and Logistics, Arab Academy for Science and Technology, Cairo, Egypt
P A P E R I N F O
Paper history:
Received 23 December 2017
Received in revised form 12 January 2018 Accepted 15 Febuary 2018
Keywords:
Stochastic Programming Closed-loop Supply Chain Tire Industry
Genetic Algorithm Particle Swarm Optimization
A B S T R A C T
Recent papers in the concept of Supply Chain Network Design (SCND) have seen a rapid development in applying the stochastic models to get closer to real-world applications. Regaring the special characteristics of each product, the stracture of SCND varies. In tire industry, the recycling and remanufacturing of scraped tires lead to design a closed-loop supply chain. This paper proposes a two-stage stochastic model for a closed-loop SCND in the application of tire industry. The first two-stage of model optimizes the expected total cost. Then, financial risk has been considered as the second stage of model to control the uncertainty variables leading to a robust solution. To solve the developed problem, Particle Swarm Optimization (PSO) and Genetic Algorithm (GA) have been used. To enhace the efficiency of metaheuristic algorithms, Response Surface Method (RSM) has been applied. Finally, the proposed model is evaluated by different test problem with different complexity and a set of metrics in terms of Pareto optimal solutions.
doi: 10.5829/ije.2018.31.10a.14
1. INTRODUCTION1
One of the important products for humans is car and its tires. According to the published reports by Amin et al., [1], each family in United States has three cars and each car approximately goes through two or three sets of tires per year. In this regard, perhaps thirty tires are used per each family in three years. Each tire maybe rotated every 10K kilometers (km) then disposed after 40-60K km [2]. By another point of view, recent reports indicate that approximately 290 million scraped tires are disposed of every year and almost 20% of them (about 55 million tires) are illegally dumped. On the other hand, world demand for tires is projected to rise 4.1 percent per year to 3.0 billion units in 2019 [1].
According to the scientific directions in this research zone, Supply Chain (SC) can be defined and illustrated as the activities of facilities to provide the materials, to manufacture the products, to transform between
*Corresponding Author Email: [email protected] (M. Hajiaghaei-Keshteli)
different parties, and to distribute the final products among users [3]. In addition, managers of SC recently focused on consumed products in an attempt to generate more profit by recovering, remanufacturing or recycling products in the backward echelon’s levels [4, 5]. In this regard, Supply Chain Management (SCM) guides the proper approach to manage all parts in these business functions [6].
propose an optimization model for truck tire remanufacturing process. Subulan et al. [2] present a case study in Turkey to investigate the tire remanufacturing process. Recently, Amin et al. [1] develop an optimization model for closed-loop tire SC in Toronto, Canada.
Closed-Loop Supply Chain (CLSC) has been appealing for researchers in the last decade [14, 15]. This type of SC network considers the reverse and forward SC in an integrated manner [16]. Furthermore, different configurations and structures of SCs of different products are considered totally distinct SCs (i.e., they are different for different products) [17]. Kannan et al. [18] propose a CLSC for two types of products: Tires and plastics. They used Genetic Algorithm (GA) and Particle Swarm Optimization (PSO) to solve them. They only considered the flow of products between different levels of CLSC as well as the location and allocation decisions. Their model also was deterministic and a type of Mixed Integer Linear Programming (MINLP) formulation. In this regard, according to the operational and tactical decisions of CLSC, an efficient solution is so important. Metaheuristics are a type of stochastic optimization in nature which gives an optimal solution in a reasonable time. In this regard, several new and recent meta-heuristics are also used in this area. For instance, Devika et al. [19] propose six hybridized meta-heuristics based on the Imperialist Competitive Algorithm (ICA) to tackle their proposed CLSC problem in glass industry. They also considered the impact of technology selection for the model. Mirakhorli [20] proposes a GA heuristic-based algorithm to optimize bread production. They optimized the transportation time as well as the total cost in their model. In another similar study, Subulan et al. [21] investigate the application of CLSC on battery production using an exact solution algorithm for tactical decisions in the model. They also recommended the use of metaheuristics for large sizes for their developed problem. Additionally, Fathollahi Fard et al. [7] proposed a two-stage stochastic programming model for CLSC in glass industry. To solve their problem, ICA, PSO and GA were used. In a recent study, Fathollahi Fard and Hajiagahei-Keshteli [22] propose a tri-level decision-making model to design a forward/reverse supply chain of glass industry. They use Water Wave Optimization (WWO) and Keshtel Algorithm (KA) in a nested approach.
The proposed optimization model consists of two objective functions: expected total cost and financial risk. In order to address the problem two powerful meta-heuristics are used in this paper: Particle Swarm Optimization (PSO) [23] and Genetic Algorithm (GA) [24]. The parameters used in PSO and GA are tuned by Response Surface Method (RSM). While Fathollahi
Fard et al. [7] proposed a two-stage stochastic programming model for glass industry. In this research, a new two-stage stochastic model is developed for the tire industry closed-loop supply chain network design problem.
The rest of the paper is organized as follows: In Section 2, the problem is described and formulated in a two-stage stochastic programming model. In Section 3, the encoding scheme is introduced. Computational results are investigated in Section 4. Finally, discussion and suggestions for the future works are discussed in Section 5.
2. PROBLEM DESCRIPTION
Usually, the recovery activities in tires consist of reusing, remanufacturing and recycling. As shown in Figure 1, the proposed Closed-Loop Supply Chain
(CLSC) network for tire manufacturing and
remanufacturing is presented. In a nutshell, suppliers provide raw materials for manufacturers. The manufacturers sell the tires to the retailers in large quantities. Then, customers purchase their demands from retailers. Only a fraction of used tires from customers will be collected by drop-off depots. The collected tires are divided into two categories. Some of them needs to retreading or remanufacturing return to manufacturers. It should be noted, the collected tires have a lower price than raw materials from suppliers as well as they need some minor process to produce as a new product from manufacturers. Consequently, the rest of collected tiers should be recycled and be sell to suppliers with lower prices.
The proposed optimization model is based on the following assumptions:
The demand of each customer must be met.
Figure 1. The graphical structure of proposed tire CLSC [1]
Each customer can be assigned to only one of retailers in the forward flows and drop-off depots in the reverse flows.
The number of facilities in echelons is predefined.
No flow exists between the same facilities.
The transportation and fixed costs are known and fixed. The other parameters such as demand and the rate of returned tires are under uncertainty and defined by a set of scenarios.
All members of the SC have capacity constraints.
The number of returned tires of a certain tire type to drop-off depots is considered by a fraction of the customer’s demand of that respective tire type as originally proposed in literature [1].
We define the indexes, parameters and decision variables in Tables 1, 2 and 3, respectively.
TABLE 1. List of Indexes
Indexes Description
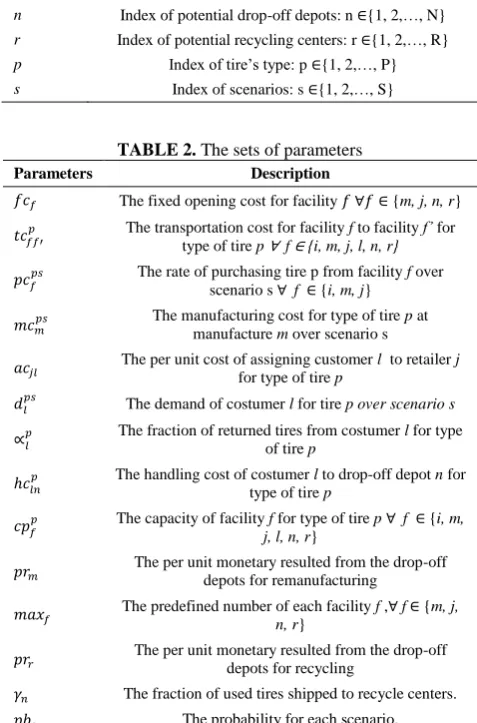
i Index of suppliers: i∈{1, 2,…, I} m Index of potential manufactures: m ∈{1 ,2,…, M} j Index of potential retailers: j ∈{1, 2,…, J} l Index of customer zones: l ∈{1, 2,…, L} n Index of potential drop-off depots: n ∈{1, 2,…, N} r Index of potential recycling centers: r ∈{1, 2,…, R} p Index of tire’s type: p ∈{1, 2,…, P} s Index of scenarios: s ∈{1, 2,…, S}
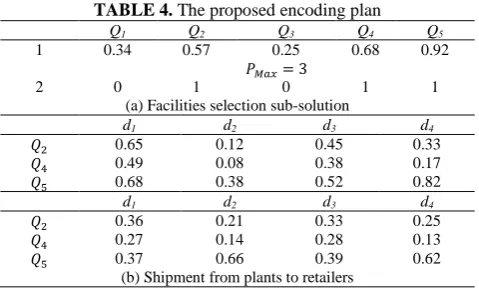
TABLE 2. The sets of parameters
Parameters Description
𝑓𝑐𝑓 The fixed opening cost for facility 𝑓 ∀𝑓 ∈ {m, j, n, r}
𝑡𝑐𝑓𝑓′
𝑝 The transportation cost for facility f to facility f’ for type of tire p ∀ f ∈ {i, m, j, l, n, r}
𝑝𝑐𝑓
𝑝𝑠 The rate of purchasing tire p from facility f over scenario s ∀ f ∈ {i, m, j}
𝑚𝑐𝑚
𝑝𝑠 The manufacturing cost for type of tire p at manufacture m over scenario s
𝑎𝑐𝑗𝑙 The per unit cost of assigning customer for type of tire p l to retailer j
𝑑𝑙𝑝𝑠 The demand of costumer l for tire p over scenario s
∝𝑙
𝑝 The fraction of returned tires from costumer l for type of tire p
ℎ𝑐𝑙𝑛
𝑝 The handling cost of costumer l to drop-off depot n for type of tire p
𝑐𝑝𝑓
𝑝 The capacity of facility f for type of tire p ∀ f ∈ {i, m, j, l, n, r}
𝑝𝑟𝑚 The per unit monetary resulted from the drop-off depots for remanufacturing
𝑚𝑎𝑥𝑓 The predefined number of each facility f ,∀ f ∈ {m, j, n, r}
𝑝𝑟𝑟 The per unit monetary resulted from the drop-off depots for recycling
𝛾𝑛 The fraction of used tires shipped to recycle centers. 𝑝𝑏𝑠 The probability for each scenario.
TABLE 3. The sets of variables
Variables Description
𝑋𝑓𝑓′
𝑝𝑠 Number of products that flow from facility f to facility f’ for type of tire p over scenario s ∀ f ∈{i, m, j, l, n, r}
𝑍𝑓𝑓𝑝𝑠′ 1 if facility f is assigned to facility f’ over the type of tire p over scenario s, 0 otherwise∀ f ∈ {i, m, j, l, n, r}
𝑌𝑓 1 if facility f is to be established, 0 otherwise
𝑉𝑠𝜑 The amount of expected financial risk for each scenario
𝐸(𝐶𝑜𝑠𝑡) = ∑ 𝑓𝑐𝑓 𝑓𝑌𝑓+ ∑ 𝑝𝑏𝑠 𝑠(∑ ∑ ∑ 𝑡𝑐𝑓 𝑓′ 𝑝 𝑓𝑓𝑝′𝑋𝑓𝑓𝑝𝑠′+ ∑ ∑ ∑ (𝑝𝑐𝑖 𝑚 𝑝 𝑖𝑝𝑠+ 𝑚𝑐𝑚𝑝𝑠)𝑋𝑖𝑚
𝑝𝑠
+ ∑ ∑ ∑ (𝑝𝑐𝑗 𝑙 𝑝 𝑗𝑝𝑠+ 𝑎𝑐𝑗𝑙)𝑑𝑙
𝑝𝑠
𝑍𝑗𝑙𝑝𝑠+ ∑ ∑ ∑ ℎ𝑐𝑙 𝑛 𝑝 𝑙𝑛𝑝 ∝𝑙 𝑝𝑠
𝑑𝑙𝑝𝑠𝑍𝑙𝑛𝑝𝑠− 𝑝𝑟𝑚(∑ ∑ ∑ (1 − 𝛾𝑛)𝑋𝑙𝑛
𝑝𝑠 𝑝
𝑑
𝑐 ) − 𝑝𝑟𝑟(∑ ∑ ∑ 𝛾𝑛𝑋𝑙𝑛
𝑝𝑠 ) 𝑝 𝑚
𝑢 )
(1)
In the objective function, the first term is the fixed cost of opening facilities. The remaining is multiplied by the corresponding probability of its scenario. The second represents the transportation cost between facilities. The third term represents the purchasing and manufacturing costs for the manufacturers. The fourth term represents the purchasing cost from retailers and the costs associated with assigning a retailer to a costumer. The fifth term is the cost associated with assigning costumers to drop-off depots to collect used tires in the Reverse Logistic (RL) represented as handling cost multiplied by the fraction of demand that is going to be reused. The sixth and seventh terms represent the saving resulting from the remanufacturing and recycling of used tires. These terms specify the profit of RL network in our model.
𝑀𝑖𝑛 𝐷𝑅𝑖𝑠𝑘𝜑= ∑ 𝑝𝑏𝑠 𝑠𝑉𝑠𝜑 (2)
Risk management is needed to be considered as an important issue when proposing a scenario-based stochastic programming model to control and to manage the risk associated with unfavourable scenarios. In this regard, the second objective function is to minimize the downside risk of the model by considering the probability of scenario s and its profitability according to the following constraint:
𝑉𝑠𝜑≥ 𝐶𝑜𝑠𝑡𝑠− 𝜑 , ∀ s (3)
The above equation lets decision maker evaluate each scenario to consider its efficiency to find a robust solution. In addition, the following constraints specify tire flow between different facilities and costumers as shown in Figure 1.
∑ 𝑋𝑖 𝑖𝑚𝑝𝑠= ∑ 𝑋𝑚 𝑚𝑗𝑝𝑠 ∀ p, m, j, s, l (4)
∑ 𝑋𝑙 𝑙𝑛𝑝𝑠= ∑ 𝑋𝑛 𝑛𝑟𝑝𝑠+ ∑ 𝑋𝑛 𝑛𝑚𝑝𝑠 ∀ n, r, s, m (5)
∑ 𝑋𝑗 𝑗𝑙𝑝𝑠= ∑ 𝑑𝑙 𝑝 𝑗 𝑍𝑗𝑙
𝑝𝑠
∑ 𝑋𝑛 𝑙𝑛𝑝𝑠= ∑ ∝𝑙 𝑙𝑝𝑑𝑝𝑙𝑍𝑛𝑙𝑠 ∀l, n, p, s (7)
∑ 𝑋𝑟 𝑛𝑚𝑝𝑠 = (1 − 𝛾𝑛) ∑ 𝑋𝑙𝑛 𝑝𝑠
𝑛 ∀n, l, p, s (8)
In addition, each costumer should be assigned to only one retailer as well as one drop-off depots in the RL as a real assumption considered in the related studies e.g. [1]; [19] as follows:
∑ 𝑍𝑗 𝑗𝑙𝑝𝑠= ∑ 𝑍𝑛 𝑙𝑛𝑝𝑠= 1 ∀ l, p f∈ {j, m, s} (9)
The predefined amount of suppliers as illustrated in Equation (10) limits the capacity of facilities. In addition, the flow of products through a facility is only allowed if the respective facility is open and has enough capacity as formulated by Equations (11)-(14) for manufacturers, retailers, drop-off depots and recycling centers, respectively:
∑ 𝑋𝑚 𝑖𝑚𝑝𝑠≤ 𝑐𝑝𝑖 𝑝 ∀
i, p, s (10)
∑ 𝑋𝑗 𝑚𝑗𝑝𝑠 ≤ 𝑐𝑝𝑚𝑝𝑌𝑚 ∀m, p, s (11)
∑ 𝑋𝑙 𝑗𝑙𝑝𝑠≤ 𝑐𝑝𝑗 𝑝𝑌
𝑗 ∀j, p, s (12)
∑ 𝑋𝑙𝑛𝑃
𝑙 ≤ 𝑐𝑝𝑛𝑝𝑌𝑛 ∀n, p, s (13)
∑ 𝑋𝑛𝑟𝑃
𝑛 ≤ 𝑐𝑝𝑟𝑝𝑌𝑟 ∀r, p, s (14)
Furthermore, the number of facilities in each echelon is limited by a predefined maximum budget.
∑ 𝑌𝑓 𝑓≤ 𝑚𝑎𝑥𝑓 f ∈ {m, j, n, r} (15)
The binary and continuous variables for the first stage of model are as follows.
𝑌𝑓, 𝑍𝑓𝑓′
𝑝𝑠 ∈ {0,1}
(16)
𝑋𝑓𝑓′𝑝𝑠 ≥ 0, 𝑉𝑠𝜑≥ 0 (17)
3. SOLUTION APPROACH
This study uses two famous metaheuristics to solve the proposed NP-hard two-stage stochastic model. Since the algoritms are well-known and only adopted by this study, we refer the readers to go through literature [25-27]. In the following subsection, the encoding scheme used in the proposed solution procedures is detailed. 3.1. Encoding Scheme Whenever a metaheuristic procedure is used, coding and decoding the solution of mathematical problem is required [26]. This paper utilizes a two-stage technique called Random-Key (RK) to solve the developed discrete problem. Researchers have used this technique repeatedly during last two decades [28, 29]. This technique helps the users to use
any continuous and binary metaheuristics to solve a mathematical formulation model with various variables and constraints [22]. The illustration of encoding sub-solutions is shown in Table 4. First, a matrix with size |q| elements that are uniformly distributed over 0 to 1 is constructed (Table 4 (a)). This sub-solution is transformed into binary variables indexation the selection of manufacturers and retailers (Q2, Q4, and Q5 in the given example). Eventually after the algorithm runs, Table 4 (b) determines the flow of products. In the other words, a random matrix is formed with number of rows equals the number of non zero element obtained (3 in the given example) and number of columns equal to destination facilities (4 in the given example). The columns of the second matrix are then normalized to specify how retailers and other facilities distribute their supply.
4. COMPUTATIONAL EXPERIMENTS
In this section, the test problems are first introduced followed by tuning the algorithms’ parameters using the Response Surface Method (RSM). Then, the evaluation metrics are investigated. Finally, the performance of both of the proposed algorithms is evaluated.
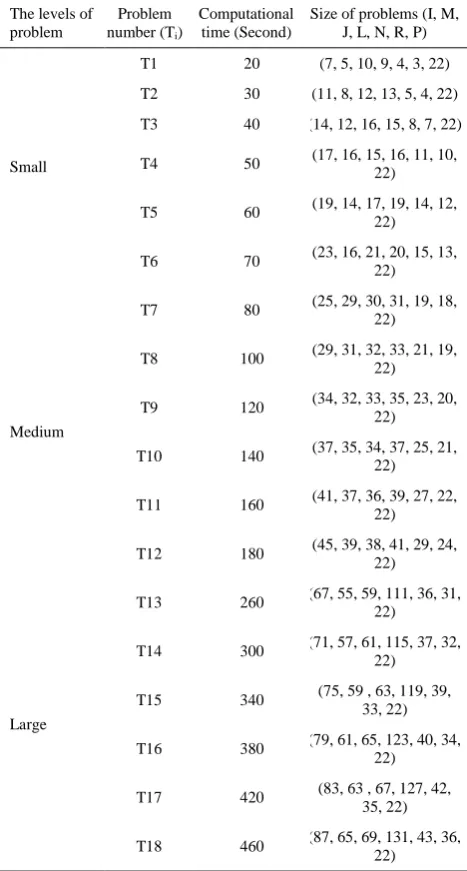
4. 1. Instances In this section, 18 random test problems divided into three levels (i.e., small, medium and large sizes) were examined as shown in Table 5. It should be noted that the number of scenario in all test problems is equal to 10. The computational time is limited for both algorithms according to the size of problems.
4. 2. Parameter Setting To evaluate the performance of any metaheuristic, the model parameters should be optimized [28]. It is necessary to tune the parameters to balance between the two phases of metaheuristics. In this paper, RSM introduced by Box and Wilson is utilized [19]. The factors, their levels, and the number of experiments are shown in Table 6.
TABLE 4. The proposed encoding plan
Q1 Q2 Q3 Q4 Q5
1 0.34 0.57 0.25 0.68 0.92
𝑃𝑀𝑎𝑥= 3
2 0 1 0 1 1
(a) Facilities selection sub-solution
d1 d2 d3 d4
𝑄2 0.65 0.12 0.45 0.33
𝑄4 0.49 0.08 0.38 0.17
𝑄5 0.68 0.38 0.52 0.82
d1 d2 d3 d4
𝑄2 0.36 0.21 0.33 0.25
𝑄4 0.27 0.14 0.28 0.13
𝑄5 0.37 0.66 0.39 0.62
TABLE 5. Design of test problem size
The levels of problem
Problem number (Ti)
Computational time (Second)
Size of problems (I, M, J, L, N, R, P)
Small
T1 20 (7, 5, 10, 9, 4, 3, 22)
T2 30 (11, 8, 12, 13, 5, 4, 22)
T3 40 (14, 12, 16, 15, 8, 7, 22)
T4 50 (17, 16, 15, 16, 11, 10, 22)
T5 60 (19, 14, 17, 19, 14, 12, 22)
T6 70 (23, 16, 21, 20, 15, 13, 22)
Medium
T7 80 (25, 29, 30, 31, 19, 18, 22)
T8 100 (29, 31, 32, 33, 21, 19, 22)
T9 120 (34, 32, 33, 35, 23, 20, 22)
T10 140 (37, 35, 34, 37, 25, 21, 22)
T11 160 (41, 37, 36, 39, 27, 22, 22)
T12 180 (45, 39, 38, 41, 29, 24, 22)
Large
T13 260 (67, 55, 59, 111, 36, 31, 22)
T14 300 (71, 57, 61, 115, 37, 32, 22)
T15 340 (75, 59 , 63, 119, 39, 33, 22)
T16 380 (79, 61, 65, 123, 40, 34, 22)
T17 420 (83, 63 , 67, 127, 42, 35, 22)
T18 460 (87, 65, 69, 131, 43, 36, 22)
TABLE 6. Factors, levels, and number of experiments of the
two proposed algorithms
Algorithm Factors and their levels
N. of experiments; Total Number=
(nf, nax, ncp)
PSO nPop W C1 C2 30=(24, 8, 6)
(100, 200)
(0.65,
0.9) (1.2, 2) (1.2, 2)
GA nPop 𝑃𝐶 𝑃𝑀
20=(23, 6, 6)
(100, 200)
(0.5, 0.8)
(0.02, 0.1)
nPop=number of population, W=inertia weight, C1=acceleration coefficient of local optimum, C2=acceleration coefficient of global optimum , 𝑃𝐶=probability of crossover, 𝑃𝑀=probability of mutation
Consequently, the tuned values for parameters, R -squared (R2) and desirability (D), are approximated as
displayed in Table 7.
4. 3. Evaluation Metrics In order to solve the proposed problem, four metrics are presented. These metrics aim to assess the quality of the Pareto optimal solutions (Diversification Metric (DM), Spread of Non-dominance Solution (SNS), Data Envelopment Analysis (DEA) and Percentage of Domination (POD)) [7]. The higher value of these metrics the better the solution quality. The characteristics of these metrics are outlined in Table 8. These parameters are presented in recent researches [7, 19, 27, 28].
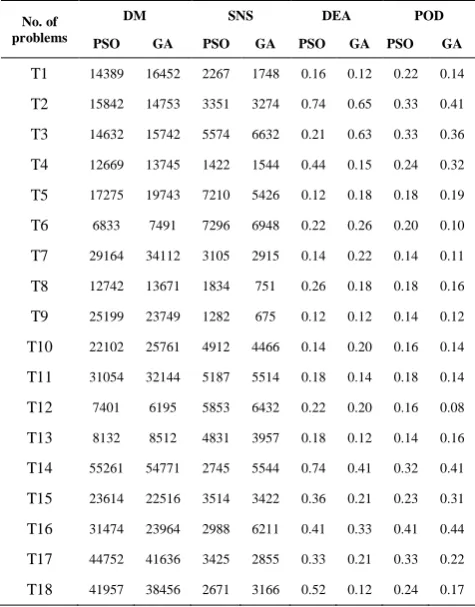
4. 4. Comparison of Metaheuristics This sub-section aims to discuss the effectiveness and efficiency of the proposed solution approaches. Each algorithm is applied on all test problems for 30 times, and the best solution is saved. Then, the proposed evaluation metrics are calculated as shown in Table 9. Furthermore, to check statistically the validation of the results, an analysis of variance (ANOVA) is performed to analyze and to evaluate the obtained results. At the first glance, the results reveal that there is a mixed statistical difference between the performance and efficiency of the both algorithms. The means plot and LSD intervals (at the 95% confidence level) for all methods are shown in Figure 2. It should be noted that for both algorithms, the results of the metrics are analyzed by Relative Percentage Deviation (RPD). Lower RPD values mean better capability.
According to Figure 2, based on DM metric, GA has a slightly better performance, in comparison of PSO. In SNS metric, the behaviour both algorithms are analogous.
TABLE 7. Optimized values of algorithms parameters and
Desirability (D)
Algorithm Tuned parameters D
PSO nPop=133, W=0.73, C1=1.46, C2=1.46 0.6823
GA nPop=168; 𝑃𝐶=0.75; 𝑃𝑀=0.05 0.6523
TABLE 8. Metrics used to measure the quality of Pareto front
Metrics Definition
Diversification Metric (DM)
Measures the spread of non-dominated solution set.
Spread of Non-dominated
Solution (SNS) Measures the diversity of solutions.
Percentage of Domination (POD)
Measures the ability of an algorithm to dominate the solutions of other
algorithms
Data Envelopment
TABLE 9. The evaluation metrics to algorithms performance (DM, SNS, DEA and POD) for test problems
No. of problems
DM SNS DEA POD
PSO GA PSO GA PSO GA PSO GA
T1 14389 16452 2267 1748 0.16 0.12 0.22 0.14 T2 15842 14753 3351 3274 0.74 0.65 0.33 0.41 T3 14632 15742 5574 6632 0.21 0.63 0.33 0.36 T4 12669 13745 1422 1544 0.44 0.15 0.24 0.32 T5 17275 19743 7210 5426 0.12 0.18 0.18 0.19 T6 6833 7491 7296 6948 0.22 0.26 0.20 0.10 T7 29164 34112 3105 2915 0.14 0.22 0.14 0.11 T8 12742 13671 1834 751 0.26 0.18 0.18 0.16 T9 25199 23749 1282 675 0.12 0.12 0.14 0.12 T10 22102 25761 4912 4466 0.14 0.20 0.16 0.14 T11 31054 32144 5187 5514 0.18 0.14 0.18 0.14 T12 7401 6195 5853 6432 0.22 0.20 0.16 0.08 T13 8132 8512 4831 3957 0.18 0.12 0.14 0.16 T14 55261 54771 2745 5544 0.74 0.41 0.32 0.41 T15 23614 22516 3514 3422 0.36 0.21 0.23 0.31 T16 31474 23964 2988 6211 0.41 0.33 0.41 0.44 T17 44752 41636 3425 2855 0.33 0.21 0.33 0.22 T18 41957 38456 2671 3166 0.52 0.12 0.24 0.17
However, PSO is better than GA. Additionally, for both DEA and POD metrics, PSO is strongly better than GA and shows a mixed performance.
5. CONCLUSION AND FUTURE STUDIES
In this paper, a new two-stage stochastic programming for the tire industry closed-loop supply chain model is developed. The model is different from other similar papers in the literature by considering the financial risks. In the proposed model, a special network for tire production is proposed. Two metaheuristics i.e. GA and PSO are utilized to address the problem. Four assessment metrics are proposed to evaluate the performance of the algorithms under different criteria to study the structure of the Pareto optimal solutions. Finally, results showed that PSO is slightly better than GA in comparisons. Also, the present model shows the importance of collecting and recycling of scraped tires to consider a performance decisions for consumers and manufacturers.
For the future works, more comprehensive analyses on the proposed model can be suggested. In addition, other assessment parameters could be implemented to analyze the performance of algorithms. Moreover, some
real cases may be used to present the model more efficiently. Regarding the application side, more real life constraint should be added on the proposed model increasing the complexity of the problem, such as: vehicle routing operations to reduce the transportation cost or sustainable considerations.
Figure 2. The interval plot for four proposed metrics
GA PSO
0.08 0.07 0.06 0.05 0.04 0.03 0.02 0.01 0.00
D
M
Interval Plot of PSO; GA
95% CI for the Mean
GA PSO
0.20
0.15
0.10
0.05
0.00
S
N
S
Interval Plot of PSO; GA
95% CI for the Mean
GA PSO
0.4
0.3
0.2
0.1
0.0
D
EA
Interval Plot of PSO; GA
95% CI for the Mean
GA PSO
0.25
0.20
0.15 0.10
0.05 0.00
P
O
D
Interval Plot of PSO; GA
6. REFERENCES
1. Amin, S.H., Zhang, G. and Akhtar, P., "Effects of uncertainty on a tire closed-loop supply chain network", Expert Systems with Applications, Vol. 73, (2017), 82-91.
2. Subulan, K., Taşan, A.S. and Baykasoğlu, A., "Designing an environmentally conscious tire closed-loop supply chain network with multiple recovery options using interactive fuzzy goal programming", Applied Mathematical Modelling, Vol. 39, No. 9, (2015), 2661-2702.
3. Chopra, S., "Designing the distribution network in a supply chain", Transportation Research Part E: Logistics and Transportation Review, Vol. 39, No. 2, (2003), 123-140. 4. Fathollahi-Fard, A.M. and Hajiaghaei-Keshteli, M., "A
stochastic multi-objective model for a closed-loop supply chain with environmental considerations", Applied Soft Computing, Vol. 69, (2018), 232-249.
5. Hajiaghaei-Keshteli, M., Sajadifar, S.M. and Haji, R., "Determination of the economical policy of a three-echelon inventory system with (r, q) ordering policy and information sharing", The International Journal of Advanced Manufacturing Technology, Vol. 55, No. 5-8, (2011), 831-841. 6. Nourmohamadi Shalke, P., Paydar, M.M. and Hajiaghaei-Keshteli, M., "Sustainable supplier selection and order allocation through quantity discounts", International Journal of Management Science and Engineering Management, Vol. 13, No. 1, (2018), 20-32.
7. Fard, A.M.F., Gholian-Jouybari, F., Paydar, M.M. and Hajiaghaei-Keshteli, M., "A bi-objective stochastic closed-loop supply chain network design problem considering downside risk", Industrial Engineering & Management Systems, Vol. 16, No. 3, (2017), 342-362.
8. Nasiri, E., Afshari, A. and Hajiaghaei-Keshteli, M., "Addressing the freight consolidation and containerization problem by recent and hybridized meta-heuristic algorithms", International Journal of Engineering-Transactions C: Aspects, Vol. 30, No. 3, (2017), 403-410.
9. Farahani, R.Z., Rezapour, S., Drezner, T. and Fallah, S., "Competitive supply chain network design: An overview of classifications, models, solution techniques and applications",
Omega, Vol. 45, (2014), 92-118.
10. Govindan, K., Soleimani, H. and Kannan, D., "Reverse logistics and closed-loop supply chain: A comprehensive review to explore the future", European Journal of Operational Research, Vol. 240, No. 3, (2015), 603-626.
11. Chopra, S. and Meindl, P., Supply chain management. Strategy, planning & operation, in Das summa summarum des management. 2007, Springer.265-275.
12. Ferrer, G., "The economics of tire remanufacturing", Resources, Conservation and Recycling, Vol. 19, No. 4, (1997), 221-255. 13. Sasikumar, P., Kannan, G. and Haq, A.N., "A multi-echelon
reverse logistics network design for product recovery—a case of truck tire remanufacturing", The International Journal of Advanced Manufacturing Technology, Vol. 49, No. 9-12, (2010), 1223-1234.
14. Govindan, K. and Soleimani, H., "A review of reverse logistics and closed-loop supply chains: A journal of cleaner production focus", Journal of Cleaner Production, Vol. 142, (2017), 371-384.
15. Souza, G.C., "Closed‐loop supply chains: A critical review, and future research", Decision Sciences, Vol. 44, No. 1, (2013), 7-38.
16. Fathollahi-Fard, A.M., Hajiaghaei-Keshteli, M. and Tavakkoli-Moghaddam, R., "The social engineering optimizer (SEO)",
Engineering Applications of Artificial Intelligence, Vol. 72, (2018), 267-293.
17. Fard, A.M.F. and Hajiaghaei-Keshteli, M., "A bi-objective partial interdiction problem considering different defensive systems with capacity expansion of facilities under imminent attacks", Applied Soft Computing, Vol. 68, (2018), 343-359. 18. Kannan, G., Noorul Haq, A. and Devika, M., "Analysis of
closed loop supply chain using genetic algorithm and particle swarm optimisation", International Journal of Production Research, Vol. 47, No. 5, (2009), 1175-1200.
19. Devika, K., Jafarian, A. and Nourbakhsh, V., "Designing a sustainable closed-loop supply chain network based on triple bottom line approach: A comparison of metaheuristics hybridization techniques", European Journal of Operational Research, Vol. 235, No. 3, (2014), 594-615.
20. Mirakhorli, A., "Fuzzy multi-objective optimization for closed loop logistics network design in bread-producing industries",
The International Journal of Advanced Manufacturing Technology, Vol. 70, No. 1-4, (2014), 349-362.
21. Subulan, K., Baykasoğlu, A., Özsoydan, F.B., Taşan, A.S. and Selim, H., "A case-oriented approach to a lead/acid battery closed-loop supply chain network design under risk and uncertainty", Journal of Manufacturing Systems, Vol. 37, (2015), 340-361.
22. Fard, A.M.F. and Hajaghaei-Keshteli, M., "A tri-level location-allocation model for forward/reverse supply chain", Applied Soft Computing, Vol. 62, (2018), 328-346.
23. Eberhart, R. and Kennedy, J., "A new optimizer using particle swarm theory", in Micro Machine and Human Science, 1995. MHS'95., Proceedings of the Sixth International Symposium on, IEEE., (1995), 39-43.
24. Holland, J.H., "Adaptation in natural and artificial systems: An introductory analysis with applications to biology, control, and artificial intelligence, MIT press, (1992).
25. Hajiaghaei-Keshteli, M. and Fard, A.M.F., "Sustainable closed-loop supply chain network design with discount supposition",
Neural Computing and Applications, (2018), 1-35.
26. Cheraghalipour, A., Paydar, M. and Hajiaghaei-Keshteli, M., "An integrated approach for collection center selection in reverse logistics", International Journal of Engineering Transaction A Basics, Vol. 30, No. 7, (2017), 1005-1016. 27. Sadeghi-Moghaddam, S., Hajiaghaei-Keshteli, M. and
Mahmoodjanloo, M., "New approaches in metaheuristics to solve the fixed charge transportation problem in a fuzzy environment", Neural Computing and Applications, (2017), 1-21.
28. Samadi, A., Mehranfar, N., Fathollahi Fard, A. and Hajiaghaei-Keshteli, M., "Heuristic-based metaheuristics to address a sustainable supply chain network design problem", Journal of Industrial and Production Engineering, Vol. 35, No. 2, (2018), 102-117.
29. Golshahi-Roudbaneh, A., Hajiaghaei-Keshteli, M. and Paydar, M.M., "Developing a lower bound and strong heuristics for a truck scheduling problem in a cross-docking center",
A Collaborative Stochastic Closed-loop Supply Chain Network Design for Tire
Industry
M. Hajiaghaei-Keshtelia, K. S. Abdallahb, A. M. Fathollahi-Farda
a Department of Industrial Engineering, University of Science and Technology of Mazandaran, Behshahr, Iran
b Department of Supply Chain Management, College of International Transport and Logistics, Arab Academy for Science and Technology, Cairo, Egypt
P A P E R I N F O
Paper history:
Received 23 December 2017
Received in revised form 12 January 2018 Accepted 15 Febuary 2018
Keywords:
Stochastic Programming Closed-loop Supply Chain Tire Industry
Genetic Algorithm Particle Swarm Optimization
هدیکچ
یاه لدم زا هدافتسا اب هعسوت لاح رد تعرس هب نیمات هریجنز هکبش یحارط دروم رد ریخا یاه هلاقم ت
دع تح تیعطق م
اتخاس ،وردوخ خرچ دننام تلاوصحم عون هب هجوت اب .تسا یعقاو یایند یاهدربراک هب ندش کیدزن یارب جنز ر
نیمات هری
ک یم رییغت زاسزاب رد اه یتخس نیا همه و هنهک یاهریات هدافتسا زاب و اه یتخس ،ریات تعنص رد .دن رنا ی
هنیزه و یژ یاه
سب هقلح نیمات هریجنز هکبش یحارط کی نایم رد هدش هدافتسا وردوخ یاه خرچ تفایزاب هب رجنم هفاضا یم هت
نیا .دوش
مات هریجنز یارب ار یفداصت یا هلحرم ود لدم کی ،هلاقم لحرم رد .دنک یم یحارط ریات هتسب هقلح نی
لوا ه نیزه لدم ، ه
یم یزاس هنیهب ار یراظتنا رتنک هب مادقا لدم مود هلحرم رد ازجم فده عبات کی رد یلام کسیر ،سپس .دنک
تیعطق مدع ل
هنیهب متیروگلا ،هلاسم نیا لح یارب .دنک یم رادیاپ باوج کی هب ندیسر یارب یریگ میمصت یاهریغتم اس
یز رذ ماحدزا تا
هدش هتفرگ راک هب کیتنژ متیروگلا و فرگ راک هب خساپ حطس شور ،اه متیروگلا یشخبرثا شیازفا یارب .دنا
.تسا هدش هت
اوج یارب فلتخم بایزرا یاهرتماراپ و توافتم یراوشد یاه حطس اب فلتخم لئاسم اب هدش داهنشیپ لدم یاه ب
هنیهب
![Figure 1. The graphical structure of proposed tire CLSC [1]](https://thumb-us.123doks.com/thumbv2/123dok_us/25180.2002783/2.595.342.519.547.728/figure-graphical-structure-proposed-tire-clsc.webp)