Publisher: Centre of Excellence for Scientific & Research Journalism, COES&RJ LLC Online Publication Date: 1st July 2017
Online Issue: Volume 6, Number 3, July 2017 https://doi.org/10.25255/jss.2017.6.3.532.547
The Extent of Applying the Balanced Scorecard in the Jordanian
Banks, and its Effects on Performance
Dr. Lina Fuad Murwih Hussien Jerash University, Jerash, Jordan
Dr. Baker Ahmad Aledwan Dr. Omar Mohammad Zreqat
The World Islamic Science & Education University, Amman, Jordan
Abstract:
This study aimed to identify the difference between the Jordanian banks in their use and application of the Balanced Scorecard measures represented by its four dimensions, and the effect of the use and application of these dimensions on measuring the performance of the these banks, and the effect of using these measures on the real performance of these banks measured by the return on assets (ROA) and the return on equity (ROE). A questionnaire was designed for this purpose.
The results indicated that the Jordanian banks used a set of financial and non-financial performance measures which are similar and consistent with the Balanced Scorecard dimensions. The most used dimensions were the financial dimensions, followed by the internal operations dimensions, then the learning and growth dimensions, and finally the dimensions related to receipt of the service. The results shows statistically significant differences in the use of every performance measurement, and the results indicated also that the banks which highly used the previous mentioned measures achieved a higher return on assets and a higher return on equity compared to other banks.
Keywords:
Balanced Score Card, performance measurement, Jordanian banks
Citation:
Introduction
The transition of companies from the industrial competition era to the informatics competition era led to the need of owning new capabilities to ensure success in the intense competitive environment that surround most of the companies, and it has become imperative for companies to find and use new managerial methods and tools for measuring the performance in order to continue their progress and growth and to maintain their competitive advantages, and not just relying on the traditional performance measurement systems, which are unable to provide the true picture of the company in order to achieve the required development and growth (Kaplan and Atkinson, 1997, p.367).
Recently, the new strategic direction of the companies needs to provide facilities for new information in order to be used for planning, strategic decision-making and integrated strategic review which contains the internal and external factors together, and to be expanded also to include strategic information which provides the companies with the ability to survive and compete in the future (Pearce, et. al., 2003). Such a need for performance metrics (measures) helps companies to achieve their strategic goals leading to the emergence of the Balanced Scorecard, which is considered as a comprehensive and integrated system for measuring strategic performance because it uses both the financial and the non-financial measures (Kaplan and Norton, 1993).
The Balanced Scorecard includes four basic dimensions which are considered as a pillar of performance for most companies, and these four basic dimensions consist of the financial dimension, the customer's dimension, the internal operations dimension, and the learning and growth dimension (Kaplan and Norton, 1992).
Given the importance of the banking sector in the Jordanian economy as a whole, and because of the significant changes witnessed by the banking business in recent years, it has become necessary for the Jordanian banks to follow a new and integrated advanced methods for performance evaluation that will give a comprehensive understanding of all the dimensions of activity that is practiced, so it can make these banks do their job efficiently and effectively, and be able to face the challenges that may be ridden, in order to continue their journey of growth and stability.
Hence this study aims to identify whether there are differences between Jordanian banks in terms of the application of performance measures contained in the Balanced Scorecard dimensions and the impact of this application on the financial performance, taking into consideration that there are no study, data or disclosures which refer to the use and application of the integrated concept of Balanced Scorecard system by the Jordanian banks, and therefore, this study will test whether there are differences in the use of Jordanian banks of performance metrics similar to the performance measures contained in the Balanced Scorecard.
Previous studies
and the EPS (Earning per-Share) gave misleading clues towards development and innovation, which prompted researchers to try to develop financial measures or to develop operational standards such as the life cycle.
However, the use of these financial or operating measures individually will not be easy for managers without a single frame to bring them together in an orderly, integrated and holistic manner, hence the Balanced Scorecard provides managers with information from several dimensions, and therefore the Balanced Scorecard will provide managers with concentrated information excluding any redundant information, and direct managers to the axes of success and the key of development in the company, taking into consideration the need to link these dimensions to the vision and strategy of the company so that the Balanced Scorecard will be the wave of the company and its engine towards achieving its vision and strategy.
A local study by (Bashtawi, 2001) aimed to measure the overall performance of the Bank of Jordan (case study) through using the Balanced Scorecard system, in order to accurately assess the efficiency of the performance of the bank. The study concluded with a recommendation for applying the Balanced Scorecard on the Bank of Jordan. A Norwegian study by (Stemsrudhagen, 2004), who conducted a field study on 83 Norwegian industrial companies aimed to determine the degree of the presence of the substance of the Balanced Scorecard performance measurement systems used by these Norwegian companies. The study also aimed to tell the difference in performance measurement systems between the companies that adopt the Balanced Scorecard comparing and the companies that are not adopting the Balanced Scorecard. The study concluded that the performance measures used to contain a large number of standards upon which the Balanced Scorecard is used, regardless of the adoption or non-adoption of the Balanced Scorecard for these companies.
Another local study by (Maswada, 2004) aimed to evaluate the performance of the Jordanian private universities in the light of the application of Balanced Scorecard system. The researcher designed a questionnaire to assess the performance of private universities on the basis of non-financial indicators relating to the axis of the service recipient (students) and the axis of the internal processes and the focus of learning and development. The study relied on the audited financial statements of the private universities of Jordan to assess their financial performance based on financial indicators and calculate percentages and averages of these measures proposed through a series of years stretching during the time period from 1998 to 2002. The study concluded a number of results, most notably that there is negativity and weakness between assessing private universities by financial indicators, and assessing these private universities by the non-financial indicators.
Hoque and James, (2000) aimed to measure the extent of the use and application of the Balanced Scorecard by Australian factories. The study organized a questionnaire regarding the four dimensions of the Balanced Scorecard. The results did not support the hypothesis that large companies are usually the most widely used for the Balanced Scorecard. Soderberg, (2006) developed a balanced scorecard model, depending on the characteristics of the proposed scorecard of Kaplan and Norton (Kaplan and Norton's Balanced Scorecard, 1992, 1996, 2001). The model was applied to a sample of Canadian companies that exceed the number of 51 employees. The study found that there are 110 companies (an increase of 73.8% of the sample) are classified as companies that use the Balanced Scorecard, and for companies that use the Balanced Scorecard (and the 110) were also classified into five levels according to their application for the Balanced Scorecard.
A recent local study by (Zuriekat and Al-Sharari, 2008) aimed to measure the extent of use of the Balanced scorecard to measure performance in the Jordanian commercial banks and insurance companies. The study examined the relationship between different business strategies and the results showed that the business strategy and competitive market influence the use of the Balanced Scorecard in the Jordanian commercial banks and insurance companies, and finally, the study recommended that other researchers can do more research to test the assumptions and the benefits of using the Balanced Scorecard. (Dergham and Abofedah, 2009) attempted to identify the impact of applying the balanced performance model through its four dimensions (financial, client, internal operations, and the growth and learning) in enhancing the financial performance of the strategic Palestinian national banks working in the Gaza Strip. The most important findings of the study mentioned that Palestinian banks possess a clear vision for the dimensions of the financial performance of strategic basis which can help to achieve the financial performance of the strategic location, in addition to the use of the Balanced Scorecard through its four dimensions together which can enhance the performance of strategic financial banks.
Marques (2012) study revealed that the use of strategic management tools like the balanced scorecard (BSC) can provide strategic direction and organizational development of the national business. Moghaddam (2012) study aimed at finding whether the balanced scorecard implementation affect financial performance transparency in companies registered in Tehran Stock Exchange. Findings indicated that implementation of balanced scorecard can have an influence on both company value and the transparency of financial performance. Luen, et. al. (2013) study purpose was to examine whether, by practicing strategic planning, the business performances of these SMEs can be resilient and sustainable over the long term. The results confirmed that there was a positive relationship between strategic planning and their business performances.
(Al-Dweik et al., 2014). The study aimed at examining the extent of using the Balanced Scorecard in cost reduction at the Jordanian commercial banks and attempting to improve the performance evaluation in banks. The results showed the weak application of the Balanced Scorecard by the commercial banks and indicated that those banks clearly ignore the financial dimension. Raed Ibrahim et al., (2016) conducted a study that aimed at identifying the use of the Palestinian companies listed in (PEX) of the four dimensions of (BSC) in performance evaluation. The results showed that: (1) The financial managers agree the financial perspective and the customer perspective in evaluating the performance of the companies listed in (PEX). (2) The listed Palestinian companies do not adopt the perspective of knowledge and growth of performance measurement indicators. (3) The listed Palestinian companies do not depend on the indicators of business process in performance measurement. The study recommends (PEX) to obligate the listed companies to use (BSC) as a tool for strategic planning and performance evaluation. The study of Oghuvwu and Omoye (2016) showed that the adoption of Balanced Scorecard as an adoption to measure performance depends on the size of the company, the attitudinal factors, the top management's support, the cultural of the organization and environmental factors. Consequently, based on current literature. The variance in the Balanced Scorecard adoption may be linked to several factors. This relationship can be subjected to empirical evidence in further studies.
Sahiti (2016). This study seeks to assess the effect of Balanced Scorecard in improving the performance and profitability of the applying companies. The results showed that the BSC contributed in improving the performance and profitability of the companies which adopted this model. The study of Gupta (2017) aimed at investigating the extent of applying the Balanced Scorecard in banking industry. Since the banking sector is a basic player in the financial and capital market in India and plays a main role in the economic development of the country, banks are connected to a wide range of activities and presents a variety of financial products and services to a large number of customers. The study indicated that banks have to focus on apply the Balanced Scorecard to survive the intense competition. The more sound the banking system is, the more healthy the economy will be.
Nisha (2017) examined how banks can use the BSC model for performance evaluation by focusing on the banking sector of Bangladesh. She found a positive correlation among the BSC perspectives. Findings of the study particularly highlighted that banks which have experienced improvements in their selected financial indicators like ROA, ROE, had evidently increased their efforts towards the characteristics of the learning and growth, internal business process and customer perspectives.
Hypotheses of the study
Based on the previous studies, the hypotheses of the study can be formulated as follows: 1. There are no statistically significant differences between the Jordanian banks in terms of
the level applied for the financial dimension within the Balanced Scorecard.
2. There are no statistically significant differences between the Jordanian banks in terms of the level applied for the recipient of the service within the Balanced Scorecard.
3. There are no statistically significant differences between the Jordanian banks in terms of the level applied for the internal processes within the Balanced Scorecard.
5. There are no differences in banks performance as measured by the rate of return on assets (ROA) due to the implementation of the concept and methodology of the Balanced Scorecard.
6. There are no differences in banks performance as measured by the rate of return on equity (ROE) due to the implementation of the concept and methodology of Balanced Scorecard.
Study Tool
A questionnaire was designed composed of different sets of question, which aim to collect data from Jordanian banks in order to compare their use of the different four aspects (dimensions) of the Balanced Score Card. The questionnaire included two types of questions. The first type of questions allows one answer only and is designed according to Likert scale quintet in order to collect the responses of the study sample, where they were given classes answers weights as follows: Strongly Agree = 5, OK = 4, I do not know = 3, Disagree = 2, and Strongly Disagree = 1. The aim of these questions is to measure the extent of the application of each bank of the study sample of the metrics dimensions of the Balanced Scorecard. The second type of questions was in the form of questions that allow several answers so that the responder can choose what suits them regardless of the number of answers he/she chooses, and these questions aim to reveal the standards used by the Jordanian banks in the measurement of their performance.
Population and sample of the study
The study population consisted of all Jordanian commercial banks licensed in the Central Bank which are thirteen banks except the capital bank of Jordan which apologized to fill the questionnaires. However, the total number of banks operating in Jordan is twenty-three banks, including fifteen Jordanian banks, two of them are Islamic banks and the remaining are commercial banks, in addition to eight foreign banks. The exception was the Islamic banks because of the specificity of their operations and the privacy of performance measures, as well as an exception of the licensed foreign banks operating in Jordan and braved the eight banks because the major departments and centers are located outside Jordan.
A number of 150 questionnaires were distributed to management personnel in the banks involved in the study sample. The total number of returned questionnaires was 119 questionnaires which equal to 79.3% which is considered relatively high in this type of study. Seven of these returned questionnaires were excluded because of their lack of suitability for analysis. Thus, the number of questionnaires that have entered for the identification and analysis were 112 questionnaires, which accounted for 74.7% of the total number of questionnaires distributed. In order to measure the performance of the banks included in the study sample, return on assets (ROA) and return on equity (ROE) were used as proxies to capture the performance. The data was collected from the income statements of all banks during the year (2015) hence; some banks don't announce their financial statements officially.
Validity and reliability of the study tool
extent of the internal consistency of the paragraphs of the questionnaire, which was equal to 87.45% of the entire paragraphs of resolution combined, and this value is considered acceptable and indicates the reliability and consistency of the study tool, as the value of alpha accepted statistically is 60% at least for the dissemination of results (Sekaran, 2003). Statistical analysis results
Most important measures used by commercial banks
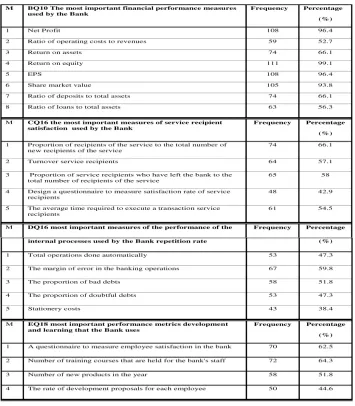
In order to determine the most important measures used by banks when they use the balance scorecard dimensions, frequencies and percentages has been calculated for all dimensions and presented in the table (1) as follows:
According to table (1) we can see that the most important financial performance measures used by the Jordanian banks in the measurement of financial performance as respondents considered is return on equity followed by net profit and EPS in the second rank, while the financial measure operating costs to revenues came in the last rank of importance. Also, from the same table we can see that the most important measures of the recipient satisfaction of the service (the customer) which are used by Jordanian banks is the proportion of recipients of the service to the number of new recipients of the service, followed by the total percentage of service recipients who have left the bank to the total number of recipients of the service and Design a questionnaire to measure satisfaction rate service recipients came in the last rank of importance.
Regarding the standards of the internal processes used by the Jordanian banks, we can see that the most important of these measures is the error rate in the banking operations, followed by the proportion of bad debt. Finally, it is observed from the table (1) that the most important performance metrics (measures) after learning and growth used by Jordanian banks is the number of training sessions, which are held annually and considered as one of the most important metrics used.
Descriptive statistics of the study variables
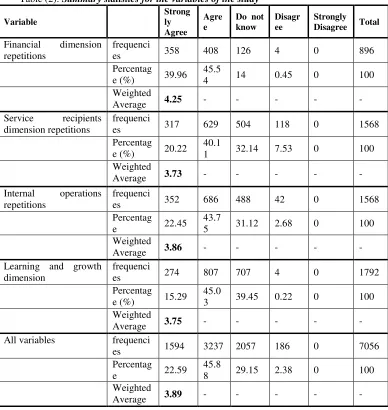
Table (2) shows the summary statistics for the variables of the study after they have been calculated. The table includes three main things which are; the frequencies for each category, the percentage of frequencies of each answer category, and the weighted average value of each variable, which was calculated by multiplying the percentage of frequencies for each answer category in weight class to the answer, and then summing the values for all categories.
The results showed that the answers of the respondents are concentrated in the "strongly agree" and "agree" significantly. Where the percentage of those who answered "strongly agree" and "agree" questions of the variables were as follows: first variable (financial dimension) accounted for 85.5 %, second variable (service recipients dimension) accounted for 60.33 %, third variable (internal processes dimension) accounted for 66.2%, and the last variable (learning and growth dimension) accounted for 60.3 %.Also, we can conclude from the value of the weighted average for each variable the level of application of each variable of Balanced Scorecard by the Jordanian banks. The financial dimension of the Balanced Scorecard came in the first rank, which amounted to 4.25, or 85%, reflecting the level of application. In the second rank comes the internal processes dimension with an average of 3.86 or the proportion of the application of 77.2 %. In the third rank comes learning and growing dimension at an average of 3.75 or 75%the level of the application. However, the concept of the recent recipient of the service comes last with an average ratio of 3.73 or application of 74.6 %.
Table (2): Summary statistics for the variables of the study Total Strongly Disagree Disagr ee Do not know Agre e Strong ly Agree Variable 896 0 4 126 408 358 frequenci es Financial dimension repetitions 100 0 0.45 14 45.5 4 39.96 Percentag e (%) - - - - - 4.25 Weighted Average 1568 0 118 504 629 317 frequenci es Service recipients dimension repetitions 100 0 7.53 32.14 40.1 1 20.22 Percentag e (%) - - - - - 3.73 Weighted Average 1568 0 42 488 686 352 frequenci es Internal operations repetitions 100 0 2.68 31.12 43.7 5 22.45 Percentag e - - - - - 3.86 Weighted Average 1792 0 4 707 807 274 frequenci es Learning and growth dimension 100 0 0.22 39.45 45.0 3 15.29 Percentag e (%) - - - - - 3.75 Weighted Average 7056 0 186 2057 3237 1594 frequenci es All variables 100 0 2.38 29.15 45.8 8 22.59 Percentag e - - - - - 3.89 Weighted Average Hypotheses testing
Table (3): Banks divided according to the application of the methodology for the Balanced Score Card
Application Average Bank Name Bank No. Category 4.49 Bank of Jordan
4
First
4.25 ABC banking Jordan
10
4.09 Arab Bank
1
4.06 The Housing Bank for Trade and Finance 5 3.90 JKB 6 Second 3.89 SGBJ 12 3.79 Investment bank 9 3.79 Arab Jordan Investment Bank
7
3.68 Jordan Ahli Bank
2 Third 3.61 Union Bank 11 3.53 Jordan Commercial Bank
8
3.38 Cairo Amman Bank
3
Descriptive statistics for all balanced scorecard dimensions by categories
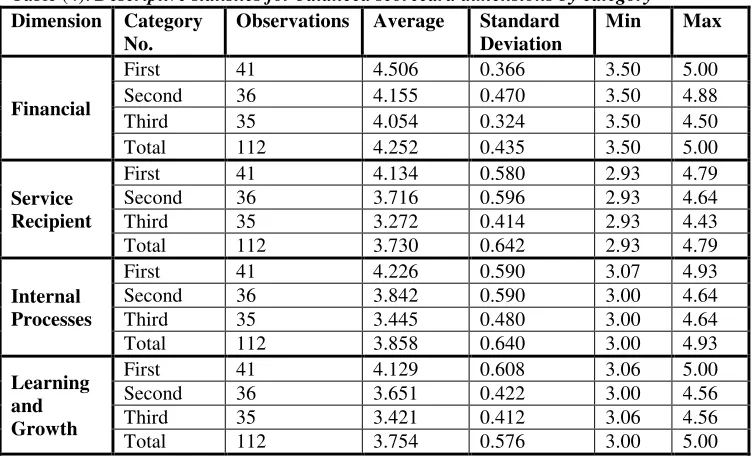
The following table (4) shows the descriptive statistics for the application level of all dimensions of balanced scorecard by categories of banks.
Table (4): Descriptive statistics for balanced scorecard dimensions by category
Max Min Standard Deviation Average Observations Category No. Dimension 5.00 3.50 0.366 4.506 41 First
Financial Second 36 4.155 0.470 3.50 4.88
According to table (4) the financial dimension of balanced scorecard shows that, the first category banks achieved the highest level with an average of 4.51, while the average of the second category banks was 4.16, and the average of third category banks was 3.06, with total average for the three categories 4.252. Also, we can notice that the first category banks in the service recipients dimension achieved the highest level of application for the recipients of the service dimension with an average of 4.13, while the average was 3.72 for the second banks category and the third category banks got the average of 3.27, with total average for the three categories 3.730. The descriptive statistics shows that, the first category banks in internal operations dimension achieved the highest level of application with an average of 4.23, while the second category banks has an average of 3.84, and the third category banks was 3.45, with total average for the three categories 3.858. Lastly, the descriptive statistics shows that, the first category banks achieved the highest level of application of the learning and growth dimension with an average of 4.13, while the second category banks average was 3.65, and finally with an average of 3.42 for the third category banks, with total average 3.754 for the three categories.
Results of Hypotheses Testing
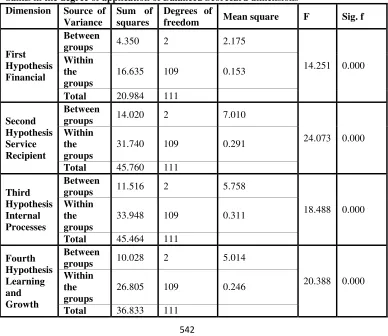
In order to test the hypotheses number (1 – 4) ANOVA test was used to find if there are any significant differences between the Jordanian commercial banks in the degree of application of Balanced Scorecard dimensions, the following table (5) shows the results: Table (5): results of ANOVA test for differences between the Jordanian commercial banks in the degree of application of Balanced Scorecard dimensions
Dimension Source of Variance
Sum of squares
Degrees of
freedom Mean square F Sig. f
First Hypothesis Financial
Between
groups 4.350 2 2.175
14.251 0.000 Within
the groups
16.635 109 0.153
Total 20.984 111
Second Hypothesis Service Recipient
Between
groups 14.020 2 7.010
24.073 0.000 Within
the groups
31.740 109 0.291
Total 45.760 111
Third Hypothesis Internal Processes
Between
groups 11.516 2 5.758
18.488 0.000 Within
the groups
33.948 109 0.311
Total 45.464 111
Fourth Hypothesis Learning and Growth
Between
groups 10.028 2 5.014
20.388 0.000 Within
the groups
26.805 109 0.246
According to table (5) we can present the results of testing hypotheses (1 – 4) as follows: H01: There are no statistically significant differences between the Jordanian commercial banks in terms of the level of implementation of the financial dimension within the Balanced Scorecard.
To test the hypothesis, one way ANOVA has been used, and depending on F value (14.251) and its significance (0.000) which is less than the significance level (5%), we reject the null hypothesis and accept the alternative one which states: there are statistically significant differences between the Jordanian commercial banks in terms of the level of implementation of the financial dimension within the Balanced Scorecard.
H02: There are no statistically significant differences between the Jordanian commercial banks in terms of the level of implementation of the Service Recipient dimension within the Balanced Score Card.
To test the hypothesis, one way ANOVA has been used and depending on F value (24.073) and its significance (0.000) which is less than the significance level (5%), we reject the null hypothesis and accept the alternative one which states: there are statistically significant differences between the Jordanian commercial banks in terms of the level of implementation of the Service Recipient dimension within the Balanced Scorecard.
H03: There are no statistically significant differences between the Jordanian commercial banks in terms of the level of implementation of the Internal Processes dimension within the Balanced Scorecard.
To test the hypothesis, one way ANOVA has been used and depending on F value (18.488) and its significance (0.000) which is less than the significance level (5%), we reject the null hypothesis and accept the alternative one which states: there are statistically significant differences between the Jordanian commercial banks in terms of the level of implementation of the Internal Processes dimension within the Balanced Scorecard.
H04: There are no statistically significant differences between the Jordanian commercial banks in terms of the level of implementation of the Learning and Growth dimension within the Balanced Scorecard.
To test the hypothesis, one way ANOVA has been used and depending on F value (20.388) and its significance (0.000) which is less than the significance level (5%), we reject the null hypothesis and accept the alternative one which state: there are statistically significant differences between the Jordanian commercial banks in terms of the level of implementation of the Learning and Growth dimension within the Balanced Scorecard.
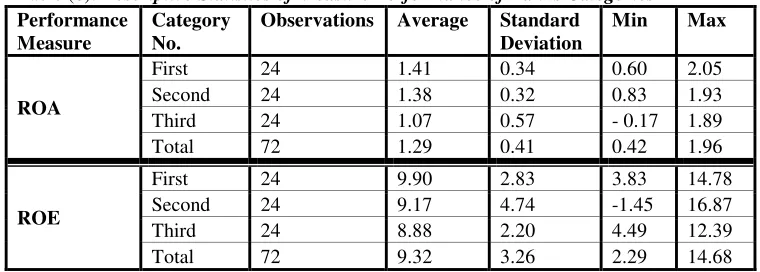
Test of the differences between the performance of Jordanian banks depending on the standards used to the dimensions of the Balanced Scorecard
Table (6): Descriptive Statistics of Measure Performance of Banks Categories Performance
Measure
Category No.
Observations Average Standard Deviation
Min Max
ROA
First 24 1.41 0.34 0.60 2.05
Second 24 1.38 0.32 0.83 1.93
Third 24 1.07 0.57 - 0.17 1.89
Total 72 1.29 0.41 0.42 1.96
ROE
First 24 9.90 2.83 3.83 14.78
Second 24 9.17 4.74 -1.45 16.87
Third 24 8.88 2.20 4.49 12.39
Total 72 9.32 3.26 2.29 14.68
From table (6), it can be noted that the first category banks achieved the highest rate of return on assets (ROA) with an average of 1.41 %, while the average was equal to 1.38% for second category banks, and finally an average of 1.07% for the third category banks. Also, it can be noted that the first category banks achieved the highest rate of return on equity (ROE) with an average of 9.90 %, while the average was equal to 9.17% for second category banks, and finally an average of 8.88% for the third category banks.
In order to test the hypotheses number (5and6) ANOVA test was used to find if there are any significant differences in banks performance which is measured by ROA and ROE depending on the implementation of the concept and methodology of the Balanced Scorecard, the following table (7) shows the results for both hypotheses: Table (7): results of ANOVA test for differences in JCBs performance depending on the implementation of the Balanced Scorecard
Performance Measure
Source of Variance
Sum of squares
Degrees of
freedom Mean square F Sig. f
Fifth Hypothesis ROA
Between
groups 1.748 2 0.874
4.875 0.010 Within
the groups
12.372 69 0.179
Total 14.120 71
Sixth Hypothesis ROE
Between
groups 14.020 2 6.681
0.567 0.570 Within
the groups
31.740 69 11.781
Total 45.760 71
Now according to table (7) we can present the results of testing hypotheses (5 and 6) as follows:
H05: There are no significant differences in JCBs performance as measured by the rate of return on assets (ROA) due to the implementation of the Balanced Scorecard dimensions.
differences in JCBs performance as measured by return on assets (ROA) due to the implementation of the Balanced Scorecard dimensions.
H06: There are no significant differences in JCBs performance as measured by the rate of return on equity (ROE) due to the implementation of the Balanced Scorecard dimensions.
To test the hypothesis, one way ANOVA has been used and depending on F value (0.567) and its significance (0.570) which is greater than the significant level (5%), we accept the null hypothesis which states: there are no significant differences in JCBs performance as measured by return on equity(ROA) due to the implementation of the Balanced Scorecard dimensions.
Results and recommendations
Based on the previous statistical analysis, the results can be stated as follows:
1. The Jordanian banks do not apply the integrated concept of the Balanced Scorecard, but apply a similar performance measures to the Balanced Scorecard dimensions.
2. The Jordanian banks apply the financial dimension concept at weighted average of 85%, followed by internal operations dimension with a weighted average of 77.2 % , followed by the learning and growing dimension with 75 % as weighted average, finally the service recipient ( customer) dimension with a weighted average of application equal to 74.6 %. 3. There are statistically significant differences between the degree of use of Jordanian banks
of the financial dimension of the Balanced Scorecard, and the first category banks achieved the highest level of application of the financial Balanced Scorecard equal to 4.51, while the average for the second category banks was 4.16, and was equal to 3.06 for the third category banks. The differences were important between the degree of application of the Jordanian banks of the financial dimension of the Balanced Scorecard , and these differences are also present when testing the extent of the differences between the levels of use of Jordanian banks to standards of the customer (service recipient) dimension, and the first category banks was the highest in its level of application for the service recipients dimension with an average of 4.13 , while the average was 3.72 for the second category banks and was equal to 3.27 for the third category banks.
4. There are significant differences between the three groups of banks in terms of the level of application for the measurements of dimensions of the internal operations and the learning and growth dimensions, and the application level was not similar for the three categories of banks.
5. The results indicated that the banks that use the measures of the dimensions of the Balanced Scorecard highly which were the first category banks, which achieved the highest return on assets with an average of 1.41%, while the average for the second category banks was 1.38%, and finally the average for the third category banks was equal to 1.07%, and that means that the application of the methodology has a significant impact in improving the performance indicators of these banks. There were significant differences in the performance of JCBs performance measured by ROA within the three banks categories due to the implementation of Balanced Scorecard dimensions.
Based on the previous findings, the study recommended the Jordanian banks to apply the integrated concept of Balanced Scorecard in order to achieve the strategic management goals and maintain the actual performance and strength. The study also recommended the JCBs to develop suitable legislations to make the Jordanian banks use the integrated concept of the Balanced Scorecard.
References
• Anati, R.,2004, Building a model for measuring and evaluating the performance of the
Jordanian contracting companies using the Balanced Scorecard, unpublished dissertation, Amman Arab university of graduate studies.
• Bishtawi, S, 2001, Performance evaluation based on BSC system using integration between costing system and management based on activities-a case study for one of the Jordanian banks, unpublished dissertation, Al-Mustansarya university.
• Durgham, M, and Abu-Fidha, M., 2009, The effect of applying the balanced performance concept (BSC) To strengthen the strategic financial performance of the national Palestinian banks working in Gaza Strip, Islamic university journal ( humanities studies periodicals, Vol.17, No.2, PP. 741-788.
• Fitzgerald, L., Johnston, R., Brignall, TJ., Silvestro, R. and Voss, C., (1991), Performance Measures in Service Business, CIMA Publication, London .
• Gregory, M.J., (1993), Integrated Performance Measurement: a Review of Current
Practice and Emerging Trends, International Journal of Production Economics, Vol. 30-31., PP. 281-296.
• Hoque, Z. and W. James, 2000, Linking the balanced scorecard measures to size and
market factors: Impact on organizational performance, Journal of Management Accounting Research, Vol.12, No.1, pp. 1-17.
• Johnson, H. and Kaplan ,R., (1987), Relevance Lost-the Rise and Fall of Management
Accounting , Harvard Business School Press, Boston, MA.
• Kaplan, Robert S., and Atkinson, Anthony A., (1997), Advanced Management Accounting, Third Edition, Prentice Hall, pp. 367.
• Kaplan, Robert S., and Norton, David P., (1992), The Balanced Scorecard-Measures That
Drives Performance, Harvard Business Review, Vol. 70, Issue 1, pp. 71-79.
• Kaplan, Robert S., and Norton, David P., (1993), Putting The Balanced Scorecard To Work, Harvard Business Review, Vol. 71, Issue 5, pp. 134-140.
• Luen, W.K., Yong, K.T. and Fook, O.S. (2013). Strategic Planning and Business
Performance: A Study of SMEs in Malaysia. Proceedings of 3rd Asia-Pacific Business
Research Conference, 25 - 26 February 2013.Kuala Lumpur, Malaysia.
• Marques, M.C. (2012). Strategic Management and Balanced Scorecard: The Particular
Case of Small and Medium Enterprises (SMEs) In Portugal. Business and Management
Review, 2(1): 50-62. http://www.businessjournalz.org/bmr.
• Maswada, S., 2004, Improving a model for evaluating the performance of the Jordanian private universities in the light of application of the Balanced Scoredcard system, unpublished dissertation, Amman Arab university of graduate studies.
• Moghaddam, T. (2012). The Role of Balanced Scorecard Implementation on Financial Performance Transparency. Life Science Journal, 9(4): 3963-3970. http://www.lifesciencesite.com.
• Sekaran, Uma, (2003), Research Methods for Business: A Skill-Building Approach, 4th
edition , John Wiley and Sons Inc., New York, p 288.
• Soderberg, M., (2006), The Balanced Scorecard: Structure and Use in Canadian Companies, A Thesis Submitted to the College of Graduate Studies and Research, University of Saskatchewan.
• Stemsrudhagen, J.I., (2004). The Structure of Balanced Scorecards: Empirical Evidence from Norwegian Manufacturing Industry in Performance Measurement and Management Control: Superior Organizational Performance, Studies in Managerial and Financial Accounting, Vol.14, edited by Epstein, M.J., and J. Manzoni. Oxford, UK. Elsevier, pp.303-321.
• Zuriekat, M., and Al-Sharari, M., 2008, The Relationship between Business Strategy,
Market Competition, and the Use of The Balanced Scorecard: An Application on Jordanian Commercial Banks & Insurance Companies, Jordan Journal of Business Administration, Vol. 4 No. 2. PP. 245.
Other references: