Development of Models for Crash Prediction and Collision
Estimation- A Case Study for Hyderabad City
V. Nivedithaϭ, A. Ramesh 2 and M. Kumar 3 Received: 27.10. 2015 Accepted: 15.02.2016
Abstract
Road traffic crash is a cause of unnatural death and occupies fifth position in the world as per WHO records. Road crashes in India are alarming in situation while road safety is professionally lacking and politically missing. Hyderabad city, the capital of newly formed Telangana State occupies sixth position in occurrence of road crashes. An attempt is made to understand which model is suitable for road crash prediction and estimation of collision type which is influencing road crashes in the city. A retrospective observational study was conducted in the city of considering factors as roadway geometrics, traffic data and type of collision. Regression models like Multiple Linear Regression, Poisson Regression, Logit Model and Multinomial Logistic Model are considered for arriving crash prediction models. The suitability of model is based on R2 and chi-square test. It is observed from the analysis through comparison of above model; Logit model has an R2 of 0.7 and is significant for chi-square test. Shoulder condition is an affecting factor for non-fatal crashes in the city which is ascertained by Logit model. Further analysis is also carried for arriving on type of collision influencing on road crashes. It is observed from the results that sideswipe is more significant for road crashes.
Keywords: Road crash, collision, regression models
Corresponding author E-mail: [email protected]
1. PG Student, Department of Civil Engineering, VNR Vignana Jyothi Institute of Engineering and Technology, Hyderabad, Telangana, India.
2. Associate Professor, Department of Civil Engineering, VNR Vignana Jyothi Institute of Engineering and Technology, Hyderabad, Telangana, India
3. Professor, Department of Civil Engineering, University College of Engineering Osmania University, Hyderabad, Telangana, India
1.
Introduction
Transportation is an important factor for providing an economical success in urban and rural areas of any country. Rapid urbanization, industrialization and migration along with other social changes have resulted in increasing necessity for travel across all age groups in all metropolitan cities of our country. As public transportation systems is not in pace with the demand of commuters, a large portion of road user adopts personal modes of transport across all metropolitan cities in India. This has resulted in increasing volume of more personalized motor vehicles such as two-wheelers and passenger car. A road crash is a damage that happens unexpectedly or by chance. A Major part of death rate is increasing due to road crashes. The Global Burden on Disease Study conducted by World Health Organization (WHO) reveals that every year about 1.24 million people die due to road crashes, mostly young people of age 15-29 year are involved in road crashes. As per the data of National Crime Records Bureau11 (NCRB) it is said that the road crashes occupies ninth position during the year 1990 and will be moved to third position by the year end of 2020. A total of 400517 fatal deaths were reported in the country during the year 2013. There is an increase in 1.4% of fatal crashes from the year 2012-201311(Source NCRB: 2013). Ministry of Road Transport Highways10 (MORTH) data exhibits that every hour there are about 56 road crashes, every hour more than 14 deaths and majority is due to the occurrence of road crashes10. The crash rate of Andhra Pradesh during the year 2013 was 36.1% (Source MORTH11.)
Most of researchers explained that road crashes are unpredictable because of factors beyond control. Regression models were developed by them for predicting road crashes considering various factors in most of the metropolitan cities. In this paper an attempt is made to develop Crash Prediction Model and to estimate which type of collision is more significance for the cause of road crashes. Four types of regression models are considered: Multiple Linear Regression, Poisson regression and Logit models for prediction of crashes and Logistic Regression was used for estimation of collision significance.
1.1 Objective of the Study
Three years road crash data was collected for city
and is considered in analysis. First part analysis is carried using Multiple Linear Regression, Poisson regression and Logit models. Second part of analysis is carried using traffic and crash data for collision analysis.
The objectives of study are:
a) To ascertain which type of mathematical model is suitable for prediction of road crashes and its influencing variables.
b) To estimate type of collision significance on road crashes.
2. Literature Review
Road safety is emerging as a major social concern in the country. A major part of the death rate is increasing due to road crashes. Many models were developed for Prediction of road accidents. Hong2 et al. developed models considering the characteristics of roadway alignment and traffic characteristics. He developed models that can be used to predict the accident rates on new or improved roads. Desai and Patel8 focused on the development of accident prediction model based on regression analysis. He has made attempt to develop accident model based on linear regression techniques. The model exhibits satisfactory goodness-off it and a good prediction of success rate. Olugbenga and Makinde14 discussed on regression models developed with dependent variables as number of accident and independent variables as number of people killed in the accident, number of people injured, number of people involved in the accident. The model has provided good coefficient of correlation and coefficient of determination “R2” value. Awe and Mumini13 developed regression models to capture the interconnectedness among accident related variables in Nigeria. His study focused on determining the degree of association between those who are killed in road crash. Variables considered are number of vehicles involved, number of accidents recorded, number of injuries and month of the accident occurred. William and Mohammad15 made an attempt to develop prediction model for road traffic crashes occurring on the rural sections of the highways in the Ashanti Region of Ghana. This model was developed for all injury crashes occurring on selected rural highways. Anitha and Anjaneyalu1 to developed crash prediction model using the factors that causes the road crashes. Murthy and Srinivasa
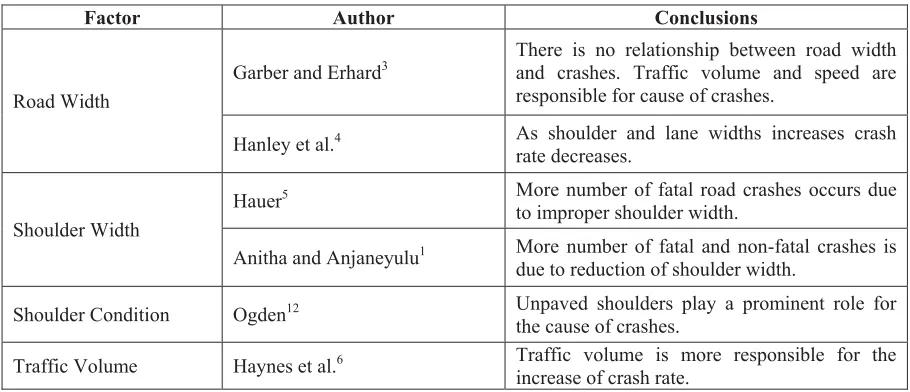
Table 1. Literature review on influence of geometric and traffic variables on crashes
Factor Author Conclusions
Road Width
Garber and Erhard3 There is no relationship between road width and crashes. Traffic volume and speed are
responsible for cause of crashes.
Hanley et al.4 As shoulder and lane widths increases crash
rate decreases.
Shoulder Width
Hauer5 More number of fatal road crashes occurs due
to improper shoulder width.
Anitha and Anjaneyulu1 More number of fatal and non-fatal crashes is
due to reduction of shoulder width.
Shoulder Condition Ogden12 Unpaved shoulders play a prominent role for
the cause of crashes.
Traffic Volume Haynes et al.6 Traffic volume is more responsible for the
increase of crash rate.
Rao9 used factors that influences road accidents and has analyzed using Statistical Package for Social Sciences (SPSS), a mathematical toll for development of regression models. His objective is to review relation between accident per year and intersection. He has suggested improvement measures to prevent road accidents. Kumar and Ramesh7 discusses on estimation of type of collision for road accidents using logit models. Sideswipe end, Rear end and Head on collisions are evaluated using the logistic regression techniques. Table 1 provides a brief review on influencing variables for crash prediction.
2.1 Crash Causing Factors
There are five critical components that interact in a traffic system as (i) Road users (drivers & pedestrians), (ii) Vehicle factors, (iii) Traffic Control Devices, (iv) Environmental factors and (v) Streets and Highways. In the analysis more number of road crashes occurs due to road users.
2.2 Key Concepts in Regression Modeling
Regression analysis is a statistical process for estimating the relationships among dependent and independent variables. There are many techniques for modeling and analyzing variables correlations.
Regression analysis is widely used for predicting road crashes.
2.2.1 Multiple Linear Regressions: In this approach modeling is carried between a
scalar dependent variabley and one or more
explanatory variables (or independent variable) denoted as X.
< ȕȕi Xi + e (1) Where, Xi is explanatory variables and ȕi is
regression coefficients of the respective
independent variables and ȕ0 regression constant.
2.2.2 Poisson Regression: This technique explains random variable Y that exhibits Poisson distribution along with parameter μ. It takes integer values y = 0, 1, 2 etc. with probability. Occurrence of a crash can be considered as the result of a Bernoulli’s trial. It can have only two outputs as occurrence or non-occurrence of a crash. P(Y=y) = (exp (-μ).μy)/y! (2) Where, μ is mean number of crashes occurring, y is crashes per time period. Above equation is used to predict the number of crashes in a city.
2.2.3 Logistic Regression: Logistic regression, a regression model where the dependent variable is categorical.
Y= (expȕ0ȕ1 X1)H[Sȕ0ȕ1 X1)) (3)
Where, Y is dependent variable, X1 is explanatory
variables and ȕ1 is regression coefficients.
3. Data Collection
3.1 Crash Prediction Data Analysis
Statistical analysis was carried for developing
crash prediction model. Bowenpally, Osmania University, Punjagutta, Banjara Hills and Jublee Hills locations are selected for model development as more number of crashes are occurred long these stretches. Crash data in terms of fatal, non fatal and total number of crash is provided in table 3. The data includes road geometrics, crash data and traffic volume. These variables are considered because road geometry is not provided uniformly throughout the city. 2- Wheelers, 3 – wheelers and pedestrians are largely involved in the cause of road crash which is the prime cause for considering them as independent variables in crash analysis. The variables selected for analysis are given in table 2.
These locations are considered as more number of road crashes takes along these stretches in the city and is used for development of crash prediction model.
3.2 Collision Type Data Analysis
Hyderabad area data is collected for arriving on which type of collision is more significant. Data was analyzed based on type of collision, type of vehicle involved and number of fatal and non-fatal crashes. Parameters considered for analysis of collision type is shown in table 4.
4. Data Analysis
Preliminary analysis of data was performed to understand the relationship of variable parameters. From the analysis it is observed that more number of road crashes takes place due to rash driving. Table 5 provides the description of each variable considered for model development of crash. Time and weather condition was not considered for analysis as data was not reflecting from the secondary source.
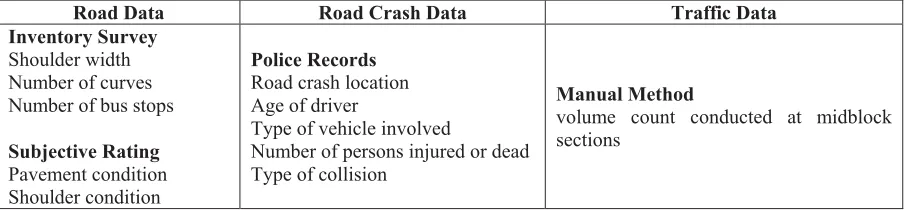
Table 2. Variables selected and method of data collection
Road Data Road Crash Data Traffic Data
Inventory Survey
Shoulder width Number of curves Number of bus stops
Subjective Rating
Pavement condition Shoulder condition
Police Records
Road crash location Age of driver
Type of vehicle involved
Number of persons injured or dead Type of collision
Manual Method
volume count conducted at midblock sections
Table 3. Road crash areas
Year Location Total number of crashes Total number of Fatal crashes Non-Fatal crashes Total number of
2012
Bowenpally 77 24 67
Osmania University 54 10 47
Banjarahills 130 19 122
Punjagutta 97 20 83
Jubleehills 56 15 48
2013
Bowenpally 103 22 90
Osmania University 64 10 57
Banjarahills 115 19 107
Punjagutta 129 18 120
Jubleehills 83 17 74
2014
Bowenpally 110 30 92
Osmania University 95 19 72
Banjarahills 135 20 117
Punjagutta 112 22 102
International Journal of Transportation Engineering, Vol 3/ No. 2/ Autumn 2015
Table 4. Parameters considered
Total number of accidents Fatal 763 Non-fatal 6496
Type of vehicles
2-Wheeler 3325 3-Wheeler 478 Pedestrian 3456
Type of collision
Side Swipe 4929
Rear-end 713 Head-on 617
Table 5. Descriptive statistics
Variable Code Variable Description (per kilometer data) Minimum Maximum
PC Pavement Condition* 1 5
SC Shoulder condition* 1 5
SW Shoulder width 0 2.50
AADT Traffic volume
(hundred vehicles) 2 100
AGE Age 2 75
NFC Number of Non-Fatal Crashes 0 53
FC Number of Fatal Crashes 0 15
TC Number of Total Crashes 0 68 *Subjective rating: 1-Very Good, 2-Good, 3-Fair, 4-poor, 5 -Very Poor.
4.1 Correlation Analysis
Correlation analysis gives a quantitative assessment of association between two variables. The correlation can be positive or negative with varying strengths.
A positive correlation coefficient means that the
value of one variable increases, the value of other variable also increases. As one variable decreases the other also decreases. A negative correlation coefficient indicates that as one variable increases, the other variable decreases. It is observed from table 6 that as pavement condition deteriorates more number of non-fatal crashes is increasing.
5. Results and Discussions
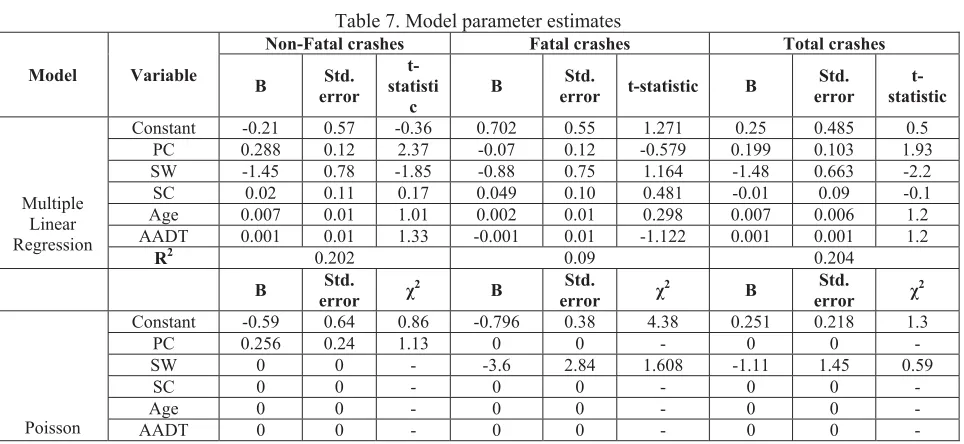
Three types of regression models were used for developing crash models. The dependent variables are considered as Non-Fatal Crashes, Fatal Crashes and Total Crashes and the variables which are listed in table 5 are considered as independent variables. The model parameters are provided in table 7.
5.1 Model Interpretation for Crash Prediction In Table 7 all the variables are significant for model predication and it can attribute on better
suitability of model for crash prediction. Condition of the pavement is also one of the affecting factors for prediction of model development.
5.1.1 Multiple Linear Regression Model
Multiple Linear Regression Model R2 value and coefficient obtained from model analysis explains that there is relationship between dependent and independent variables. Fatal crashes are less frequent when compared to Non-Fatal crashes which approximates as linear in relation. It is observed that no variable coefficients are zero and is an indication of existence of model. All the t-statistic values are within the limit at 1 degree of freedom for 0.05 level of significance. The developed model of linear regression has lower R2 value (0.204) and shows poor performance in prediction of crashes. Hence it is not fit for prediction of crashes. The models emphasize that there is influence of pavement condition on non fatal crashes. This value is higher than shoulder condition. Improvement in pavement condition and increase in shoulder width may reduce non-fatal crashes.
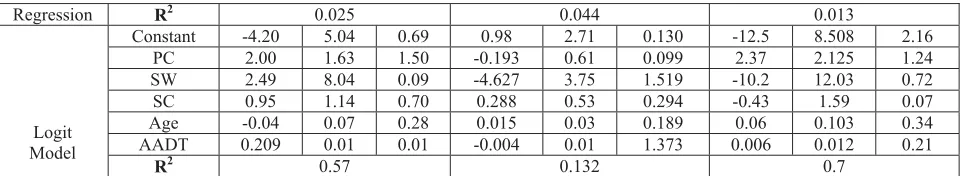
5.1.2Poisson Regression
low than linear and logit. It is not applicable for model development. The variable coefficients of Poisson are zero. The chi-square values also indicates zero. As chi-square values are not within the limit of this model and are not suitable for development of crash prediction. There is no relationship between the dependent and independent variables. Due to the improper values of R2 and chi-square parameters of this model is not possible.
5.1.3 Logit Model
Logit Model, The R2 value of logit is higher than that of Linear and Poisson models. The performance of logit model is analyzed using two parameters - chi-square and R2 values. The variable coefficients are non-zero. The choice of Logit model depends on dispersion in the data. For all types of crashes chi-square values are within the limit at 0.05 level of significance. The chi-square values are significantly different from zero. The occurrences of non-fatal crashes are more due to
improper shoulder provided along pavement edge and condition of pavement. It is observed from the model constants that as the pavement condition
deteriorates which is also influenced by width of the shoulder more numbers of non fatal crashes are occurred.
5.2 Collision Type Analysis
Using multinomial logistic regression, number of crashes as dependent variable, factors as collision and covariates as vehicles are considered. Collision analysis carried through SPSS package and its values are provided in table 8
Chi-square values are within the limit for vehicles and collision type. Two-wheelers and pedestrians are more effected when road crashes takes place. From the analysis it is observed that side swipe type of collision is occurring more when compared to other type of collision. Swipe and rear-end collisions are significant for non-fatal type of crashes.
Table 6. Correlation coefficients
FC NFC TC PC SW AADT SC Age
FC 1
NFC -0.077 1
TC 0.121 0.883 1
PC -0.136 0.305 0.232 1
SW -0.216 -0.190 -0.267 0.125 1
AADT -0.210 0.176 0.142 0.146 0.225 1 SC 0.019 0.015 -0.033 -0.004 0.191 0.142 1
Age 0.083 0.133 0.177 -0.109 -0.110 -0.012 0.119 1
Table 7. Model parameter estimates
Model Variable
Non-Fatal crashes Fatal crashes Total crashes
B error Std. statistit- c
B error Std. t-statistic B error Std. statistic t-
Multiple Linear Regression
Constant -0.21 0.57 -0.36 0.702 0.55 1.271 0.25 0.485 0.5
PC 0.288 0.12 2.37 -0.07 0.12 -0.579 0.199 0.103 1.93
SW -1.45 0.78 -1.85 -0.88 0.75 1.164 -1.48 0.663 -2.2
SC 0.02 0.11 0.17 0.049 0.10 0.481 -0.01 0.09 -0.1
Age 0.007 0.01 1.01 0.002 0.01 0.298 0.007 0.006 1.2 AADT 0.001 0.01 1.33 -0.001 0.01 -1.122 0.001 0.001 1.2
R2 0.202 0.09 0.204
B error Std. Ȥ2 B Std.
error Ȥ2 B error Std. Ȥ2
Poisson
Constant -0.59 0.64 0.86 -0.796 0.38 4.38 0.251 0.218 1.3
PC 0.256 0.24 1.13 0 0 - 0 0 -
SW 0 0 - -3.6 2.84 1.608 -1.11 1.45 0.59
SC 0 0 - 0 0 - 0 0 -
Age 0 0 - 0 0 - 0 0 -
AADT 0 0 - 0 0 - 0 0 -
Regression R2 0.025 0.044 0.013
Logit Model
Constant -4.20 5.04 0.69 0.98 2.71 0.130 -12.5 8.508 2.16
PC 2.00 1.63 1.50 -0.193 0.61 0.099 2.37 2.125 1.24
SW 2.49 8.04 0.09 -4.627 3.75 1.519 -10.2 12.03 0.72
SC 0.95 1.14 0.70 0.288 0.53 0.294 -0.43 1.59 0.07
Age -0.04 0.07 0.28 0.015 0.03 0.189 0.06 0.103 0.34 AADT 0.209 0.01 0.01 -0.004 0.01 1.373 0.006 0.012 0.21
R2 0.57 0.132 0.7
Table 8. Chi-square values
Effect Significance Obtained Chi-Square
Value Square Values Table Chi- Degree Of Freedom
Vehicles 0.095 2.431 3.841 1
Collision
Side Swipe 0.154
3.867 5.991 2
Rear-End 0.060 Head-On 0
6. Conclusions
Road crashes have become a major concern to the road users, safety experts and traffic engineers. The main reasons for the cause of crashes are due to human physiological behavior, vehicular defects and road geometrical conditions. Many variables are responsible for the cause of crashes. It is not possible to consider all the variables in conducting studies for development of crash prediction model. This study examines the major influencing factors for the cause of road crashes in Hyderabad city. Three regression models were used for development of crash prediction models as Multiple Linear regression, Poisson regression and Logit regression. Among the three logit model is found to be more suitable for prediction of crashes in the city. The observed t-statistic and chi-square values are within the limit at 0.05 level of significance. From Logit model analysis it is observed that due to poor pavement and shoulder condition more number of non-fatal crashes are occurred. Proper care shall be taken for improving the pavement condition on regular basis and providing provision for shoulder in urban area. Improving pavement condition and shoulder width may reduce non fatal crashes in the city. From collision analysis it is observed that side swipe is more significant for non-fatal crashes. Two-wheelers of 46% and Pedestrians of 48% are affecting more for road crashes.
7. References
-Ackaah, William and Salifu, Mohammed (2011) “Crash prediction model for two-lane rural highways in the Ashanti region of Ghana”, Science direct, Vol. 35, No.1, pp.34-40.
-Anitha Jacob and Anjaneyalu, M.V.L.R. (2013) “Development of crash prediction models for two-lane rural highways using regression analysis”, Highway Research Journal, Vol. 6, pp.59-70.
-Garber, N. and Erhard, A. (2000) “Effect of speed, flow and geometric characteristics on crash frequency for two-lane highways”, Transportation Research Record, Vol.1717, pp.76-83.
-Hanley, K.E., Gibby, A.R. and Ferrara, T.C. (2000) “Analysis of accident reduction factors on California state highways”, Transportation Research Record, Vol.1717, pp.37-45.
-Hauer, E. (1986), “On the estimation of expected number of crashes”, Accident Analysis and Prevention, Vol.18, pp.1-12.
-Haynes, Robert, Lake, Lain, Kingham, Simon, Sabb, Clive E., Pearce, Jamie and Barett, Ross (2008) “The influence of road curvature on fatal crashes in New Zealand”, Accident Analysis and Prevention, Vol. 37, pp.843-850.
-Hong, Dahee (2005) “Development of traffic accident prediction models by traffic and road characteristics in urban areas”, Proceedings of
the Eastern Asia Society for Transportation Studies, Vol. 5, pp.2046 – 2061
-Kumar, M. and Ramesh, A. (2014) “Estimation of influence on type of collision for road accidents using logit models in Cyberabad – Hyderabad -India”, International Journal of Civil and Structural Engineering, Vol.1, No.2, pp.61-65.
-Manisha Minesh Desai, Manisha Minesh, and Patel, A.K. (2010) “Road accidents study based on regression model: a case study of Ahmedabad City”, National Conference on Recent Trends in Engineering & Technology. -Ministry of Road Transport Highways (2013),
MORTH, New Delhi.
-Murthy, NSSR, and Srinivasa, Rao R. (2015) “Development of model for road accidents based on intersection parameters using regression models”, International Journal of
Scientific and Research Publications, Vol.5, No.1.
-National Crime Records Bureau (2013), NCRB, New Delhi.
Ogden, K.W. (1997) “The effects of paved shoulders on crashes on rural highways”, Accident Analysis and Prevention, Vol. 29, pp.353-362.
Olawale, Awe Olushina and Idowu Adarabioyo, Mummini (2011) “Multivariate regression techniques for analyzing auto-crash variables in Nigeria”, Journal of Natural Sciences Research, Vol. 1, pp.2224-3186.
Oyedepo Olugbenga J and Makinde, Oluyemisi (2010) “Accident prediction models for Akure-Ondo carriageway Akure-Ondo state southwest Nigeria: using multiple linear regression”, African Research Review, Vol. 4, No.2, pp.30-49.