AUT J. Elec. Eng., 49(2)(2017)123-130 DOI: 10.22060/eej.2017.10676.4868
Data Hiding Method Based on Graph Coloring and Pixel Block‘s Correlation in
Color Image
G. Ghadimi1, M. Nejati Jahromi2, E. Ghaemi3, A. H. Heydari4 1 Dept. of Electrical Engineering, Emam Ali University, Tehran, Iran
2 Dept. of Electrical Engineering, Shahid Sattary Aeronautical University of Science and Technology, Tehran, Iran 3 Dept. of Electrical Engineering, Ahar University, Ahar, Iran
4 Department of Electrical and Electronic Engineering, Amirkabir University of Technology, Tehran, Iran
ABSTRACT: An optimized method for data hiding into a digital color image in spatial domain is provided. The graph coloring theory with different color numbers is applied. To enhance the security of this method, block correlations method in an image is used. Experimental results show that with the same PSNR, the capacity is improved by %8, and also security has increased in the method compared with other methods. In the correlation block-based image method, data hiding capacity of the host image varies according to image type and defined threshold level. In the proposed algorithm, during graph explanation, independent pixels placed side by side were colored. Then, based on “pixel block correlation data hiding” process is done. This method grows the security and capacity of hiding process. Besides, this increases the effects of image format and correlation threshold on security and capacity.
Review History:
Received: 30 June 2015 Revised: 3 June 2017 Accepted: 10 June 2017 Available Online: 21 June 2017
Keywords:
Data hiding Graph coloring Correlation Threshold Security Color number
1- Introduction
In recent years, with the development of the Internet and its application in information systems, the issue of information security has become increasingly important. To protect the secret message from being stolen during transmission, there are two ways to solve this problem in general. One way is encryption, which refers to the process of encoding secret information in such a way that only the right person with a right key can decode and recover the original information successfully. The other way is steganography that is a technique hiding secret information into a cover media or carrier. Several reversible data hiding schemes have been proposed [1-3]. Steganography has already been implemented on images, video clips, texts, music, and sounds [4]. It has also been implemented on such varying systems as computers and mobile phones [5]. Among the methods of steganography, the most common one is to use images to apply steganography. In these methods, features such as pixels of an image are altered in order to hide the information so as not to be identifiable by human users and the changes applied to the image are not tangible.
In this paper, a new method of data hiding and data extraction based on rainbow graph coloring and neighboring correlation will be introduced in detail, followed by our experimental results, which will be presented later.
Fridrich et al. in [6] proposed “Grid Colorings in Steganography”; they used a simple construction to prove that Gd is the rainbow for all d≥1. They discussed an
important application of this result in steganography. Zhang
et al. in [7] proposed a method of stenography embedding that is described based on vertex colorings in the grid graph. In this method rainbow coloring is repeated in every block of cover signals to increase embedding efficiency. It outperforms LSB matching revisited method and direct sums of ternary Hamming codes. Shuai et al. in [8] proposed two graph coloring-based data hiding scheme that embed secret data in the spatial domain of gray scale image. The main idea of their scheme is to use a graph, in which every vertex corresponds to a pixel pair, to hide data by replacing every color corresponding to some bits of the secret message with a pair of pixels of a different color.
Nafari et al. proposed a simple method for reversible data hiding in image blocks, by calculation of correlation matrix before data embedding [9]. They apply a new data hiding method in these blocks with considering the pattern of the correlation matrix and correlation threshold.
Sidi Mohamed Douiri et al. in [10] proposed a method for “±1 steganography” based on Cartesian product of rainbow colorings; in this way they could embed a (2d+1)-ary digit m into d pixels (x1,x2,...,xd) using coloring c(x1,x2,...,xd) to represent the message m.
In [11], Widi Astuti et al. proposed a method based on graph coloring and vector quantization (VQ). In this method, an image can be divided into several blocks, and then each block is quantified based on the similarity with a dictionary called codebook in which VQ is codebook generating. Next, a graph is constructed by adding a vertex for each code word in the codebook such that every vertex is representing the codebook. In this paper, a new reversible data hiding technique is proposed which is based on individually graph coloring and
correlation of the blocked Image. Detailed advantages of graph coloring and correlation computation are presented in Section 3.
The remainder of this paper is organized as it follows. Pixel blocks correlation in an image is reviewed in Section 2. In Section 3, our new method of data hiding and data extraction based stenography with the graph is introduced in detail. In Section 4, the new proposed method is described. Experimental results are presented in section 5. Finally, Section 6 concludes the paper.
2- Pixel blocks correlation in an image
The proposed method explores the similarity of neighboring pixels to improve the correlation-based reversible data hiding. It aims to provide a higher data hiding capacity and maintains the quality of the image.
Correlation in an image is an illustration of a relationship between each pixel and the neighboring pixels. In this scheme, the image is divided into non-overlapping 2×2 blocks. In dividing process, block size plays an important role in the number of bits to be embedded. Since one bit is embedded in each block; applying small-sized blocks is more advantageous. Fig.1 gives an illustration of the blocking process. Each block (central black block) as shown in Fig.1-c, has eight adjacent blocks (colored blocks) and each one is used in calculation of the mean correlation of the central block.
If the size of an image is M × N pixels with M rows and N columns, then,he number of blocks will be calculated by
by:
where n is the number of bits to be embedded. 2×M+2×N−4 is the number of pixels at the border of an image. These pixels are used only in calculating the correlation matrix, not in the procedure of data embedding. Note that if they are utilized in data embedding procedure, they will cause distortion at the border of the image.
If A and B are two matrices, the correlation of these two matrices is calculated by:
In the above relation, A is the central block. There are n central blocks in the image. B1:8 are the eight adjacent blocks
and and are the mean values of A and B, respectively. In other words, the correlation between block A and block B (containing eight neighbors), is calculated by:
Since block B contains 8 sections, which are in the neighborhood of block A, the equation (3) is exploited for calculating correlation between blocks, there are 8×n correlation calculations.
3- Steganography with graph coloring A. Graphs theory
Definition 1: Graphs.
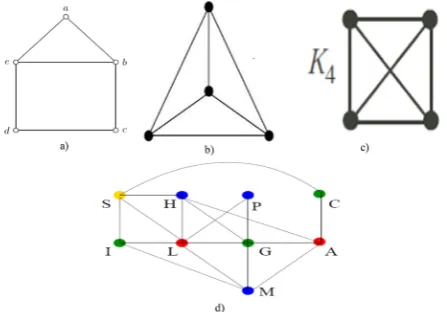
A graph G= (V, E) is an ordered pair of sets. The elements of V are called vertices or nodes, and those of E⊆V×V are called edges or lines. We refer to V as the vertex set of G, with E being the edge set. The cardinality of V is called the order of G, and |E| is called the size of G. One can label a graph by attaching labels to its vertices. If (V1,V2)⊆ E is an edge of the
graph G=(V, E), we say that V1 and V2 are adjacent vertices.
For ease of notation, we write the edge (V1,V2) as V1V2 . Fig.
2-a shows a kind of graph.
The vertex and edge sets of the graph are V= {a, b, c, d, e}. The edge set of G is given by E = {ab, ae, ba, bc, be, cb, cd, dc, de, ed, eb, ea}.
Definition 2: Regular graph:
In graph theory, a regular graph is a graph where each vertex has the same number of neighbors; i.e. every vertex has the same degree. A regular graph with vertices of degree k is called a k regular graph or regular graph of degree k. The regular graph is given in Fig 2-b.
Definition 3: complete graph.
A simple graph that contains every possible edge between all the vertices is called a complete graph. A complete graph with n vertices is denoted as Kn. A complete graph is given in Fig 2-c:
B. Graph coloring theory
In graph theory, graph coloring is a special form of graph labeling; it is an assignment of labels traditionally called “colors” to elements of a graph subject to certain constraints. In its simplest form, it is a way of coloring the vertices of a graph such that no two adjacent vertices share the same color; this is called a vertex coloring.
Definition 4: Proper Coloring, k-Coloring or k-Colorable A proper coloring is an assignment of colors to the vertices a) b) c)
Fig. 1. Procedure of blocking, (a) original image (b) dividing
into 2×2 blocks (c) adjacent eight blocks of each central block Fig. 2. a) A house graph b) regular graph c) complete graphd) 4-coloring of graph
(
- 2 - 2 4)
4
× × × +
= M N M N
n (1)
(3)
(2)
(
)(
)
(
) (
2
)
2
−
−
=
−
−
A A B B
c
A A
B B
A
B
(
)
(
)
(
)
(
)
1:8 1:8
1:8 2 2
1:8 1:8
− −
=
− −
A A B B c
of a graph such that no two adjacent vertices have the same color. The number of colors is often denoted by χ(G). A k-coloring of a graph is a proper coloring with k colors. A graph that has a k-coloring is said to be k-colorable. Thus, the least number of colors in k-coloring of graphs is our desired goal. Fig 2-d shows a 4-coloring of the graph (χ(G)=4): In graph coloring-based data hiding, it is important to represent the image as a graph and choose a good color number for the image’s pixels. Then, color the embedding data into the blocked image based on the correlation value of each block with neighboring blocks.
We propose three techniques for graph coloring-based data hiding and outline the theoretical framework of technical evaluation through the analysis of these three techniques. first graph:
In Fig. 3-a, the central vertex 1 has four neighbors with numbers 2, 3, 4, and 5. If we continue this graph to infinity in all directions, all vertexes of this graph, aside from the first and the last rows and columns, form k-regular graph, we can color k-regular graph with a k+1 colored number [12]. Hence, it can be concluded that we can color all the vertexes of Fig. 3-a with five colors. We can implement the above-mentioned issue in Fig.3-b. Fig.3-b shows a 3×3 pixel block, similar to that of Fig.3-a, which central pixel, with number 1, has four neighbors. If we continue this pixel block to infinity in all directions, all pixels aside from the first and last rows and columns have four neighboring pixels, and then we can color all of them with five numbers.
Second graph:
In Fig.3-c, central vertex 1 has eight neighbors with numbers 2, 3, 4, 5, 6, 7, 8 and 9. If we continue this graph to infinity in all directions, all vertexes of this graph, aside from the first and last rows and columns, form k-regular graph, we can color k- regular graph with k+1 colored numbers [12]. Thus, it can be concluded that we can color all the vertexes of Fig .3-c with nine colors. We can implement the above-mentioned issue in Fig.3-d. The central pixel of Fig.3-d, with number 1 is similar to that of centeral vertex of Fig. 3-d, has eight neighbors. If we continue this pixel block to infinity in all directions, all pixels aside from the first and last rows and columns have eight neighboring pixels. Therefore, we can color all of them with nine numbers.
Third graph:
In this graph, we study the coloring of the square of Cartesian products of paths, namely grids [13]. The obtained results are summarized in the following table.
In this case, we do not pay attention to the smallest number of colors; however, according to our requirements such as high resolution and the high amount of data embedded in the image, we start coloring the image with a bigger color number.
4- Proposed method
Figure.4 shows steganography technique in our proposed method.
In all experiments, five colored images are tested as depicted in Fig.5-a) Tree b) Baby c) Chairs d) Washington e) Sun. All images have the same size 512×512 pixels.
Operating system windows 7 and the program-developing environment is MATLAB 11.2. To evaluate the proposed method, we have considered three features, namely threshold, PSNR and payload capacity. The PSNR value can be calculated by the following equation.
where R is the maximum fluctuation in the input image data type. MSE (Mean Square Error) is obtained from:
where I1 is the main image, and I2 is the stego-image. M and
N denote the row and column of each image, respectively. For example, if the input image has a double-precision floating-point data type, then R is 1. If it has an 8-bit unsigned integer data type, R is 255.If the distortion between the cover image and the stego-image is small, the PSNR value is large. Thus, a larger PSNR means that the quality of the stego-image is better than the smaller one. Secret data is generated using pseudo-random number generator.
5- Experimental results
In this paper, a new reversible data hiding technique has been proposed which is based on graph coloring and correlation value of each pixel block. In this method, first, according to the presented methods in section 3-B, (for example first graph is colored with 5 colors) we start coloring the image’s pixels with color number 5. Then according to the definition of independent vertex in graph [11], independent pixels are put together, and image is divided into non-overlapping 2×2 blocks. Then, the correlation between each block and eight neighboring blocks is calculated by (3). The value of the correlation is normalized in the range of 0 to 1. After this, we specify a threshold, say T, to start the data embedding procedure.
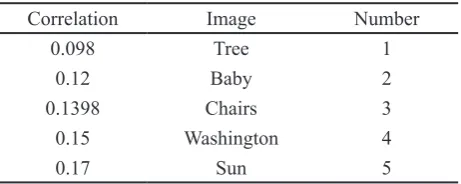
Five selected images in Fig. 5 are arranged from the lowest to the highest correlation between the image’s pixels. The correlation of each image obtained from (3), are given in Table 2:
Fig. 3. a) center vertex with 4 neighbor b) 3×3 pixel block c) center vertex with eight neighbor d) 3×3 pixel block
(4)
(5)
(Pm�Pn)
Graph G χ(G2)
Grid Pm⊆Pn
2≤m≤n 4 if m = 25 if m≥3 Table 1. coloring of the square of cartesian products of paths,
namely grids (Pm⊆Pn)
2 R 10 log10 MSE
=
PSNR
,
2 ( , ) ( , )
1 2
, −
∑ =
×
I m n I m n
M N MSE
M N
Correlation Image Number
0.098 Tree 1
0.12 Baby 2
0.1398 Chairs 3
0.15 Washington 4
0.17 Sun 5
Each bit of the secret data is embedded in the block with the correlation equal to T or higher than it. The embedding process is started according to the defined threshold, then
the embedding picture is sent. The whole process is repeated for the second graph with color number 9 and third graph with color number 203 and 342. The color number 203, 342 are selected through trial and error with the priority of high resolution and high data embedded capacity.
It should be noted that because in T=0.1 and T=0.2, all the pixel blocks are almost included and all the images have very close embedding data, the embedding data in all the images, at T≥0.2, will be discussed.
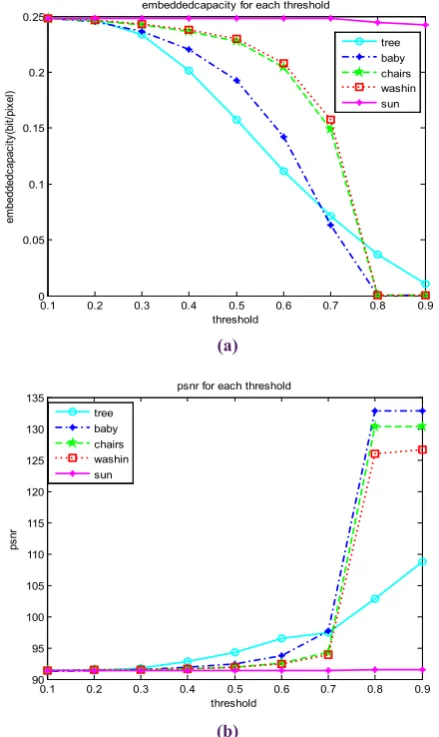
All the images in Fig 5 are colored with color number 5 and the data is embedded. As can be seen in Fig 6-a, the amount of embedded information in different thresholds decline with a steeper slop. For example in the range of 0.3 to 0.4, embedded capacities in tree, baby, chairs, Washington and Sun change from 0.2274 ،0.2030 ، 0.2035 ،0.2140 ,0.2150 to 0.1666, 0.1027, 0.1090, 0.1351,.0.1443, respectively. These results show that in some images the embedded capacity reaches at ≈0.12 in T=0.4. This trend will continue in all the images in the other thresholds.
Fig 6-b shows the images’ PSNR. According to the pictures 6-a and 6-b, it can be seen that PSNR has a reverse relationship with the embedding data capacity. It is natural because the embedding data capacity has a reverse relationship with the image resolution. On the other hand, if the embedding data capacity is high, the image resolution diminishes. And, if the embedding data capacity is low, the Fig. 4. steganography technique followed in the proposed method
Fig. 5. Test images: a) Tree b) Baby c)Chairs d) Washington e) Sun
0.1 0.2 0.3 0.4 0.5 0.6 0.7 0.8 0.9 0
0.05 0.1 0.15 0.2 0.25
threshold
em
beddedc
apac
ity
(bi
t/pi
xel
)
embeddedcapacity for each threshold
tree baby chairs washin sun
0.1 0.2 0.3 0.4 0.5 0.6 0.7 0.8 0.9 90
95 100 105 110 115 120 125 130
threshold
ps
nr
psnr for each threshold
tree baby chairs washin sun
(a)
(b)
Fig. 6. a)embedding data capacity for all of the thresholds with color number 5 b) PSNR for all of the thresholds with color
image resolution increases.
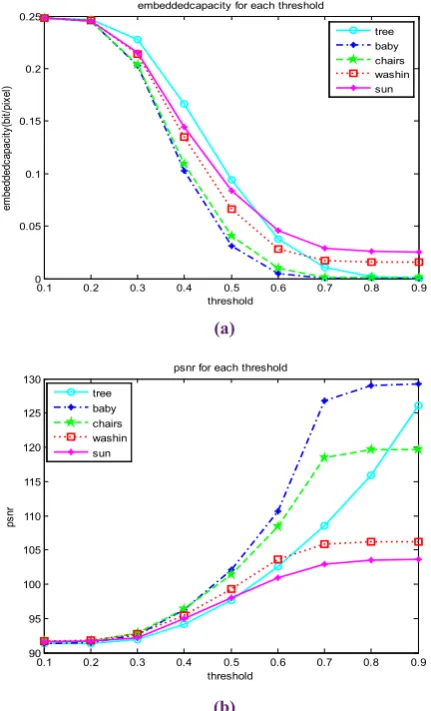
The color number 9 is applied in Fig 7-a to eliminate the steep slope. It can be seen that, similar to color number 5, the amount of embedded information in different thresholds decline with a slop steeper. In the range of 0.3 to 0.4, the embedded capacities in tree, baby, chairs, Washington and sun vary from 0,2102, 0.1948, 0.1978, 0.2056 and 0.2130 to 0.1213, 0.0877, 0.1026, 0.1179 and 0.1143, respectively. The results show in some images the embedded capacity reaches ≈0.12 in T= 0.4.
To eliminate this problem, the third graph with color number 203 obtained by trial and error has been applied.
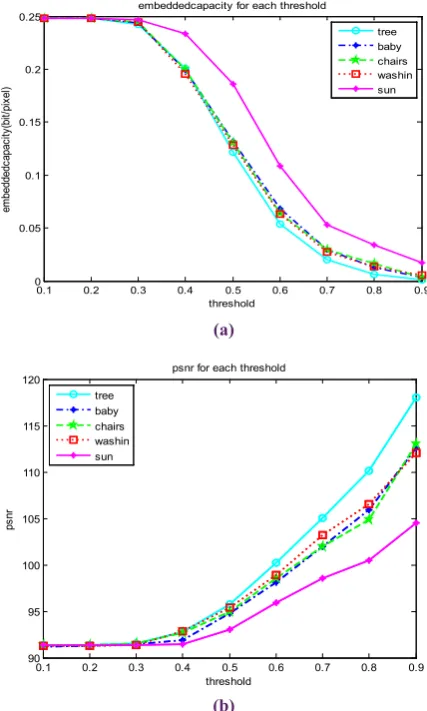
Fig. 8 shows the results of the effect of threshold on the capacity for color number 203. It can be seen that, there is a better situation compared to two previous sections, especially for the sun image. While, the other images (tree, baby, chairs and Washington) have a relatively same capacity in most thresholds. To make a comparison with the previous case, the capacity is studied in T= 0.3 and 0.4. The capacity for tree, baby, chairs, Washington and sun images in T=0.3 is 0.2425, 0.2440, 0.2442, 0.2443 and 0.2468 and in T=0.4 is 0.2007, 0.1995, 0.1997, 0.1953 and 0.2326, respectively. The results are better that the former results. Fig 9 shows the results of the effect of threshold on capacity and PSNR for color number 342. It can be seen that color number 342 has a better result compared to color number
203. The capacity for tree, baby, chairs, Washington and sun images in T=0.3 equals to 0.2337, 0.2368, 0.2442, 0.2432 and 0.2480, respectively, in T=0.4 the capacities are 0.2011, 0.2206, 0.2367, 0.2380 and 0.2480, respectively. PSNRs in all cases greater than 90 db are acceptable.
The results of Fig. 6 to Fig. 9 show that data-embedding capacity grows by increasing color number. It is approved that choosing an appropriate color number for each created image will have a good resolution, and maximum embedded information can be established. Meanwhile, there is a significant correlation between these results and the increasing of the image correlation. The image of the sun has a higher correlation than that of other images; as a result, it has a very well embedding data capacity and PSNR at all thresholds, which are in acceptable limit. Also, Washington, baby and chair images have high embedding data capacity and PSNR, but at T≥ 0/6 embedding data capacity decreased sharply. This problem can be solved by choosing a proper color number. The problem of data embedding capacity being decreased in Washington image has been resolved for the color number 362.
It was possible to choose different color numbers for different images to have a better embedding data with a high resolution image. However, the same color number has been selected for all images to show all the variations of images for the specific color number. Our suggested method in this
(a) (a)
(b) (b)
Fig. 7. a)embedding data capacity for all of the thresholds with color number 9 b)PSNR for all of the thresholds with color
number 9
Fig. 8. a)embedding data capacity for all of thresholds with color number 203 b) PSNR for all of thresholds with color
number 203
0.1 0.2 0.3 0.4 0.5 0.6 0.7 0.8 0.9 0
0.05 0.1 0.15 0.2 0.25
threshold
em
beddedc
apac
ity
(bi
t/pi
xel
)
embeddedcapacity for each threshold
tree baby chairs washin sun
0.1 0.2 0.3 0.4 0.5 0.6 0.7 0.8 0.9 90
95 100 105 110 115 120 125 130 135
threshold
ps
nr
psnr for each threshold
tree baby chairs washin sun
0.1 0.2 0.3 0.4 0.5 0.6 0.7 0.8 0.9 0
0.05 0.1 0.15 0.2 0.25
threshold
em
beddedc
apac
ity
(bi
t/pi
xel
)
embeddedcapacity for each threshold
tree baby chairs washin sun
0.1 0.2 0.3 0.4 0.5 0.6 0.7 0.8 0.9 90
95 100 105 110 115 120
threshold
ps
nr
psnr for each threshold
paper is more complex in embedding data compared to the ones in the references [8-9]; thus, we can conclude that our suggested method is more secure.
In this section, we compare the blocks of pixels correlation method and graph coloring-correlation in the image. As a result, we will select the images of tree and sun among the five desired images.
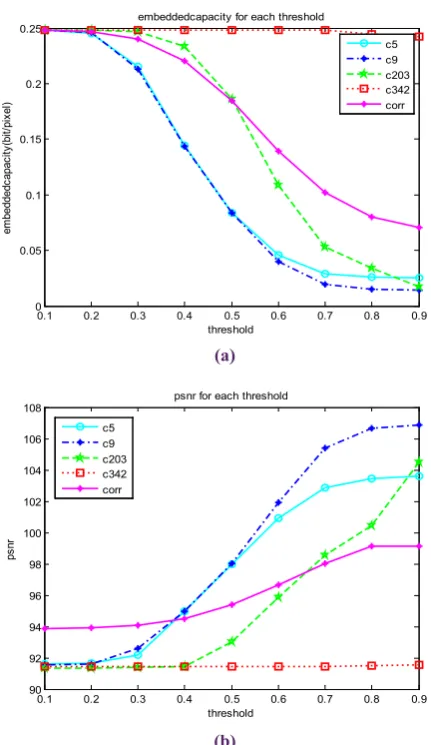
Fig. 10 shows the image of the tree results. Fig. 10-a shows that the embedding capacity in T=0.3 for color numbers 5(c5), 9(c9), 203(c203), 342(c342), are 0.2274 0.2102، 0.2425،, 0.2337 and 0.2060 in correlation method (corr), respectively. The results show that, in T=0.3 the embedding capacities at different color numbers are different. Fig. 10-b shows the five methods of PSNR, which are almost close to each other.
The results obtained from the image of the tree are plotted in Fig. 11. Fig. 11-a shows that the embedding capacity in T=0.3 for color numbers 5, 9, 203, 342, are 0.2150, 0.2130, 0.2468, 0.2448 and 0.24 in correlation method, respectively. These numbers indicate a variable capacity for the sun image. Fig. 11-b shows the PSNR of the five methods. It can be seen that PSNR for the all five different methods are almost close to each other.
As seen in Fig. 10 and Fig. 11, by selecting different chromatic number, we can create variable embedding capacity
in all images. With rising the correlation, this change will be shown obviously. Therefore, different chromatic number were displayed obviously in the image of the sun. It is notable that the results at color numbers 5 and 9, are very close to each other, but at color numbers 203 and 342, changing capacity better reflects the different thresholds.
6- Conclusion
Data hiding based on correlation of pixels block depends on image correlation where increasing image correlation will increase data hiding capacity. The drawback of this method is the capacity of each image with its correlation is constant and can not be changed.
In the presented method, we demonstrated that by assigning an appropriate color number to each image, maximum embedding capacity at different thresholds can be created. In particular, increasing image correlation changes data hiding capacity in all thresholds. Also, security of this method compared to the method of correlation between the blocks of pixels is high. This is due to the facts that in this method for data embedding step, the first image is poured with an appropriate color number and, then, data is embedded in the poured image. Finally, the image is returned to the initial state and sent to the intended recipient.
0.1 0.2 0.3 0.4 0.5 0.6 0.7 0.8 0.9 0
0.05 0.1 0.15 0.2 0.25
threshold
em
beddedc
apac
ity
(bi
t/pi
xel
)
embeddedcapacity for each threshold
tree baby chairs washin sun
(a) (a)
(b) (b)
Fig. 9. a) embedding data capacity for all of thresholds with color number 342 b) PSNR for all of thresholds with color
number 342
Fig. 10. a)embedding data capacity for all of color numbers in tree image
b) PSNR for all of color numbers in tree image
0.1 0.2 0.3 0.4 0.5 0.6 0.7 0.8 0.9 90
95 100 105 110 115 120 125 130 135
threshold
ps
nr
psnr for each threshold
tree baby chairs washin sun
0.1 0.2 0.3 0.4 0.5 0.6 0.7 0.8 0.9 0
0.05 0.1 0.15 0.2 0.25
threshold
em
beddedc
apac
ity
(bi
t/pi
xel
)
embeddedcapacity for each threshold
c5 c9 c342 c203 corr
0.1 0.2 0.3 0.4 0.5 0.6 0.7 0.8 0.9 90
95 100 105 110 115 120 125 130 135 140
threshold
ps
nr
psnr for each threshold
REFERENCES
[1] R.-Z. Wang, C.-F. Lin, J.-C. Lin, Image hiding by optimal LSB substitution and genetic algorithm, Pattern recognition, 34(3) (2001) 671-683.
[2] M.A. Abdel-Wahab, H. Selim, U. Sayed, A new method for digital image watermarking based on Vector Quantization (VQ).
[3] C.-C. Chang, W.-L. Tai, C.-C. Lin, A reversible data hiding scheme based on side match vector quantization, IEEE Transactions on Circuits and Systems for Video Technology, 16(10) (2006) 1301-1308.
[4] N.J. Hopper, Toward a theory of Steganography, CARNEGIE-MELLON UNIV PITTSBURGH PA SCHOOL OF COMPUTER SCIENCE, 2004.
[5] M.S. Shahreza, An improved method for steganography on mobile phone, WSEAS Transactions on Systems, 4(7) (2005) 955-957.
[6] J. Fridrich, P. Lisonek, Grid colorings in steganography, IEEE Transactions on Information Theory, 53(4) (2007) 1547-1549.
[7] W. Zhang, X. Zhang, S. Wang, Twice Gric Colorings in Steganography, in: Intelligent Information Hiding and Multimedia Signal Processing, 2008. IIHMSP’08 International Conference on, IEEE, 2008, pp. 1301-1304. [8] S. Yue, Z.-H. Wang, C.-Y. Chang, C.-C. Chang, M.-C.
Li, Image data hiding schemes based on graph coloring, Ubiquitous Intelligence and Computing, (2011) 476-489. [9] M. Nafari, G.H. Sheisi, M.N. Jahromi, New data
hiding method based on neighboring correlation of blocked image, in: International Conference on Digital Information and Communication Technology and Its Applications, Springer, 2011, pp. 787-801.
[10] S.M. Douiri, M.O. Medeni, S. Elbernoussi, New steganography scheme using graphs product, in: Interactive Collaborative Learning (ICL), 2014 International Conference on, IEEE, 2014, pp. 525-528. [11] W. Astuti, U.N. Wisety, Data Hiding Scheme on Medical
Image using Graph Coloring, in: Journal of Physics: Conference Series, IOP Publishing, 2015, pp. 012028. [12] S.-H. Chiang, J.-H. Yan, On L (d, 1)-labeling of
Cartesian product of a cycle and a path, Discrete Applied Mathematics, 156(15) (2008) 2867-2881.
[13] D.B. West, Introduction to graph theory, Prentice hall Upper Saddle River, 2001.
(a)
(b)
Fig. 11. a) embedding data capacity for all of color numbers in sun image b) PSNR for all of color numbers in
sun image
0.1 0.2 0.3 0.4 0.5 0.6 0.7 0.8 0.9 0
0.05 0.1 0.15 0.2 0.25
threshold
em
beddedc
apac
ity
(bi
t/pi
xel
)
embeddedcapacity for each threshold
c5 c9 c203 c342 corr
0.1 0.2 0.3 0.4 0.5 0.6 0.7 0.8 0.9 90
92 94 96 98 100 102 104 106 108
threshold
ps
nr
psnr for each threshold
c5 c9 c203 c342 corr
Please cite this article using:
G. Ghadimi, M. Nejati Jahromi, E. Ghaemi, A. H. Heydari, Data Hiding Method Based on Graph Coloring and Pixel Block‘s Correlation in Color Image, AUT J. Elec. Eng., 49(2)(2017)123-130.