Phenol Based RNA Isolation is the Optimum Method for
Study of Gene Expression in Human Urinary Sediment
H. Yazdani
1, Sh. Kalantari
2, M. Nafar
2, M. Naji
3*1 Department of Biology, Faculty of Basic Science, Islamic Azad University, Science and Research Branch, Tehran, Islamic Republic of Iran
2 Chronic Kidney Disease Research Center, Shahid Beheshti University of Medical Sciences, Tehran, Islamic Republic of Iran
3 Urology and Nephrology Research Center, Shahid Beheshti University of Medical Sciences, Tehran, Islamic Republic of Iran
Received: 27 October 2018 / Revised: 6 May 2019 / Accepted: 26 May 2019
Abstract
Evaluation of gene expression in urinary sediment has been considered as a
promising non-invasive approach for biomarker identification of kidney diseases.
Nonetheless, there are several challenges in extraction of RNA from this valuable
source of biomarkers, mostly because of the factors that have influence on quality of
isolated RNA such as low cellular content. Accordingly, we compared the quality of
RNA from urine sediment samples that was isolated by four different methods. TRIzol
reagent with basic protocol (method 1), modified procedure of TRIzol (method 2), a
column-based protocol (method 3) and combination of method 1 and 3 (method 4) were
applied for isolation of RNA from identical aliquots of five healthy urine samples. The
quality and yield of isolated RNA were evaluated based on concentration and purity.
Expression levels of GAPDH and miR-21 were studied by quantitative RT-PCR.
Methods 1 and 2 showed the highest RNA yield while no difference in purity of RNA in
different methods was noticed. Quantitative RT-PCR findings indicated that Ct values
in samples of method 1 had the lowest level. Although higher concentrations of RNA
were isolated by method 2, the declined Ct values in this method might indicate
degradation of isolated RNA. Column based protocols (method 3 and 4) were failed to
show significant recovery of RNA. It seems that isolation procedure using TRIzol, as a
phenol based method, is the most efficient, robust and reliable procedure for RNA
isolation from urinary sediment cells.
Keywords: RNA isolation; Phenol based method; TRIzol; Urinary sediment; MicroRNA.
* Corresponding author: Tel/Fax: +982122580333; Email: [email protected]
Introduction
Gene expression analysis of urine sediment has been a valuable practice for non-invasive diagnosis of kidney
Thereafter, other groups showed increasing interest in measuring mRNA levels of cytokines, chemokines, growth factors and other molecules for diagnosis and prognosis of renal and other urological diseases [2-6].
Isolation of sufficient amount of total RNA with high quality is a major technical problem for biomarker discovery studies using urine sediment. Relatively low cellular content of urine, especially in healthy individuals, makes the RNA assessment difficult and challenging. Urine pH, temperature, storage and handling condition, and other biochemical parameters could affect RNases release from urine sediment cells which could be dramatically damaging for isolated RNA [7]. Most of the researchers have utilized column based technique due to its simplicity and rapidity. However, the yield of isolated RNA might not be high enough to handle the downstream experimental steps [8]. Herein, we decided to compare RNA isolation methods which cover all main methodologies for RNA extraction: (i) phenol based method which is performed by using an organic solvent, phase separation and RNA precipitation, (ii) column based method which takes the advantage of silica columns’ property for binding of nucleic acids, (iii) combined method which use high lysis capacity of solvents in phenol based method and RNA recovery potential of column based method [9]. In this study, we evaluated the expression level of GAPDH mRNA to compare efficiency of different isolation methods. Moreover, we studied the expression level of miR-21 in different isolation methods. Therefore, an insight about the effective and optimum procedure for isolation of qualified RNA assists researchers in the study design and achieving the desired results.
Materials and Methods
Sample collection and preparation
Urine samples were collected from five healthy volunteers and each sample was aliquoted into 4 tubes (30 ml each). Urine sediment was collected by centrifugation for 8 min at 14000 ×g in 4 ºC and immediately snap-frozen in liquid nitrogen. All the samples were stored at -80 ºC until use. The consent form was signed by participants and confirmed by the ethic committee of Shahid Beheshti University of
Medical Sciences.
RNA isolation methods
Four different RNA isolation methods were used for each sample and RNA yield and purity were compared. (i) Method 1, RNA isolation was accomplished by TRIzol reagent (Thermo Scientific, Waltham, MA, USA) according to manufacturer instruction and RNA pellet was dissolved in 30 μl of diethyl pyrocarbonate (DEPC)-water. (ii) Method 2 was based on TRIzol reagent with some variations. We have previously used this method for isolation of total RNA enriched in miRNAs [10]. In this method the same procedure was used for isolation of aqueous phase (containing RNA fraction). Afterward, 1 ml of 100% ethanol was used instead of isopropanol and the mixture was incubated at -20 ºC for overnight. RNA pellet was precipitated by centrifugation for 45 min at 14000 ×g in 4 ºC. Pellet was washed with 75% ethanol and centrifuged for 8 min at 14000 ×g in 4 ºC. To facilitate RNA precipitation, 0.35 μl of glycogen (20mg/ml) was added to aqueous phase in method 1 and 2. (iii) Method 3, a column based technique was performed by using FastPure RNA kit (TaKaRa) per manufacturer’s instruction. (iv) Method 4 was an integration of method 1 and method 3. Briefly, lysis of sample was carried out by TRIzol reagent and aqueous phase was separated according to method 1. Afterward, aqueous phase was mixed with 500 μl of 70% ethanol and the procedure was followed according to FastPure RNA kit (TaKaRa) instruction. The RNA concentration was quantified by absorbance at 260 nm and the purity of RNA was evaluated by the ratio of absorbance at 260 to 280 nm using WPA spectrophotometer (Biochrom).
Complementary DNA (cDNA) synthesis
Genomic DNA contamination from RNA samples was removed by DNase I (RNase-free) treatment (Thermo Scientific, Waltham, MA, USA). Total RNA from urine sediment samples were reverse transcribed using cDNA Synthesis kit (Thermo Scientific, Waltham, MA, USA). The reaction was performed in final volume of 20 μl using random hexamer primers, following the protocol provided by the manufacturer. We used 400 ng
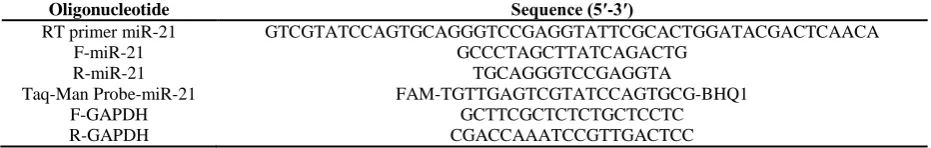
Table 1. Sequence of oligonucleotides for quantification of GAPDH and miR-21
Oligonucleotide Sequence (5′-3′)
RT primer miR-21 GTCGTATCCAGTGCAGGGTCCGAGGTATTCGCACTGGATACGACTCAACA
F-miR-21 GCCCTAGCTTATCAGACTG
R-miR-21 TGCAGGGTCCGAGGTA
Taq-Man Probe-miR-21 FAM-TGTTGAGTCGTATCCAGTGCG-BHQ1
F-GAPDH GCTTCGCTCTCTGCTCCTC
of the isolated RNA as a template for cDNA synthesis. For evaluation of miR-21, specific stem-loop RT primer (Table 1) (0.375 µM) was used for cDNA synthesis according to RevertAid instruction. 50 ng of total RNA was used for cDNA synthesis of miR-21.
Quantitative RT-PCR
All primers and probes were designed by AlleleID 6 software (Table 1). For quantification of GAPDH, PCR reactions (20 µl) were composed of 10 μl 2X RealQ Plus MasterMix Green (Ampliqon, Denmark), 0.8 μl of each primer, 2 μl first-strand cDNA template (1:2 in distilled water) and 6.4 μl distilled water. PCR reactions for quantification of miR-21 were consisted of 10 μl 2X RealQ Plus MasterMix for Probe (Ampliqon, Denmark), 0.8 μl of each primer, 0.5 μl probe, 2 μl first-strand cDNA template (1:2 in distilled water) and 5.9 μl distilled water. Thermocycling parameters were applied according to manufacturer’s recommendation using Rotor-Gene Q instrument (Qiagen).
Statistical analysis
Normality of data in each experimental group was appraised using Kolmogorov–Smirnov method.
ANOVA was used to compare findings between
different methods. Statistical analysis was performed by GraphPad prism 7.01 software. P-values < 0.05 were considered as significant.
Results
RNA concentrations were significantly higher in method 1 (219 ± 62.8 ng/µl) and 2 (235.6 ± 42.6 ng/µl) when compared with method 3 and 4 (Table 2). Purity indices (260/280 and 260/230 ratios) did not reveal any significant differences among different isolation methods (Table 2). RT-PCR of GAPDH as a housekeeping gene indicated positive and specific amplification in all five samples (A-E) of method 1 but only in one of the samples of methods 2 and 3; specific PCR products were detected (Table 3).
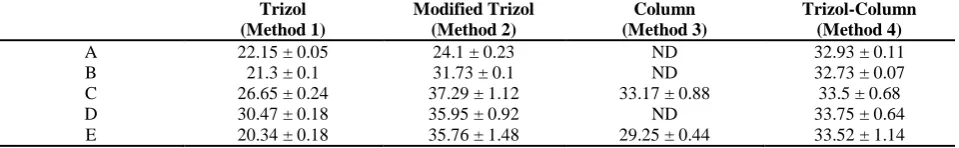
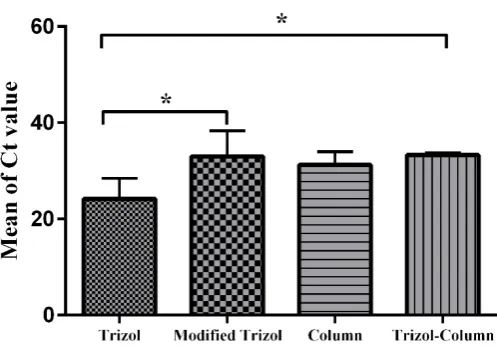
Extensive RNA degradation during isolation in methods 2-4 may reason unfavorable results of GAPDH expression. It has been demonstrated that miRNAs are relatively stable RNA species of urine [11]. Therefore, we appraised the expression of miR-21 in our samples. Contrary to the expression of GAPDH, miR-21 was detected in most of samples (Table 4). Interestingly, miR-21 was identified in significantly higher levels in RNA samples processed in method 1 (Figure 1).
Table 2. Concentration and purity of RNA in different isolation methods RNA Concentration (ng/µl) 260/280
Absorbance
260/230 Absorbance
Trizol (Method 1) 219 ± 62.8 1.34 ± 0.03 0.31 ± 0.04
Modified Trizol (Method 2) 235.6 ± 42.6 1.33 ± 0.04 0.3 ± 0.03
Column (Method 3) 35.5 ± 21.6a,b 1.31 ± 0.38 0.16 ± 0.07
Trizol-Column (Method 4) 19.2 ± 1a,b 1.32 ± 0.02 0.46 ± 0.02
a, significant difference with Trizol method. b, significant difference with modified Trizol method.
Table 3. Comparison of mean of Ct values for expression of GAPDH mRNA in repeated aliquots isolated by different methods Trizol
(Method 1)
Modified Trizol (Method 2)
Column (Method 3)
Trizol-Column (Method 4)
A 22.99 ± 0 24.04 ± 0.15 ND ND
B 26.45 ± 0.29 ND ND ND
C 26.47 ± 0.26 ND ND ND
D 29.97 ± 0.09 ND ND ND
E 21.26 ± 0.21 ND 26.74 ± 0.18 ND
ND, not detected
Table 4. Comparison of mean of Ct values for expression of miR-21 in repeated aliquots isolated by different methods. Trizol
(Method 1)
Modified Trizol (Method 2)
Column (Method 3)
Trizol-Column (Method 4)
A 22.15 ± 0.05 24.1 ± 0.23 ND 32.93 ± 0.11
B 21.3 ± 0.1 31.73 ± 0.1 ND 32.73 ± 0.07
C 26.65 ± 0.24 37.29 ± 1.12 33.17 ± 0.88 33.5 ± 0.68
D 30.47 ± 0.18 35.95 ± 0.92 ND 33.75 ± 0.64
E 20.34 ± 0.18 35.76 ± 1.48 29.25 ± 0.44 33.52 ± 1.14
Discussion
Assessment of gene expression in urinary sediment would provide an ideal non-invasive alternate marker for different renal diseases [12]. Quantification of expression levels of mRNAs could be utilized as more suitable experimental tool in comparison with protein assessment especially for renal diseases as it is not affected by glomerular filtration and tubular reabsorption [12]. However, isolation of RNA from these valuable samples with appropriate integrity and concentration, as a critical step for reliable discovery of biomarkers, should be addressed. In the current study, we isolated RNA from identical aliquots of five samples using four different methods. Although the simplicity and time of isolation methods are important factors, achieving high quality and quantity RNA are superior criteria for selection of an isolation technique. According to our experience, the yield of RNA isolation from urinary sediment is very low and varies based on individual differences; therefore choosing a method with acceptable recovery is useful and essential. The highest concentration of RNA was isolated from method 1 (TRIzol) and 2 (modified TRIzol), but much lesser amount of RNA was recovered from method 3 (column-based isolation) and 4 (TRIzol and column). Generally, phenol based isolation strategies (method 1 and 2) provide higher yield than column based isolations, but phenol and other agents may be co-precipitated with RNA [13]. Co-precipitated compounds can be cause of misleading results by their inhibitory properties in downstream reactions. Furthermore, maximum absorbance of phenol at 260 nm may overestimate RNA concentration. Alternatively, the most
reproducible results can be attained by column based isolations which are less sensitive to personnel’s skill and experience.
centrifuge times, should be considered as an optimized method for isolation of RNA from urinary sediment cells.
Acknowledgement
We would like to thank Mrs. Ghazaleh Shakiba for her valuable assistance in collection and preparation of samples. This work was financially supported by Chronic Kidney Disease Research Center, Shahid Beheshti University of Medical Sciences, Tehran, Iran.
Funding
This study was funded by Chronic Kidney Disease Research Center (CKDRC) at Shahid Beheshti University of Medical Sciences with grant no. 462/4.
References
1. Li B., Hartono C., Ding R., Sharma V.K., Ramaswamy R., Qian B., Serur D., Mouradian J., Schwartz J.E., Suthanthiran M. Noninvasive diagnosis of renal-allograft rejection by measurement of messenger RNA for perforin and granzyme B in urine. N. Engl. J. Med.344: 947-54. (2001).
2. Szeto C.-C., Chow K.-M., Chung K.-Y., Ching-Har Kwan B., Leung C.-B., Kam-Tao Li P. The clinical course of peritoneal dialysis-related peritonitis caused by Corynebacterium species. Nephrol. Dial. Transplant. 20: 2793-6. (2005).
3. Szeto C.C., Chow K.M., Lai K.B., Szeto C.Y.K., Chan R.W.Y., Kwan B.C.H., Chung K.Y., Li P.K.T., Lai F.M.M. mRNA expression of target genes in the urinary sediment as a noninvasive prognostic indicator of CKD. Am. J. Kidney. Dis.47: 578-86. (2006).
4. Mengual L., Lozano J.J., Ingelmo-Torres M., Izquierdo L., Musquera M., Ribal M.J., Alcaraz A. Using gene expression from urine sediment to diagnose prostate cancer: development of a new multiplex mRNA urine test and validation of current biomarkers. BMC Cancer16: 76. (2016).
5. Avihingsanon Y., Phumesin P., Benjachat T., Akkasilpa S., Kittikowit V., Praditpornsilpa K., Wongpiyabavorn J., Eiam-Ong S., Hemachudha T., Tungsanga K. Measurement of urinary chemokine and growth factor
messenger RNAs: a noninvasive monitoring in lupus nephritis. Kidney Int.69: 747-53. (2006).
6. Tsugawa K., Oki E., Suzuki K., Imaizumi T., Ito E., Tanaka H. Expression of mRNA for functional molecules in urinary sediment in glomerulonephritis. Pediatr. Nephrol.23: 395-401. (2008).
7. Wang G., SZETO C.C. Quantification of gene expression in urinary sediment for the study of renal diseases. Nephrology12: 494-9. (2007).
8. Miah S., Dudziec E., Drayton R., Zlotta A., Morgan S., Rosario D., Hamdy F., Catto J. An evaluation of urinary microRNA reveals a high sensitivity for bladder cancer. Br. J. Cancer107: 123. (2012).
9. El-Khoury V., Pierson S., Kaoma T., Bernardin F., Berchem G. Assessing cellular and circulating miRNA recovery: the impact of the RNA isolation method and the quantity of input material. Sci. Rep.6: 19529. (2016). 10. Naji M., Aleyasin A., Nekoonam S., Arefian E., Mahdian
R., Amidi F. Differential Expression of 93 and miR-21 in Granulosa Cells and Follicular Fluid of Polycystic Ovary Syndrome Associating with Different Phenotypes. Sci. Rep.7: 14671. (2017).
11. Mall C., Rocke D.M., Durbin-Johnson B., Weiss R.H. Stability of miRNA in human urine supports its biomarker potential. Biomark. Med.7: 623-31. (2013).
12. Colucci G., Floege J., Schena F. The urinary sediment beyond light microscopical examination. Nephrol. Dial. Transplant.21: 1482-5. (2006).
13. Nolan T., Hands R.E., Bustin S.A. Quantification of mRNA using real-time RT-PCR. Nat. Protoc. 1: 1559. (2006).
14. Naji M., Nekoonam S., Aleyasin A., Arefian E., Mahdian R., Azizi E., Nashtaei M.S., Amidi F. Expression of miR-15a, miR-145, and miR-182 in granulosa-lutein cells, follicular fluid, and serum of women with polycystic ovary syndrome (PCOS). Arch. Gynecol. Obstet. 297: 221-31. (2018).
15. Szeto C.C., Ching-Ha K.B., Ka-Bik L., Mac-Moune L.F., Cheung-Lung C.P., Gang W., Kai-Ming C., Kam-Tao L.P. Micro-RNA expression in the urinary sediment of patients with chronic kidney diseases. Dis. Markers 33: 137-44. (2012).